. 2024 May 28;96(21):8441-8449.
doi: 10.1021/acs.analchem.4c00116. Epub 2024 May 17.

Absorption Correction for 3D Elemental Distributions of Dental Composite Materials Using Laboratory Confocal Micro-X-ray Fluorescence Spectroscopy

Affiliations

Absorption Correction for 3D Elemental Distributions of Dental Composite Materials Using Laboratory Confocal Micro-X-ray Fluorescence Spectroscopy

Leona J Bauer et al. Anal Chem. .

Abstract

Confocal micro-X-ray fluorescence (micro-XRF) spectroscopy facilitates three-dimensional (3D) elemental imaging of heterogeneous samples in the micrometer range. Laboratory setups using X-ray tube excitation render the method accessible for diverse research fields but interpretation of results and quantification remain challenging. The attenuation of X-rays in composites depends on the photon energy as well as on the composition and density of the material. For confocal micro-XRF, attenuation severely impacts elemental distribution information, as the signal from deeper layers is distorted by superficial layers. Absorption correction and quantification of fluorescence measurements in heterogeneous composite samples have so far not been reported. Here, an absorption correction approach for confocal micro-XRF combining density information from microcomputed tomography (micro-CT) data with laboratory X-ray absorption spectroscopy (XAS) and synchrotron transmission measurements is presented. The energy dependency of the probing volume is considered during the correction. The methodology is demonstrated on a model composite sample consisting of a bovine tooth with a clinically used restoration material.


Conflict of interest statement

The authors declare no competing financial interest.

Figures

Figure 1
Figure 1
Schematic view of different sample types in relation to the confocal micro-XRF geometry. Different patterns depict areas in the samples with different composition and density. The intersection of excitation and detection path marks the probing volume from which information is derived.
Figure 2
Figure 2
Top-left: Reconstructed micro-CT volume of a full bovine tooth. Top-right: 3 mm thick cross section of the bovine tooth with an SDR flow+ filling in the root canal, which was cut for further measurements to a thickness of ∼850 μm (sample T1). Bottom: slice of half of the cross section indicating the measured areas A1–3.
Figure 3
Figure 3
Linear mass absorption coefficients of SDR flow+ (magenta, green, and black) and bovine dentine (blue and black). Solid lines and cross marker points are derived from transmission measurements at BAM and PTB beamlines at BESSY II and laboratory XAS measurements at the TU Berlin. The gray area shows the range of the calculation assuming a density uncertainty of ±0.15 g/cm3 (SDR flow) and ±0.075 g/cm3 (bov. dentine).
Figure 4
Figure 4
Measured and corrected elemental distributions of Ba, Yb, Sr, Ca, and Zn at A1 first orientation. Color scales show the intensity (cps) of the fluorescence.
Figure 5
Figure 5
(Left) Corrected elemental distributions of Ca Kα measured at A1. (A) shows the measured elemental distribution. Absorption correction is performed (B) assuming an infinitesimal small probing volume and (C) considering the probing volume as 2D Gaussian distribution. (Right) corresponding micro-CT slice and 2D Gaussian distributions. The scale of the elemental distributions, 2D Gaussian distributions, and the virtual micro-CT slice are the same for easy comparison. The color scale shows the height of the Gaussian distribution. Scale bar: 100 μm.
Figure 6
Figure 6
Measured (A) and corrected (B) elemental distributions and corresponding micro-CT virtual slice of partially overlapping interface between filling and dentine (A2). The probing volume size is considered. Color scales show the intensity (cps) of the fluorescence signal. The arrows highlight details in the Zn and Yb distribution. Blue arrow: gap between filling and dentine.
Figure 7
Figure 7
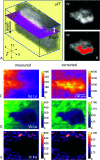
Micro-CT data, measured and corrected elemental distributions of region A3 of the filling with a denser grain. (A) shows a micro-CT volume depicting half of the grain under the surface in the filling material. The magenta-colored slice at a depth of 80 μm marks the virtual slice where the elemental distribution is measured by confocal micro-XRF. (B) shows a virtual micro-CT slice of the grain in xy, with and without the more dense area of the grain marked in red. (C–E) show the measured (left) and corrected (right) distributions of Ba, Yb, and Sr. Color scales show the intensity (cps) of the fluorescence signal.

References

    1. Förste F.; Mantouvalou I.; Kanngießer B.; Stosnach H.; Lachner L.; Fischer K.; Krause K. Selective mineral transport barriers at Cuscuta-host infection sites. Physiol. Plant. 2020, 168, 934–947. 10.1111/ppl.13035. - DOI - PubMed
    1. Fittschen U. E. A.; Falkenberg G. Confocal MXRF in environmental applications. Anal. Bioanal. Chem. 2011, 400, 1743–1750. 10.1007/s00216-011-4873-y. - DOI - PubMed
    1. Mantouvalou I.; Lange K.; Wolff T.; Grötzsch D.; Lühl L.; Haschke M.; Hahn O.; Kanngießer B. A compact 3D micro X-ray fluorescence spectrometer with X-ray tube excitation for archaeometric applications. J. Anal. At. Spectrom. 2010, 25, 554–561. 10.1039/b915912f. - DOI
    1. McIntosh K. G.; Cordes N. L.; Patterson B. M.; Havrilla G. J. Laboratory-based characterization of plutonium in soil particles using micro-XRF and 3D confocal XRF. J. Anal. At. Spectrom. 2015, 30, 1511–1517. 10.1039/C5JA00068H. - DOI
    1. Heimler K.; Gottschalk C.; Vogt C. Confocal micro X-ray fluorescence analysis for the non-destructive investigation of structured and inhomogeneous samples. Anal. Bioanal. Chem. 2023, 415, 5083–5100. 10.1007/s00216-023-04829-x. - DOI - PMC - PubMed