. 2024 Jul;30(1):117.
doi: 10.3892/mmr.2024.13241. Epub 2024 May 17.

Puerariae lobatae Radix ameliorates chronic kidney disease by reshaping gut microbiota and downregulating Wnt/β‑catenin signaling

Affiliations

Puerariae lobatae Radix ameliorates chronic kidney disease by reshaping gut microbiota and downregulating Wnt/β‑catenin signaling

Peng Wu et al. Mol Med Rep. 2024 Jul.

Abstract

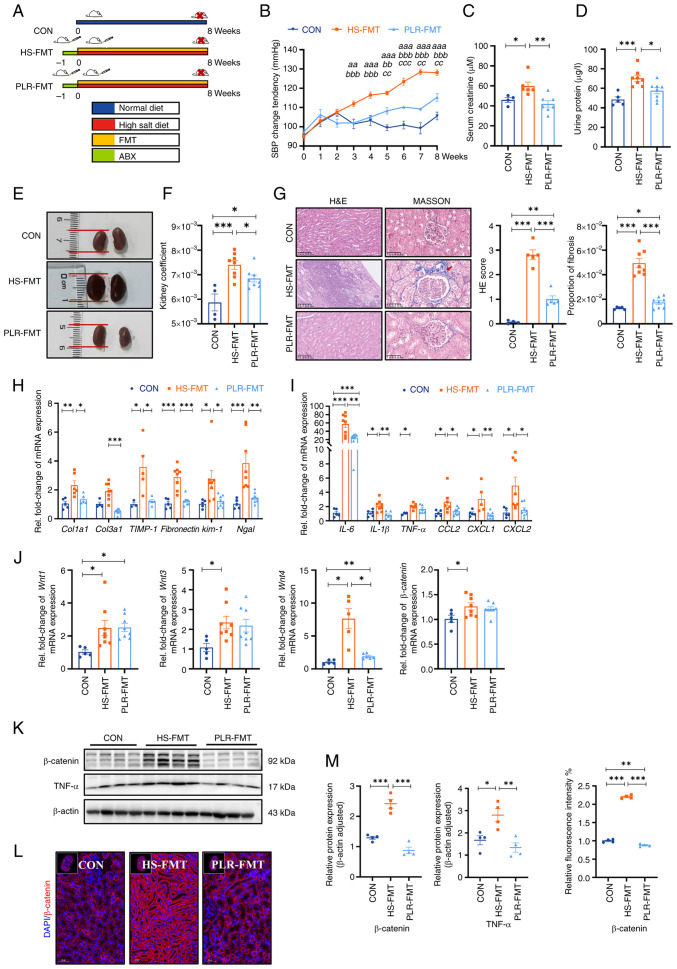
Gut microbiota dysfunction is a key factor affecting chronic kidney disease (CKD) susceptibility. Puerariae lobatae Radix (PLR), a traditional Chinese medicine and food homologous herb, is known to promote the gut microbiota homeostasis; however, its role in renoprotection remains unknown. The present study aimed to investigate the efficacy and potential mechanism of PLR to alleviate CKD. An 8‑week 2% NaCl‑feeding murine model was applied to induce CKD and evaluate the therapeutic effect of PLR supplementary. After gavage for 8 weeks, The medium and high doses of PLR significantly alleviated CKD‑associated creatinine, urine protein increasement and nephritic histopathological injury. Moreover, PLR protected kidney from fibrosis by reducing inflammatory response and downregulating the canonical Wnt/β‑catenin pathway. Furthermore, PLR rescued the gut microbiota dysbiosis and protected against high salt‑induced gut barrier dysfunction. Enrichment of Akkermansia and Bifidobacterium was found after PLR intervention, the relative abundances of which were in positive correlation with normal maintenance of renal histology and function. Next, fecal microbiota transplantation experiment verified that the positive effect of PLR on CKD was, at least partially, exerted through gut microbiota reestablishment and downregulation of the Wnt/β‑catenin pathway. The present study provided evidence for a new function of PLR on kidney protection and put forward a potential therapeutic strategy target for CKD.

Keywords: Puerariae lobatae Radix; Wnt/β‑catenin pathway; chronic kidney disease; fecal microbiota transplantation; gut microbiota; high salt diet.


Conflict of interest statement

The authors declare that they have no competing interests.

Figures

Figure 1.
Figure 1.
PLR alleviates kidney injuries induced by HS diet and downregulates the Wnt/β-catenin pathway in kidney of HS mice. (A) SBP change of groups were evaluated non-invasively in the course of experiment (n=6). (B) Serum creatinine after 8 weeks (n=6). (C) Urine protein after 8 weeks (n=6). (D) Representative gross anatomy images of the kidney (n=6). (E) H&E and MASSON staining of the kidney and the pathology scores and histological analysis. Fibrosis in the glomeruli and renal interstitium is indicated with red arrows. H&E staining scale bar, 100 µm; MASSON staining scale bar, 50 µm (n=6). (F) Kidney coefficient (n=6). (G) RT-qPCR analysis of kidney injuries-related genes (n=6). (H) Urine Na+ concentration (n=6). (I) Serum Na+ concentration (n=6). (J) RT-qPCR analysis of inflammatory factors-related genes in kidney (n=6). (K) Gene-set enrichment analyses based on Kyoto Encyclopedia of Genes and Genomes database performed on the RNA sequencing data (n=3). (L) Gene-set enrichment analyses based on Gene Ontology database performed on the RNA sequencing data (n=3). (M) RT-qPCR analysis of Wnt1, Wnt3, Wnt4 and β-catenin genes in kidney (n=5-6). (N) β-catenin and TNF-α protein levels in the kidney (n=4). (O) Representative in situ detection of β-catenin in renal cortex was measured by immunofluorescent staining. Kidney tissue sections were stained with DAPI (blue) and probed with β-catenin (red). Scale bar, 50 µm (n=4). Results are expressed as the mean ± SEM. *P<0.05, **P<0.01 and ***P<0.001 vs. the CON group; #P<0.05, ##P<0.01 and ###P<0.001 vs. the HS group; &P<0.05, &&P<0.01 and &&&P<0.001 vs. the PLR-L group; $P<0.05, and $$$P<0.001 vs. the PLR-M group in A-E. ***P<0.001, **P<0.01 and *P<0.05 were determined by one-way ANOVA with Bonferroni's post hoc test in G-J and M-O. PLR, Puerariae lobatae Radix; HS, high salt; SBP, systolic blood pressure; H&E, hematoxylin-eosin; RT-qPCR, reverse transcription-quantitative PCR; ns, not significant.
Figure 2.
Figure 2.
PLR reduces intestinal inflammation and protects against intestinal barrier damage in HS mice. (A) Representative gross anatomy images of the colon and the colon length measurement (n=6). (B) Representative L-012 fluorescent staining and animal fluorescence imaging (n=5-6). (C) RT-qPCR analysis of inflammatory factors' genes in colon (n=6). (D) Relative serum TNF-α levels (n=4-6). (E) Relative serum LPS levels (n=6). (F) FITC-dextran 4-KD level in the plasma (n=6). (G) H&E staining and ZO-1, Occludin and Claudin-1 immunohistochemical staining in colon tissues. Scale bar, 100 µm (n=3-6). (H) Quantification of immunohistochemistry (n=3-6). (I) RT-qPCR analysis of tight junction proteins genes in colon (n=5-6). (J) ZO-1 and Occludin protein levels in the colon (n=3). Results are expressed as the mean ± SEM. ***P<0.001, **P<0.01 and *P<0.05 were determined by one-way ANOVA with Bonferroni's post hoc test. PLR, Puerariae lobatae Radix; HS, high salt; RT-qPCR, reverse transcription-quantitative PCR; LPS, lipopolysaccharide; H&E, hematoxylin-eosin; ZO-1, zonula occludens 1.
Figure 3.
Figure 3.
PLR reverses intestinal microbial dysbiosis in HS mice and remodels gut microbiota by increasing the relative abundance of probiotics. (A) Relative bacterial abundance at the genus level in the feces of mice. (B) Histogram of the LDA score showing the biomarker at the genus level of each group. (C) Relative abundance of indicator species at the genus level showing the enriched bacteria in the gut microbiome among groups. (D) Microbial Dysbiosis index of each group. (E) PCoA based on the weighted UniFrac analysis of operational taxonomic units. (F) NMDS based on the weighted UniFrac analysis of operational taxonomic units. (G) Correlation heatmap of major indicator species and biomarkers based on LDA score and major injury indicators, scale shows correlation coefficient. (H) Kyoto Encyclopedia of Genes and Genomes pathway analysis of function distribution and difference analysis based on Tax4Fun prediction results. Results are expressed as the mean ± SEM (n=6–10 for each group). ***P<0.001, **P<0.01 and *P<0.05 were determined by one-way ANOVA with Bonferroni's post hoc test or Kruskal-Wallis test with Dunn's post hoc test in C and D, adonis analysis and anosim analysis in E, Spearman analysis in G and ANOVA test with Tukey's HSD test in H. PLR, Puerariae lobatae Radix; HS, high salt; LDA, linear discriminant analysis; PCoA, principal coordinates analysis; NMDS, non-metric multidimensional scaling; ns, not significant.
Figure 4.
Figure 4.
Gut microbiota from mice treated with PLR improve kidney tissue damage induced by HS diet and downregulate the Wnt/β-catenin pathway. (A) Flow chart of FMT experimental design. 8-week-old male C57BL/6 mice were administered drinking water containing 2% w/v NaCl for 8 weeks. (B) SBP change was evaluated non-invasively during experiment. aaP<0.01 and aaaP<0.001 for the CON group vs. the HS-FMT group on the corresponding week; bbP<0.01 and bbbP<0.001 for the PLR-FMT group vs. the HS-FMT group on the corresponding week; ccP<0.01 and cccP<0.001 for the PLR-FMT group vs. the CON group on the corresponding week. Two-way repeated-measures ANOVA with Bonferroni's post hoc test was used for statistical analysis. (C) Serum creatinine after 8 weeks. (D) Urine protein after 8 weeks. (E) Representative gross anatomy pictures of the kidney. (F) Kidney coefficient. (G) H&E and MASSON staining of the kidney and the pathology scores and histological analysis., Fibrosis in the glomeruli and renal interstitium is indicated with a red arrow. H&E staining scale bar, 100 µm; MASSON staining scale bar, 50 µm (n=4-8). (H) RT-qPCR analysis of kidney injuries-related genes. (I) RT-qPCR analysis of inflammatory factors' genes in kidney. (J) RT-qPCR analysis of Wnt1, Wnt3, Wnt4 and β-catenin genes in kidney (n=5-8). (K) β-catenin and TNF-α protein levels in the kidney. (L) Representative in situ detection of β-catenin in renal cortex was measured by immunofluorescent staining. Kidney tissue sections were stained with DAPI (blue) and probed with β-catenin (red). Scale bar, 50 µm (n=4). (M) Quantification of western blot and immunofluorescence. Results are expressed as the mean ± SEM (n=5–8 for each group). ***P<0.001, **P<0.01 and *P<0.05 were determined by one-way ANOVA with Bonferroni's post hoc test in C, D and F-I. PLR, Puerariae lobatae Radix; HS, high salt; FMT, fecal microbiota transplantation; ABX, antibiotic; SBP, systolic blood pressure; HE, hematoxylin-eosin; RT-qPCR, reverse transcription-quantitative PCR.
Figure 5.
Figure 5.
FMT from mice treated with PLR reduce intestinal inflammation and protect intestinal barrier function. (A) Representative gross anatomy pictures of the colon and the colon length measurement. (B) Representative L-012 fluorescent staining and animal fluorescence imaging (n=5-6). (C) RT-qPCR analysis of inflammatory factors' genes in colon. (D) Relative serum TNF-αlevels. (E) Relative serum LPS levels. (F) FD-4 levels in the plasma. (G) H&E staining and ZO-1, Occludin and Claudin-1 immunohistochemical staining in colon tissues. Scale bar, 100 or 250 µm (n=3-6). (H) Quantification of immunohistochemistry. (I) RT-qPCR analysis of tight junction proteins genes in colon (n=5-6). (J) ZO-1, Occludin and Claudin-1 protein levels in the colon (n=4). Results are expressed as the mean ± SEM (n=4–8 for each group). ***P<0.001, **P<0.01 and *P<0.05 were determined by one-way ANOVA with Bonferroni's post hoc test. FMT, fecal microbiota transplantation; PLR, Puerariae lobatae Radix; HS, high salt; CON, control; LPS, lipopolysaccharide; FD-4, FITC-dextran 4-KD; H&E, hematoxylin-eosin; ns, not significant; RT-qPCR, reverse transcription-quantitative PCR; ZO-1, zonula occludens 1.
Figure 6.
Figure 6.
FMT from mice treated with PLR relieve intestinal microbial dysbiosis and rebuild healthy microbiota environment. (A) Relative bacterial abundance at the genus level in the feces of mice. (B) Histogram of the LDA score showing the biomarker at the genus level between the HS-FMT group and the PLR-FMT group. (C) Relative abundance of indicator species at the genus level showing the enriched bacteria in the gut microbiome among groups. (D) Microbial Dysbiosis index of each group. (E) PCoA based on the weighted UniFrac analysis of operational taxonomic units. (F) NMDS based on the weighted UniFrac analysis of operational taxonomic units. (G) Correlation heatmap of major indicator species and biomarkers based on LDA score and major injury indicators, scale shows correlation coefficient. (H) Kyoto Encyclopedia of Genes and Genomes pathway analysis of function distribution and difference analysis based on Tax4Fun prediction results. Results are expressed as the mean ± SEM (n=5–8 for each group). ***P<0.001, **P<0.01 and *P<0.05 were determined by one-way ANOVA with Bonferroni's post hoc test or Kruskal-Wallis test with Dunn's post hoc test in C and D, adonis analysis and anosim analysis in E, Spearman analysis in G, ANOVA test with Tukey's HSD test in H. FMT, fecal microbiota transplantation; HS, high salt; PLR, Puerariae lobatae Radix; LDA, linear discriminant analysis; PCoA, principal coordinates analysis; NMDS, non-metric multidimensional scaling.

Similar articles

Cited by

References

    1. Cockwell P, Fisher LA. The global burden of chronic kidney disease. Lancet. 2020;395:662–664. doi: 10.1016/S0140-6736(19)32977-0. - DOI - PubMed
    1. Garofalo C, Borrelli S, Provenzano M, De Stefano T, Vita C, Chiodini P, Minutolo R, De Nicola L, Conte G. Dietary salt restriction in chronic kidney disease: A meta-analysis of randomized clinical trials. Nutrients. 2018;10:732. doi: 10.3390/nu10060732. - DOI - PMC - PubMed
    1. Kim SM, Jung JY. Nutritional management in patients with chronic kidney disease. Korean J Intern Med. 2020;35:1279–1290. doi: 10.3904/kjim.2020.408. - DOI - PMC - PubMed
    1. Oppelaar JJ, Vogt L. Body Fluid-Independent effects of dietary salt consumption in chronic kidney disease. Nutrients. 2019;11:2779. doi: 10.3390/nu11112779. - DOI - PMC - PubMed
    1. Yu HC, Burrell LM, Black MJ, Wu LL, Dilley RJ, Cooper ME, Johnston CI. Salt induces myocardial and renal fibrosis in normotensive and hypertensive rats. Circulation. 1998;98:2621–2628. doi: 10.1161/01.CIR.98.23.2621. - DOI - PubMed

Substances