. 2024 Jul;11(28):e2308255.
doi: 10.1002/advs.202308255. Epub 2024 May 17.

A PET-Surrogate Signature for the Interrogation of the Metabolic Status of Breast Cancers

Affiliations

A PET-Surrogate Signature for the Interrogation of the Metabolic Status of Breast Cancers

Stefano Confalonieri et al. Adv Sci (Weinh). 2024 Jul.

Abstract

Metabolic alterations in cancers can be exploited for diagnostic, prognostic, and therapeutic purposes. This is exemplified by 18F-fluorodeoxyglucose (FDG)-positron emission tomography (FDG-PET), an imaging tool that relies on enhanced glucose uptake by tumors for diagnosis and staging. By performing transcriptomic analysis of breast cancer (BC) samples from patients stratified by FDG-PET, a 54-gene signature (PETsign) is identified that recapitulates FDG uptake. PETsign is independently prognostic of clinical outcome in luminal BCs, the most common and heterogeneous BC molecular subtype, which requires improved stratification criteria to guide therapeutic decision-making. The prognostic power of PETsign is stable across independent BC cohorts and disease stages including the earliest BC stage, arguing that PETsign is an ab initio metabolic signature. Transcriptomic and metabolomic analysis of BC cells reveals that PETsign predicts enhanced glycolytic dependence and reduced reliance on fatty acid oxidation. Moreover, coamplification of PETsign genes occurs frequently in BC arguing for their causal role in pathogenesis. CXCL8 and EGFR signaling pathways feature strongly in PETsign, and their activation in BC cells causes a shift toward a glycolytic phenotype. Thus, PETsign serves as a molecular surrogate for FDG-PET that could inform clinical management strategies for BC patients.

Keywords: FDG‐PET; breast cancer; gene signature; glycolysis; metabolism.


Conflict of interest statement

A patent application has been submitted for PETsign.

Figures

Figure 1
Figure 1
Derivation of the 54‐gene PETsign. a) Volcano plot showing the differentially expressed genes between SUV‐H and SUV‐L BCs. Significantly regulated genes (p < 0.05) are shown in red (upregulated) or blue (downregulated). b) Pie charts showing the functions associated with the 135 differentially expressed genes. Categories were attributed as described in Table S3 (Supporting Information). c) Hierarchical clustering of the METABRIC dataset by PETsign (54 genes). Columns, tumor samples; rows, genes (each labeled with its original UP or DOWN status, as from Table S7, Supporting Information). The dendrogram on the top shows the SUV‐H‐like (red) or SUV‐L‐like (blue) classification of the BCs in the dataset. d) The SUV‐H‐like and SUV‐L‐like BCs were subjected to KM analysis for time to DRBC (Death related to BC) in the METABRIC cohort. HR and p‐values (p) were calculated with the Cox proportional hazards model using JMP, in this and all other KM analyses shown. A constellation plot of tumor clustering (alternative representation of the data in c) is shown in the inset.
Figure 2
Figure 2
Validation of the prognostic value of PETsign in independent BC cohorts. a) Constellation plot showing the clustering of the TCGA cohort by PETsign. b) KM analysis of overall survival in the TCGA dataset. c) Hierarchical clustering of the 970‐IEO subcohort with the PETsign. Columns, tumor samples; rows, genes (each labeled with its original UP or DOWN status, as from Table S7, Supporting Information). The dendrogram on the top shows the SUV‐H‐like (red) or SUV‐L‐like (blue) classification of the BCs in the dataset. d) KM analysis in the 970‐IEO subcohort.
Figure 3
Figure 3
Association of the SUV‐H‐like phenotype with BC molecular subtypes and DCIS. a,b) The percentage of SUV‐H‐like tumors within each of the BC molecular subtypes is shown. The total number of tumors is indicated on the top of each bar. Due to the lack of complete clinicopathological information, 96 TCGA cohort cases and 4 IEO cohort cases were excluded from the analysis. The availability of Ki‐67 staining in the IEO cohort allowed the classification of Luminal A and B tumors. In a,b), p‐values were assessed by the chi‐square tests of significance using JMP. c) Twenty‐five DCIS (rows) were clustered using the PETsign genes (columns). The HR (ER/PGR) status of each DCIS, determined by IHC, is shown on the right.
Figure 4
Figure 4
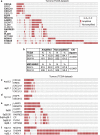
Coamplification of PETsign and 135‐signature genes in BC. a) Amplification of the 54 PETsign genes and the remaining upregulated genes from the original 135‐signature in the TCGA cohort. We identified 18 genes exhibiting amplification in at least 1.5% of cases and co‐occurrence with another amplified gene using a q‐value <0.001. In total, 235 TGCA BC cases (26%) harbored amplification/co‐amplification of the 18 genes (indicated by red bars). PETsign genes are in bold, while the other genes belong to the 135‐signature. b) Percentage of SUV‐H‐like and SUV‐L‐like tumors from the TCGA and METABRIC cohorts harboring amplification of one or more of the 18 genes. P‐values were calculated by the chi‐square test in Excel. N = number of patients in the various categories. c–f) Pattern of coamplification of the indicated groups of genes in the TCGA cohort. The chromosomal localization of each gene is indicated on the left.
Figure 5
Figure 5
PETsign genes predict metabolic features of BC cell lines. a) STRING analysis (performed with default parameters) of PETsign proteins. Nonconnected nodes or poorly connected ones (1 edge) were removed. The thickness of the edges corresponds to the strength of the interaction. The color code indicates the direction of gene regulation in PETsign. b,c) Forty‐eight BC cell lines with available transcriptomic and metabolomic data were analyzed and metabolites with significantly different levels between SUV‐H‐like versus SUV‐L‐like cell lines were identified. b) List of significant differentially present metabolites (see also Table S11, Supporting Information). c) Boxplots of the levels of selected oncometabolites. AcCar/Car, acetylcarnitine to carnitine ratio. All p‐values were obtained by the non‐parametric Wilcoxon test using JMP. d) The metabolites (rows), identified in b, were used for unsupervised hierarchical clustering of the 48 BC cell lines (columns), yielding a grouping largely superimposable with the SUV‐H‐like and SUV‐L‐like phenotypes obtained by transcriptomics (see Figure S3, Supporting Information), indicated by red and blue cell line names, respectively.
Figure 6
Figure 6
Characterization of CXCL8 and EGFR signaling pathways in a panel of BC cell lines. a) Expression of CXCR1 and CXCR2 by RNAseq in the indicated BC cell lines. CXCR1 and CXCR2 expression data are reported as combined (CXCR1 + CXCR2) Trimmed Mean of M‐values (TMM). SUV‐H‐like and SUV‐L‐like BC lines (see Figure S4a, Supporting Information) are shown in red and blue, respectively, in this and all other panels. b) CXCL8 secretion levels in the indicated BC cell lines. Results are the average of duplicate biological samples. c) Regression analysis of CXCL8 transcription (TMM, extracted from the RNAseq dataset) versus secretion (from panel b). d) ECAR (mpH/min/µg of protein), determined by Seahorse analysis. Data are expressed as the mean + SD of 3 independent experiments each with at least 4 technical replicates. Significance was calculated by the ANOVA one‐way test using SigmaPlot 14.0. Two arbitrary thresholds of 1.5 and 3 were used to stratify the cell lines as into low, intermediate and high ECAR groups. e) Immunoblot (IB) of the indicated cell lines with anti‐EGFR (s.e., short exposure; l.e., long exposure) and anti‐phosphoEGFR (EGFR‐pY1086). GAPDH, loading control. MW markers (kDa) are on the left. f) Densitometric quantitation of total EGFR and EGFR‐pY1086 (pEGFR) levels in the IB in (e). The ratio of pEGFR to EGFR is also shown. Data are expressed as arbitrary units (a.u.) after normalization to GAPDH values. g) Summary of data in panels a–f. The SUV‐like status of the cell lines is indicated (red, SUV‐H‐like; blue, SUV‐L‐like). MDA‐MB‐453 and T47D were chosen for subsequent experiments based on characteristics highlighted in green.
Figure 7
Figure 7
EGF and CXCL8 stimulation induces metabolic alterations in MDA‐MB‐453 and T47D. a) 2‐DG uptake in MDA‐MB‐453 (left) and T47D (right) cells treated with EGF (1, 10, or 100 ng mL−1 for 1 h) or CXCL8 (10 or 100 ng mL−1 for 1 h) or mock treated (CTRL). Data are expressed as mean fold‐increase over CTRL + SE (n = 4 independent biological replicas, with at least 4 technical replicates per experiment). Significance was calculated with the two‐tailed unpaired t‐test. b) 2‐DG uptake in MDA‐MB‐453 cells treated with EGF or CXCL8 alone or together (10 ng mL−1/each, 1 h). Data and significance are as in a (n = 3 independent biological replicas, each in sextuplicate). Note that all treatments are significant versus control, but EGFR+CXCL8 is not significant versus single treatments. c,d) Seahorse analysis of c) MDA‐MB‐453 cells and d) T47D cells, mock treated (CTRL) or treated with EGF or CXCL8 (100 ng mL−1 for 15 h). Results are the mean + SD of 3 independent experiments each with at least 4 technical replicates per experiment. The ECAR/OCR ratios are expressed as mpH/pmol and represent the mean + SD of ECAR/OCR values of 3 independent experiments with at least 4 technical replicates per experiment. Significance was calculated versus CTRL with the two‐tailed unpaired t‐test using SigmaPlot 14.0. In all panels: *p < 0.05, ** p < 0.01, *** p < 0.001, ns: not significant, versus CTRL.
Figure 8
Figure 8
PETsign and StemPrintER are independent prognostic predictors. KM analysis in the a) METABRIC and b) 970‐IEO cohorts stratified by StemPrintER (SP). c,d) KM analysis in the c) METABRIC and d) 970‐IEO cohorts stratified by a combination of PETsign and SP genes. PETsign distinguishes SUV‐H‐like and SUV‐L‐like tumors, while SP identifies stem‐like SP‐High (SP‐H) and non‐stem‐like SP‐Low (SP‐L) tumors. See Table S12 (Supporting Information) for numerical details. HR and p‐values (p) were calculated by the Cox proportional hazards model using JMP.

References

    1. Hanahan D., Cancer Discovery 2022, 12, 31. - PubMed
    1. Warburg O., Biochem. Z. 1923, 142, 317.
    1. DeBerardinis R. J., Chandel N. S., Nat. Metab. 2020, 2, 127. - PubMed
    1. Koppenol W. H., Bounds P. L., Dang C. V., Nat. Rev. Cancer 2011, 11, 325. - PubMed
    1. DeBerardinis R. J., Chandel N. S., Sci. Adv. 2016, 2, e1600200. - PMC - PubMed

Substances