. 2024 Jun 13;98(6):e0052424.
doi: 10.1128/jvi.00524-24. Epub 2024 May 17.

Targeting host O-linked glycan biosynthesis affects Ebola virus replication efficiency and reveals differential GalNAc-T acceptor site preferences on the Ebola virus glycoprotein

Affiliations

Targeting host O-linked glycan biosynthesis affects Ebola virus replication efficiency and reveals differential GalNAc-T acceptor site preferences on the Ebola virus glycoprotein

Ieva Bagdonaite et al. J Virol. .

Abstract

Ebola virus glycoprotein (EBOV GP) is one of the most heavily O-glycosylated viral glycoproteins, yet we still lack a fundamental understanding of the structure of its large O-glycosylated mucin-like domain and to what degree the host O-glycosylation capacity influences EBOV replication. Using tandem mass spectrometry, we identified 47 O-glycosites on EBOV GP and found similar glycosylation signatures on virus-like particle- and cell lysate-derived GP. Furthermore, we performed quantitative differential O-glycoproteomics on proteins produced in wild-type HEK293 cells and cell lines ablated for the three key initiators of O-linked glycosylation, GalNAc-T1, -T2, and -T3. The data show that 12 out of the 47 O-glycosylated sites were regulated, predominantly by GalNAc-T1. Using the glycoengineered cell lines for authentic EBOV propagation, we demonstrate the importance of O-linked glycan initiation and elongation for the production of viral particles and the titers of progeny virus. The mapped O-glycan positions and structures allowed to generate molecular dynamics simulations probing the largely unknown spatial arrangements of the mucin-like domain. The data highlight targeting GALNT1 or C1GALT1C1 as a possible way to modulate O-glycan density on EBOV GP for novel vaccine designs and tailored intervention approaches.IMPORTANCEEbola virus glycoprotein acquires its extensive glycan shield in the host cell, where it is decorated with N-linked glycans and mucin-type O-linked glycans. The latter is initiated by a family of polypeptide GalNAc-transferases that have different preferences for optimal peptide substrates resulting in a spectrum of both very selective and redundant substrates for each isoform. In this work, we map the exact locations of O-glycans on Ebola virus glycoprotein and identify subsets of sites preferentially initiated by one of the three key isoforms of GalNAc-Ts, demonstrating that each enzyme contributes to the glycan shield integrity. We further show that altering host O-glycosylation capacity has detrimental effects on Ebola virus replication, with both isoform-specific initiation and elongation playing a role. The combined structural and functional data highlight glycoengineered cell lines as useful tools for investigating molecular mechanisms imposed by specific glycans and for steering the immune responses in future vaccine designs.

Keywords: Ebola virus; GalNAc-T; O-glycosylation; glycosyltransferase; mass spectrometry; mucin-like domain; post-translational modification; tandem mass tag; viral glycoprotein.


Conflict of interest statement

H.H.W. owns stocks in and is a consultant for and co-founder of EbuMab, ApS, Hemab, ApS, and GO-Therapeutics Inc. All other authors declare no conflicts of interest.

Figures

Fig 1
Fig 1
EBOV GP expression in cell lines with targeted disruptions in O-glycan biosynthesis. (A) Layout of Ebola virus glycoprotein. (B) Cartoon depiction of Ebola virus, as well as a ribbon diagram of a monomeric viral envelope glycoprotein (PDB: 6VKM). Color coding as in A. The mucin-like domain is not resolved and shown as a light-blue sphere. (C) Predominant O-glycosylation pathways in HEK293 cells. (D) Expression of GalNAc-T1, -T2, and -T3 in genetically engineered HEK293 cells. Scale bar, 5 µm. (E) Indicated cell lines transfected with a plasmid encoding full-length EBOV Makona GP were fixed with 4% PFA (Fix) 48 hours post-tranfection and co-stained for GP (red) and E-cadherin (green). Another set of cells was also permeabilized with 0.3% Triton X-100 (Fix & Perm). Scale bar, 10 µm.
Fig 2
Fig 2
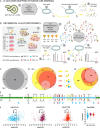
Ebola virus GP O-glycoproteomics. (A) Approach for mapping O-glycosites on Ebola virus-like particles comprised of GP and VP40 proteins. (B) Approach for mapping differentially glycosylated O-glycosites on full-length recombinant GP expressed in GALNT KO cell lines. (C) Overlap between VLP- and GP-identified O-glycosites. (D) The Venn diagrams were generated using DeepVenn (51) and depict the heterogeneity of identified site-specific structures, plotted separately for VLP (left) and GP (right). (E) Identified O-glycosites were mapped onto GP1 layout and colored based on the longest site-specific structure identified (color code as in D). GalNAc-T1, -T2, and -T3-regulated sites are indicated with cyan, maroon, and red arrows, respectively. (F) The dot plots depict distribution of TMT quantification ratios compared with wild type (log₂) for glycopeptide PSMs (peptide spectrum matches) identified in both PNA and VVA LWAC experiments plotted against XCorr (cross-correlation score) values.
Fig 3
Fig 3
Mapping isoform-specific O-glycosites on EBOV GP. (A) Identified O-glycosites and most-complex unambiguously assigned site-specific structures are shown in the context of EBOV GP primary sequence, where VLP-derived sites are shown above the sequence and recombinant GP-derived sites—below the sequence. Glycosites with median quantification ratios of singly glycosylated peptides below 0.5 were considered as isoform regulated and are outlined in cyan, maroon, and red for GalNAc-T1, GalNAc-T2, and GalNAc-T3, respectively. A simplified cartoon above summarizes the data, where orange bars represent all identified O-glycosites. Color-coded arrows indicate isoform-regulated glycosites. Epitopes of protective antibodies derived from convalescent or vaccinated individuals, as well as epitopes for several protective mAbs, are annotated in the sequence (52–55). Amino acids for which combined substitutions to Ala abolish cytopathic effect are also highlighted (15). (B) TMT quantification ratios of single-site peptides, where each dot represents a separate PSM, and horizontal bars indicate median values. (C) Molecular modeling of EBOV GP with the identified O-glycans attached. The MLD was built de novo based on available cryo-EM/ET density maps (56, 57) of virion- and VLP-derived GP and combined with an atomic resolution structure of the GP lacking the MLD (PDB: 6HS4). The MLD is shaded in iceblue and the GCD is shaded in lime. GalNAc-T1, -T2, and -T3 regulated O-glycosites are highlighted in cyan, purple, and red, respectively. The remaining O-glycans are shown in white. Chain A contains VLP-derived glycosites, chain B contains recombinant GP-derived glycosites, and chain C contains combined maximum capacity. (D) Identified O-glycans are colored based on the longest site-specific structure identified, as indicated in the legend. Putative N-glycans were included in the model and are shown in blue.
Fig 4
Fig 4
Conservation of O-glycosylated amino acids. Clustal Omega server was used to align amino acid sequences of reviewed UniProtKB entries of EBOV GP from different Ebolavirus strains. The sequences were ordered based on phylogenetic conservation (indicated by the phylogenetic tree). Protein backbones are depicted as broken gray lines, where spaces represent gaps in the alignment. Experimentally identified unambiguous O-glycosylation sites are marked as red circles. Conserved Ser/Thr amino acids are marked as yellow circles (including ±1 amino acids from a gap in the alignment), whereas partially conserved Ser/Thr (within ±3 amino acids from identified glycosite position) are marked as pink circles. (A) Full alignment. (B) Zoom in on the protein region containing the mucin-like domain.
Fig 5
Fig 5
Influence of O-glycosylation on EBOV entry to cells. (A) Experimental setup for investigating the entry of pseudotyped and authentic EBOV. (B) Entry of pEBOV-VSVΔGLuc to different HEK293 KO cells shown as reporter gene expression 24 hours post-infection. The data are shown as mean + SD of five biological replicates from three independent experiments. Two-way ANOVA followed by Dunnett’s multiple comparison test was used to evaluate differences from wild type (*P < 0.05, **P < 0.01, ***P < 0.001, and **** P < 0.0001). (C) Entry of Vesicular Stomatitis Virus (VSV) G-VSVΔGLuc to different HEK293 KO cells shown as reporter gene expression 24 hours post-infection. The data are shown as mean + SD of six biological replicates from three independent experiments. Two-way ANOVA followed by Dunnett’s multiple comparison test was used to evaluate differences from wild type (*P < 0.05, **P < 0.01, ***P < 0.001, and ****P < 0.0001). (D) HEK293 knockout cell lines infected with the Makona isolate of Zaire EBOV at 0.01 multiplicity of infection (MOI) and fixed in acetone 5.5 hours post-infection were co-stained for EBOV GP (red) and lysosomal marker LAMP1 (green). White boxes indicate zoomed-in regions shown in bottom panels. (E) Up to 43 regions of interest (ROI) containing GP-positive vesicles were selected for multiple images for each cell line and colocalization estimated based on pixel-intensity correlation analysis [Pearson’s correlation coefficient (PCC)]. The violin diagrams depict the distributions of the calculated PCCs for the sampled ROIs. One-way ANOVA followed by Dunnett’s multiple comparison test was used to evaluate the differences of mean PCCs compared with wild type (*P < 0.05, **P < 0.01, ***P < 0.001, and ****P < 0.0001).
Fig 6
Fig 6
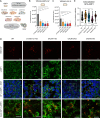
Influence of GalNAc-Ts on EBOV replication. (A) Experimental strategy for addressing the functional role of O-glycosylation in EBOV biology. (B, C) Quantitative reverse transcription PCR (RT-qPCR) analysis of viral RNA D1 and D6 post-infection of glycoengineered HEK293 cells. Expression levels are normalized to β-actin and presented as fold change compared with wild type. Data are shown as mean ± SEM of three independent experiments, where individual datapoints are also shown. One sample t-test was used to evaluate differences from 1 (*P < 0.05, **P < 0.01, ***P < 0.001, and ****P < 0.0001). (B) Intracellular RNA. (C) Extracellular RNA. (D) Plaque titration analysis of Ebola virus in cell culture supernatants of infected glycoengineered cells on D1 and D6 post-infection. Data are shown as mean ± SEM of two independent experiments. One-way ANOVA followed by Šidák’s multiple comparison test was used to evaluate differences in titers compared with wild type on the individual days post-infection (*P < 0.05, **P < 0.01, ***P < 0.001, and ****P < 0.0001). (E, F) HEK293 knockout cell lines infected with the Makona isolate of Zaire EBOV at 0.01 MOI and fixed in acetone 24 hours post-infection were stained for EBOV GP (red) and E-cadherin (green). (E) Confocal snapshots. Scale bar, 10 µm. (F) z-stack maximal intensity projections for EBOV GP. Scale bar, 10 µm. (G) Titers of HEK293 KO cell line-produced pEBOV-VSVΔGLuc harvested 14 hours post-infection and assayed on Vero cells by measuring reporter gene expression 24 hours post-infection. The data are shown as mean + SD of eight biological replicates from four independent experiments. Two-way ANOVA followed by Dunnett’s multiple comparison test was used to evaluate differences from wild type (*P < 0.05, **P < 0.01, ***P < 0.001, and ****P < 0.0001). (H) TEM micrographs of Ebola virions produced in the panel of glycoengineered cell lines 24 hours post-infection. Negative staining with phosphotungstic acid was used for contrasting the specimens. Scale bar is indicated on each image.

Similar articles

References

    1. Jacob ST, Crozier I, Fischer WA, Hewlett A, Kraft CS, Vega M-A de L, Soka MJ, Wahl V, Griffiths A, Bollinger L, Kuhn JH. 2020. Ebola virus disease. Nat Rev Dis Primers 6:13. doi:10.1038/s41572-020-0147-3 - DOI - PMC - PubMed
    1. Bornholdt ZA, Turner HL, Murin CD, Li W, Sok D, Souders CA, Piper AE, Goff A, Shamblin JD, Wollen SE, Sprague TR, Fusco ML, Pommert KBJ, Cavacini LA, Smith HL, Klempner M, Reimann KA, Krauland E, Gerngross TU, Wittrup KD, Saphire EO, Burton DR, Glass PJ, Ward AB, Walker LM. 2016. Isolation of potent neutralizing antibodies from a survivor of the 2014 Ebola virus outbreak. Science 351:1078–1083. doi:10.1126/science.aad5788 - DOI - PMC - PubMed
    1. Gilchuk P, Murin CD, Milligan JC, Cross RW, Mire CE, Ilinykh PA, Huang K, Kuzmina N, Altman PX, Hui S, et al. . 2020. Analysis of a therapeutic antibody cocktail reveals determinants for cooperative and broad Ebolavirus neutralization. Immunity 52:388–403. doi:10.1016/j.immuni.2020.01.001 - DOI - PMC - PubMed
    1. Audet J, Wong G, Wang H, Lu G, Gao GF, Kobinger G, Qiu X. 2014. Molecular characterization of the monoclonal antibodies composing ZMAb: a protective cocktail against Ebola virus. Sci Rep 4:6881. doi:10.1038/srep06881 - DOI - PMC - PubMed
    1. Matz KM, Marzi A, Feldmann H. 2019. Ebola vaccine trials: progress in vaccine safety and immunogenicity. Expert Rev Vaccines 18:1229–1242. doi:10.1080/14760584.2019.1698952 - DOI - PubMed

MeSH terms

Substances

LinkOut - more resources