. 2025 Apr 18;16(4):260-285.
doi: 10.1093/procel/pwae031.

SMAD2/3-SMYD2 and developmental transcription factors cooperate with cell-cycle inhibitors to guide tissue formation

Affiliations

SMAD2/3-SMYD2 and developmental transcription factors cooperate with cell-cycle inhibitors to guide tissue formation

Stefania Militi et al. Protein Cell. .

Erratum in

  • Correction to: the following articles.
    [No authors listed] [No authors listed] Protein Cell. 2025 Aug 25:pwaf065. doi: 10.1093/procel/pwaf065. Online ahead of print. Protein Cell. 2025. PMID: 40853189 No abstract available.

Abstract

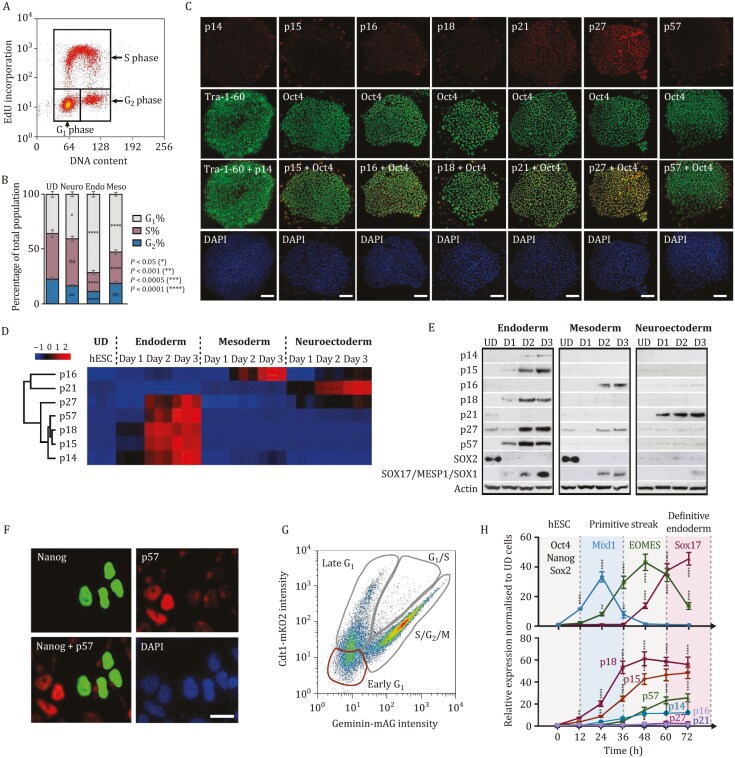
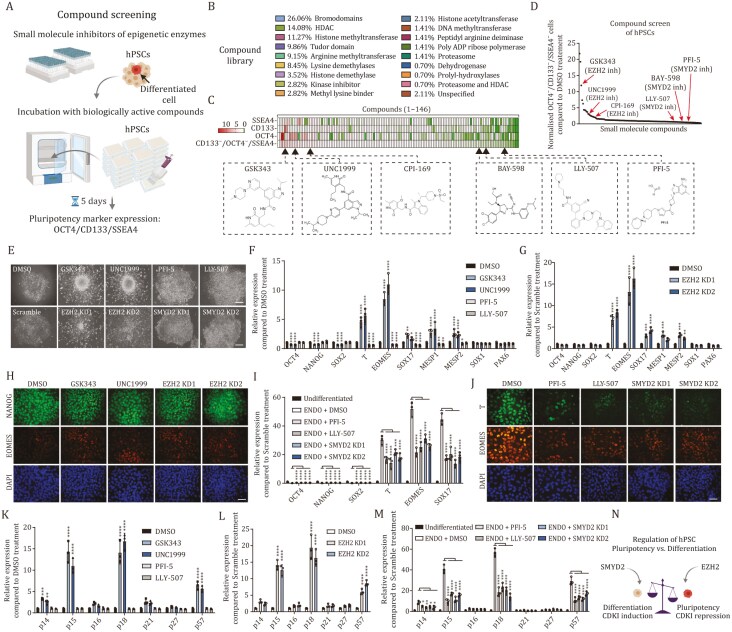
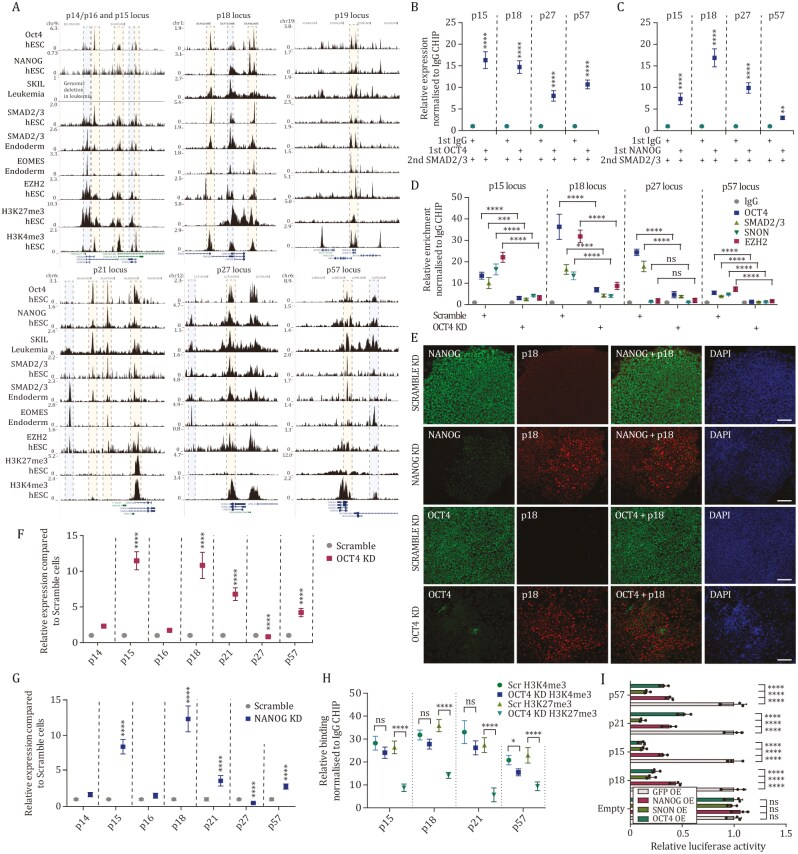
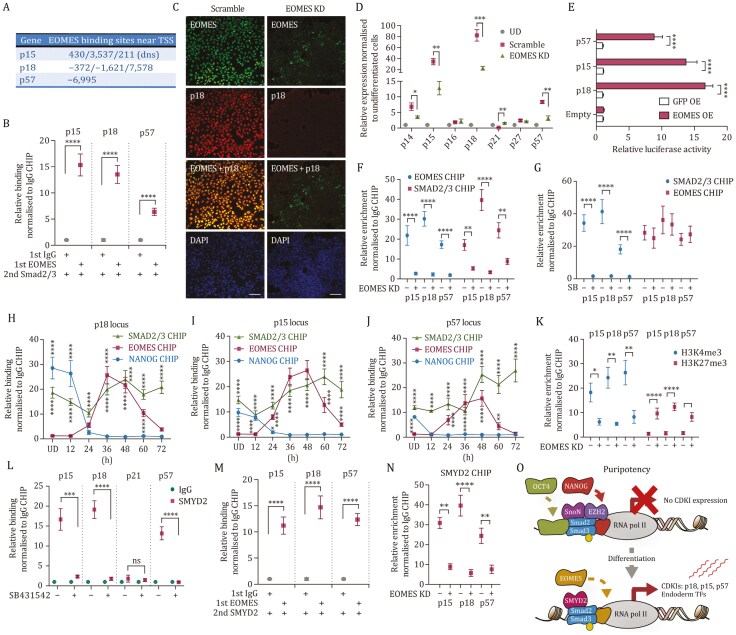
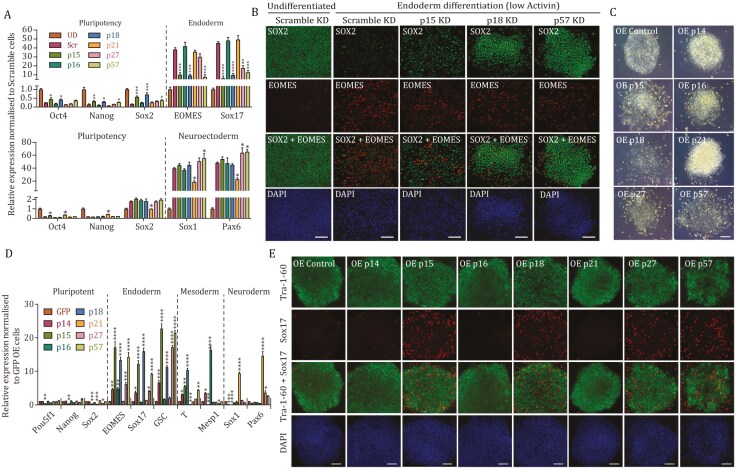
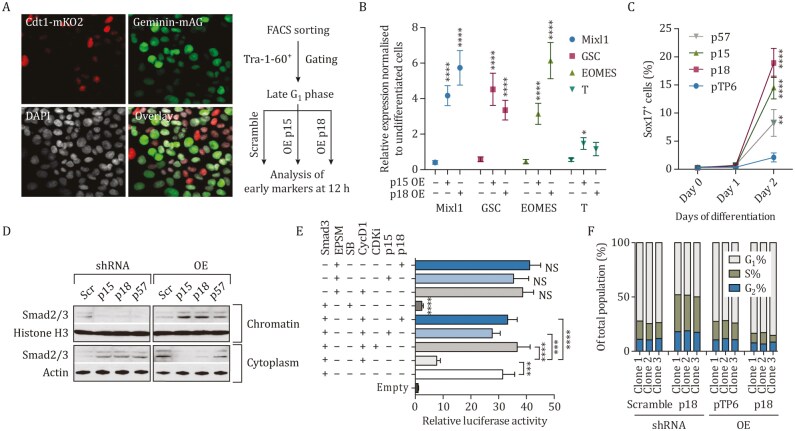
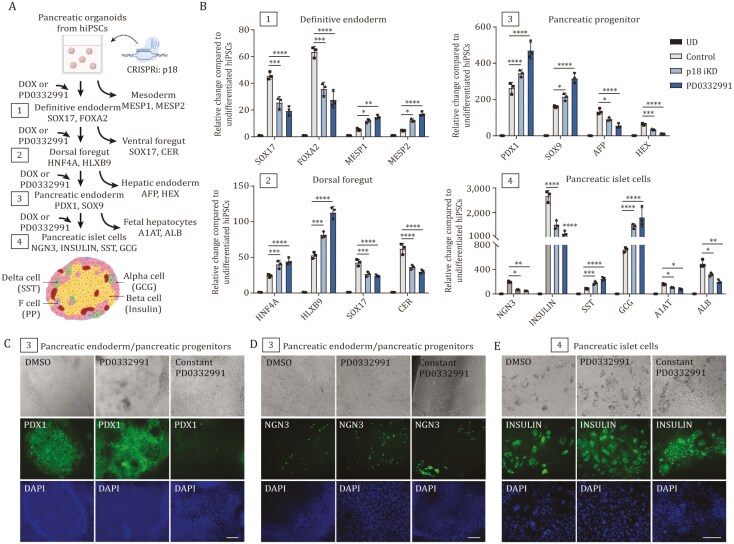
Tissue formation and organ homeostasis are achieved by precise coordination of proliferation and differentiation of stem cells and progenitors. While deregulation of these processes can result in degenerative disease or cancer, their molecular interplays remain unclear. Here we show that the switch of human pluripotent stem cell (hPSC) self-renewal to differentiation is associated with the induction of distinct cyclin-dependent kinase inhibitors (CDKIs). In hPSCs, Activin/Nodal/TGFβ signaling maintains CDKIs in a poised state via SMAD2/3-NANOG-OCT4-EZH2-SNON transcriptional complex. Upon gradual differentiation, CDKIs are induced by successive transcriptional complexes between SMAD2/3-SMYD2 and developmental regulators such as EOMES, thereby lengthening the G1 phase. This, in turn, induces SMAD2/3 transcriptional activity by blocking its linker phosphorylation. Such SMAD2/3-CDKI positive feedback loops drive the exit from pluripotency and stepwise cell-fate specification that could be harnessed for producing cells for therapeutic applications. Our study uncovers fundamental mechanisms of how cell-fate specification is interconnected to cell-cycle dynamics and provides insight into autonomous circuitries governing tissue self-formation.

Keywords: EZH2; SMYD2; TGFβ/ACTIVIN-SMAD2/3; cell cycle; differentiation; epigenetics; human pluripotent stem cells.


Conflict of interest statement

The authors declare that they have no competing interests.

Figures

Figure 1.
Figure 1.
CDKIs are not expressed in self-renewing hPSCs while rapidly induced during germ layer differentiation with simultaneous changes in cell-cycle length. (A) Representative dot blot graph of EdU incorporation and DNA content analysis for determining the cell-cycle profile. (B) Endoderm cells have a strongly lengthened G1 phase compared to other germ layers. Cell-cycle analysis by EdU incorporation during germ layer differentiation by collecting cells 72 h after initiating endoderm, mesoderm, or neuroectoderm differentiation. (C) CDKIs p14, p15, p16, p18, p21, and p57 are not expressed in hPSCs except for p27 protein. Immunostaining of CDKIs together with pluripotency markers Tra-1-60 or OCT4. CDKI expression is not detectable except for p27 protein in undifferentiated hPSCs. Scale bar, 100 μm. (D and E) CDKIs are specifically induced during the germ layer formation. Relative changes in CDKI (D) mRNA by Euclidian hierarchical clustering or (E) protein compared to undifferentiated hPSCs. Z-scores in the heat map indicate the differential expression measured in number of standard deviations from the average level across all conditions. In Western blot we used the following germ layer markers: SOX17 for endoderm, MESP1 for mesoderm, and SOX1 for neuroectoderm. (F) CDKIs accumulate in the nucleus upon their induction in differentiating cells. Immunostaining of p57 and NANOG in a mix of pluripotent and differentiating cells at 36 h of endoderm differentiation. Scale bar, 10 μm. (G) Dot blot graph of unsynchronised FUCCI-hPSCs visualized by flow cytometry. The different cell-cycle phases are marked with gray lines, and early G1 phase cells sorted are marked with red lines. (H) CDKI induction is an early event during the initiation of differentiation. Dynamical changes of endoderm gene expression and CDKIs marks on synchronized cells differentiated toward definitive endoderm and analysed by Q-PCR. Statistical analysis was performed by 2-way ANOVA with multiple comparisons with Tukey correction and **** marks adjusted P-value < 0.0001, *** is adjusted P-value < 0.001, ** is adjusted P-value < 0.01, * is adjusted P-value < 0.05.
Figure 2.
Figure 2.
Compound screening identifies SMYD2 and EZH2 as regulators of hPSC self-renewal and differentiation. (A) Schematic representation of the small molecule screening process on hPSCs. (B) Compounds in the epigenetic library. (C and D) EZH2 inhibitors GSK343, UNC1999, and CPI-169 increase the fraction of pluripotent marker negative cells whereas SMYD2 inhibitors PFI-5, LLY-507, and BAY-598 decrease pluripotent marker negative cells compared to DMSO control treatment. (E) Representative colonies of hPSCs treated with EZH2 inhibitors, SMYD2 inhibitors, or EZH2 and SMYD2 KD. (F) Treatment of hPSCs with EZH2 inhibitors increases endoderm and mesoderm marker expression. (G) EZH2 KD in hPSCs increases endoderm marker expression. (H) Immunostaining of EOMES and NANOG in EZH2 inhibitor treated hPSCs or EZH2 KD cells. (I) SMYD2 inhibition and knockdown reduce endoderm marker expression upon endoderm differentiation at 36 h timepoint. (J) Immunostaining of EOMES and T in hPSCs differentiated to endoderm for 36 h and treated with SMYD2 inhibitors or SMYD2 KD. (K) Several CDKIs are upregulated upon EZH2 inhibition in hPSCs. (L) EZH2 KD upregulates p15, p18, and p57 expression in hPSCs. (M) SMYD2 chemical inhibition and genetic knockdown downregulates several CDKIs during endoderm differentiation at 36 h. (N) Schematic depiction of the effects of SMYD2 and EZH2 on pluripotency and differentiation in hPSCs. Statistical analysis was performed by two-way ANOVA with multiple comparisons with Tukey correction and **** marks adjusted P-value < 0.0001, *** is adjusted P-value < 0.001, ** is adjusted P-value < 0.01, * is adjusted P-value < 0.05.
Figure 3.
Figure 3.
ACTIVIN/NODAL signaling establishes a stem cell-specific expression pattern of CDKIs with poised chromatin through cooperation between NANOG/OCT4, SMAD2/3, EZH2, and SNON. (A) SMAD2/3, OCT4, NANOG, SOX2 and EZH2 bind to CDKI loci in human pluripotent cells. Histone H3K4me3 and H3K27me3 mark CDKI loci in pluripotent cells. SNON data represents leukemia cells. (B and C) OCT4 and NANOG form a complex with SMAD2/3 on CDKI loci in hPSCs. Sequential ChIP of (B) OCT4 and SMAD2/3 or (C) NANOG and SMAD2/3 in hPSC was performed and analyzed by Q-PCR. Significant differences compared to IgG/SMAD2/3 sequential ChIP sample calculated by t-test are marked. (D) OCT4 knockdown results in reduced SMAD2/3, EZH2, and SNON binding on CDKI loci. ChIP of OCT4, SMAD2/3, and SNON was performed in Scramble and OCT4 KD cells to test their presence on the regions uncovered by genome-wide SMAD2/3 and OCT4 ChIP-seq experiments. Significant differences calculated by t-test are marked. ns, not significant. (E) Immunostaining of p18 protein expression. Scale bar, 100 μm. (F) OCT4 knockdown causes an increase in CDKIs except for p27 in hPSCs. Scramble and OCT4 KD cells were analyzed by Q-PCR to determine the expression of CDKIs. (G) OCT4 knockdown causes an increase in CDKIs except for p27 in hPSCs. Scramble and OCT4 KD cells were analyzed by Q-PCR to determine the expression of CDKIs. Significant differences calculated by t-test are marked. ns, not significant. (H) OCT4 knockdown causes a decrease in repressive bivalent mark H3K27me3 on p15, p18, p21, and p57 loci. Scramble and NANOG KD cells were analyzed by ChIP-QPCR of H3K4me3 and H3K27me3 marks on CDKI loci. Significant differences calculated by two-way ANOVA are marked. (I) OCT4 and NANOG represses p15, p18, and p57 promoters. hPSCs were cotransfected with CDKI promoter-luciferase constructs and NANOG and/or SNON overexpression constructs. Luciferase signals were analysed 48 h after transfection. Experiments represent three replicates. Statistical analysis was performed by two-way ANOVA with multiple comparisons with Tukey correction and **** marks adjusted P-value < 0.0001, *** is adjusted P-value < 0.001, ** is adjusted P-value < 0.01, * is adjusted P-value < 0.05.
Figure 4.
Figure 4.
CDKIs are induced during endoderm differentiation by SMYD2-SMAD2/3-EOMES transcriptional complex. (A) The location of EOMES binding sites in the proximity of CDKI loci relative to their transcription start site. Putative EOMES binding sites were uncovered by genome-wide analysis of EOMES binding in Day 2 endoderm cells. (B) EOMES and SMAD2/3 form a complex on CDKI loci in endoderm cells. Sequential ChIP of EOMES and SMAD2/3 in Day 2 endoderm was followed by Q-PCR analysis. Significant differences compared to IgG/SMAD2/3 sequential ChIP sample and calculated by t-test are marked. (C) EOMES knockdown in endoderm causes the loss of p18 expression. Immunostaining of p18 and EOMES in Scramble and EOMES KD cells differentiated to endoderm for 2 days. Scale bar, 20 μm. (D) EOMES knockdown causes the loss of CDKI expression in endoderm cells. EOMES KD and Scramble cells were differentiated to endoderm and analyzed by Q-PCR for determining CDKI expression. Significant differences compared to the Scramble shRNA sample and calculated by t-test are marked. (E) EOMES induces CDKI expression via binding to regulatory regions on CDKI loci. CDKI promoter-luciferase construct harboring putative EOMES binding regions were co-transfected with EOMES-expressing vector or GFP into Day 2 endoderm cells and analyzed 24 h after transfection. Significant differences compared to the OE GFP sample and calculated by t-test are marked. (F) SMAD2/3 binding to p15, p18, and p57 loci in endoderm depends on EOMES. SMAD2/3 and EOMES CHIP were performed in Scramble and EOMES KD cells in Day 2 endoderm cells and analyzed by Q-PCR. Significant differences compared to the Scramble shRNA sample and calculated by t-test are marked. (G) Blocking SMAD2/3 binding to CDKI loci by inhibiting ACTIVIN/NODAL signaling with SB431542 (SB) does not abolish EOMES binding. Day 2 endoderm cells were treated with SB431542 for 2 h and analyzed by SMAD2/3 ChIP or EOMES ChIP. Significant differences compared to not SB431542 treated endoderm cells and calculated by t-test are marked. (H–J) Timeline of SMAD2/3, NANOG, and EOMES binding to p18, p15, and p57 loci during endoderm differentiation. (K) EOMES knockdown in endoderm cells results in the loss of activating histone mark H3K4me3 on CDKI loci and elevation of the repressing histone modification H3K27me3. Scramble and EOMES KD cells were differentiated to Day 2 endoderm and analyzed by H3K4me3 ChIP and H3K27me3 ChIP followed by Q-PCR. Significant differences compared to the Scramble shRNA sample and calculated by t-test are marked. (L) SMYD2 binding to p15, p18, and p57 loci is reduced by ACTIVIN/NODAL signaling inhibitor SB431542. (M) EOMES and SMYD2 form a complex on CDKI loci in endoderm cells. Sequential ChIP of EOMES and SMYD2 in Day 2 endoderm was followed by Q-PCR analysis. Significant differences compared to IgG/SMYD2 sequential ChIP sample and calculated by t-test are marked. (N) SMYD2 binding to CDKI loci is reduced upon EOMES KD in endoderm. Significant differences compared to Scramble shRNA sample and calculated by t-test are marked. (O) Graphical model depicting the absence of CKI expression in pluripotent cells and induction in endoderm cells by SMAD2/3 and EOMES. During endoderm differentiation, EOMES-SMAD2/3 complex binds to p18, p15, and p57 loci and induces their expression along with the endoderm genes. All data are shown as mean ± s.d. (n = 3).
Figure 5.
Figure 5.
CDKI expression affects the differentiation efficiency toward distinct cell fates. (A) p15, p18, and p57 knockdown reduces the efficiency of endoderm differentiation while p21 knockdown reduces the efficiency of neuroectoderm differentiation. Q-PCR analysis of pluripotency genes and germ layer-specific markers in CDKI KD cells differentiated toward endoderm and neuroectoderm. Significant differences compared to differentiated Scramble shRNA samples calculated by t-test are marked. (B) p15, p18, and p57 knockdown cells have decreased endoderm specification capacity. Immunostaining of pluripotency and differentiation markers in Scramble and CDKI KD cells. Scale bar, 100 μm. (C) Overexpression of CDKI protein causes a loss of pluripotency and elevated differentiation morphology of hESCs as shown in representative colonies of OE CDKIs. (D and E) Overexpression of p15, p18, and p57 induces endoderm differentiation. Differentiation markers were analyzed by (D) mRNA expression of pluripotency and differentiation markers in OE GFP and OE CDKI cells or (E) immunostaining. Scale bar, 100 μm. Significant differences compared to OE GFP calculated by t-test are marked.
Figure 6.
Figure 6.
Positive feedback loops between SMAD2/3-CDKI and developmental transcription factors. (A) Analysis of cell-cycle dependent differentiation potential in FUCCI-hPSCs. Cells were transfected with CDKI expression constructs and synchronized by cell sorting to early G1 phase 48 h after transfection. Thereafter, cells were differentiated into endoderm and analyzed for endoderm markers. Scale bar, 20 μm. (B) CDKI expression in late G1 allows for the induction of endoderm differentiation. Q-PCR analysis of early endoderm marker induction in control cells, p18 OE and p15 OE cells. Significant differences compared to OE vector calculated by t-test are marked. (C) CDKI expression in late G1 phase induces endoderm differentiation. Cells were treated as in (A) and analyzed for SOX17 expression by flow cytometry at 24 h and 48 h time points. Significant differences compared to OE pTP6 vector calculated by two-way ANOVA are marked. (D) Relative abundance of SMAD2/3 in the cytoplasm and on chromatin upon CDKI knockdown or overexpression. Histone H3 and ACTIN are used as loading controls. (E) CDKIs induce SMAD2/3 transcriptional activity via inhibiting Cyclin D-CDK4/6 mediated phosphorylation of SMAD2/3 in its linker region. Cells were co-transfected with CDKI expressing plasmids and a luciferase construct under the regulation of a consensus SMAD binding element. Significant differences calculated by t-test are marked. (F) p18 expression regulates G1 phase length during endoderm differentiation. Cell-cycle profile of p18 KD and p18 OE cells was compared to control cells by EdU incorporation.
Figure 7.
Figure 7.
Manipulating EZH2, SMYD2, and SMAD2/3-CDKI activity can be harnessed for guiding tissue self-formation for biomedical applications. (A) Schematics of hIPSC organoid differentiation toward pancreatic tissue. Each DOX or PD0332991 treatment during the 1–4 specification stages lasted for 72 h. Markers for each cell identity are shown. (B) QPCR analyses of markers during the pancreatic differentiation and the alternative cell-fate markers were analyzed at 1–4 specification stages. The treatments for DOX-mediated p18 knockdown and CDK4/6 inhibition with PD0332991 are shown in (B). (C–E) Dynamic PD0332991 treatment improves pancreatic differentiation while constant PD0332991 treatment impairs differentiation as evidenced by reduced expression and altered spatial distribution of key pancreatic markers PDX1, NGN3, and INSULIN. Experiments represent three replicates. Statistical analysis was performed by two-way ANOVA with multiple comparisons with Tukey correction and **** marks adjusted P-value < 0.0001, *** is adjusted P-value < 0.001, ** is adjusted P-value < 0.01, * is adjusted P-value < 0.05.

Similar articles

References

    1. Abu-Farha M, Lambert JP, Al-Madhoun AS et al. The tale of two domains: proteomics and genomics analysis of SMYD2, a new histone methyltransferase. Mol Cell Proteomics 2008;7:560–572. - PubMed
    1. Awad MM, Sanders JA, Gruppuso PA. A potential role for p15(Ink4b) and p57(Kip2) in liver development. FEBS Lett 2000;483:160–164. - PubMed
    1. Bertero A, Madrigal P, Galli A et al. Activin/nodal signaling and NANOG orchestrate human embryonic stem cell fate decisions by controlling the H3K4me3 chromatin mark. Genes & Development 2015;29:702–717. - PMC - PubMed
    1. Besson A, Hwang HC, Cicero S et al. Discovery of an oncogenic activity in p27Kip1 that causes stem cell expansion and a multiple tumor phenotype. Genes Dev 2007;21:1731–1746. - PMC - PubMed
    1. Blanco E, Gonzalez-Ramirez M, Alcaine-Colet A et al. The bivalent genome: characterization, structure, and regulation. Trends Genet 2020;36:118–131. - PubMed

MeSH terms