. 2024 Jul;162(1-2):109-131.
doi: 10.1007/s00418-024-02285-x. Epub 2024 May 17.

DNA choreography: correlating mobility and organization of DNA across different resolutions from loops to chromosomes

Affiliations

DNA choreography: correlating mobility and organization of DNA across different resolutions from loops to chromosomes

Maruthi K Pabba et al. Histochem Cell Biol. 2024 Jul.

Abstract

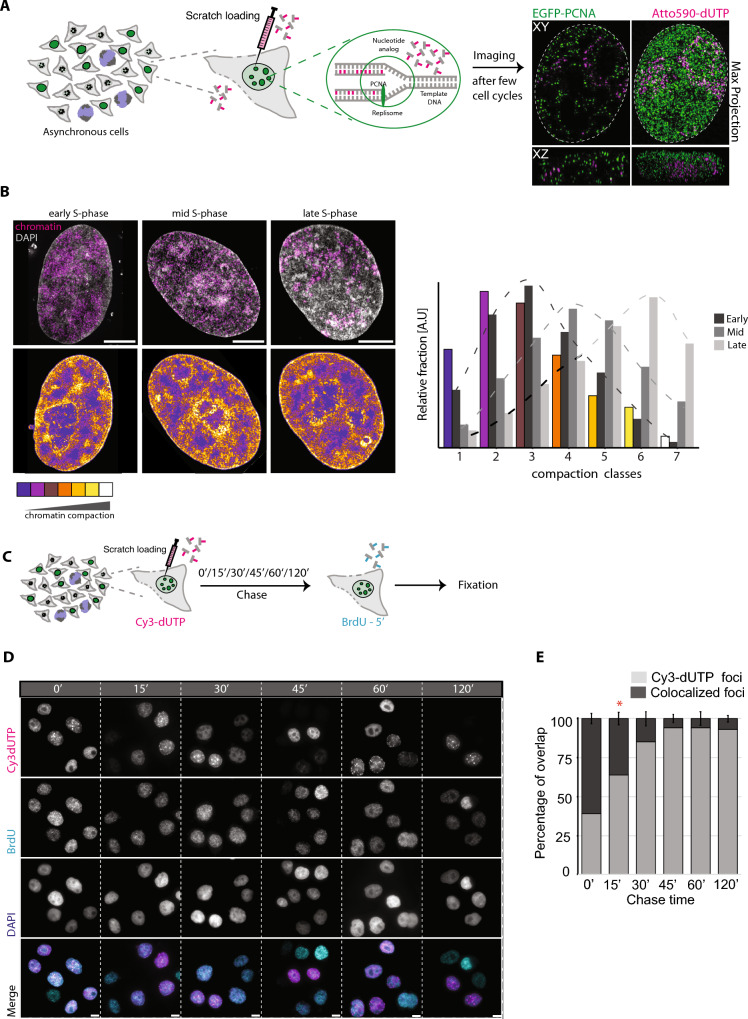
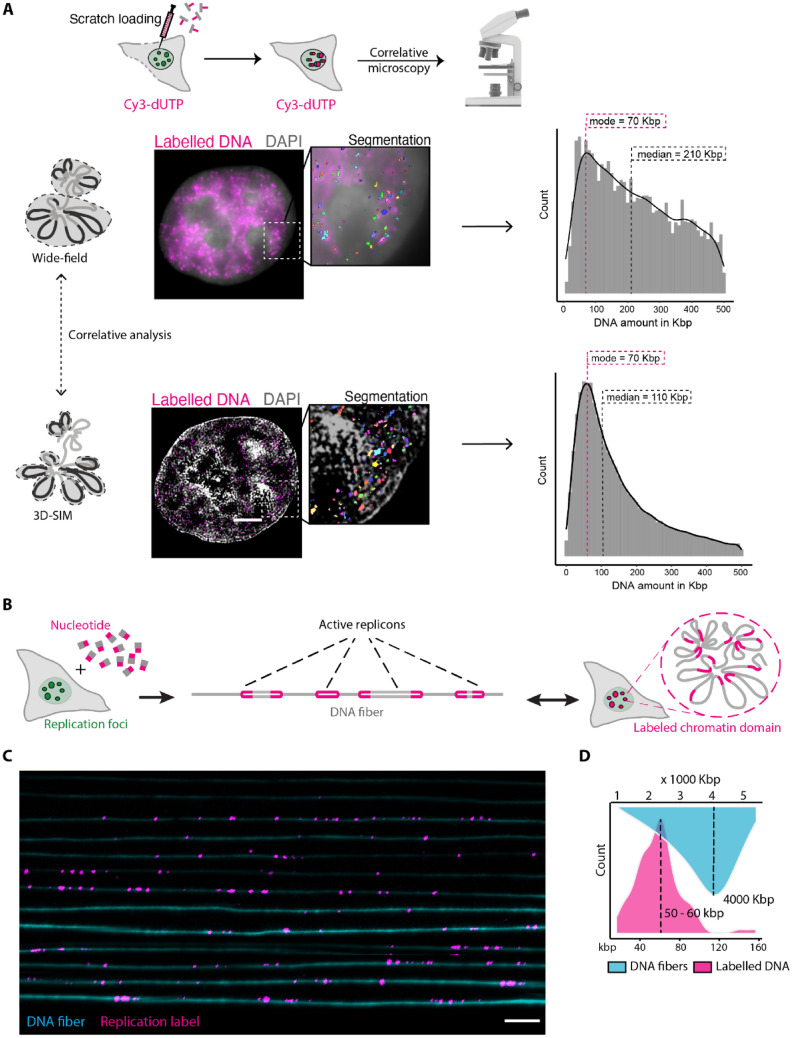
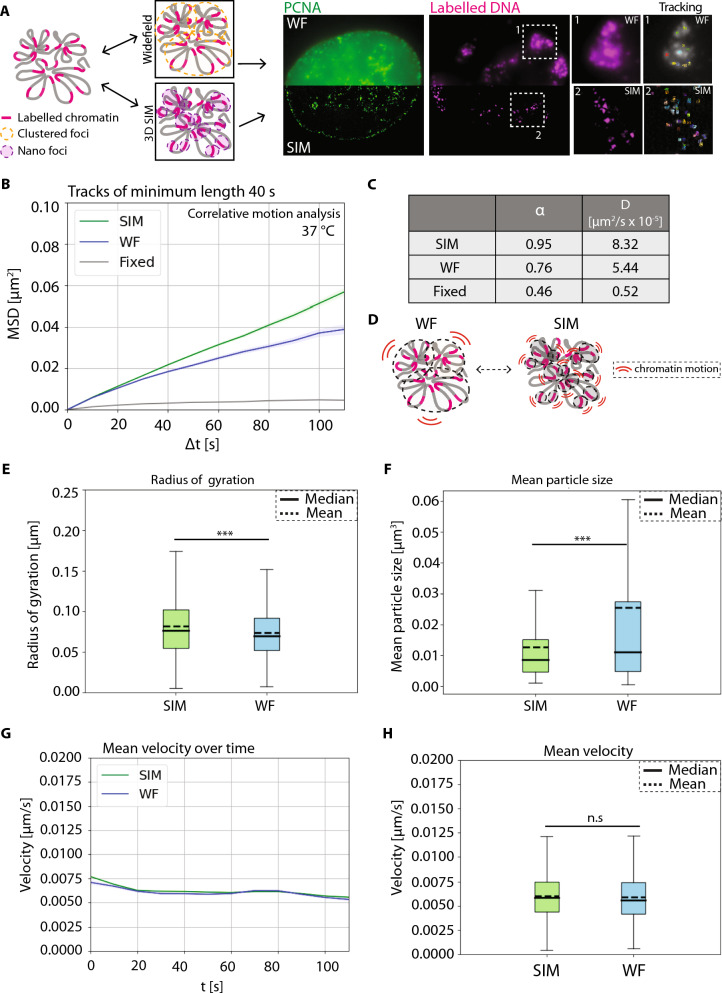
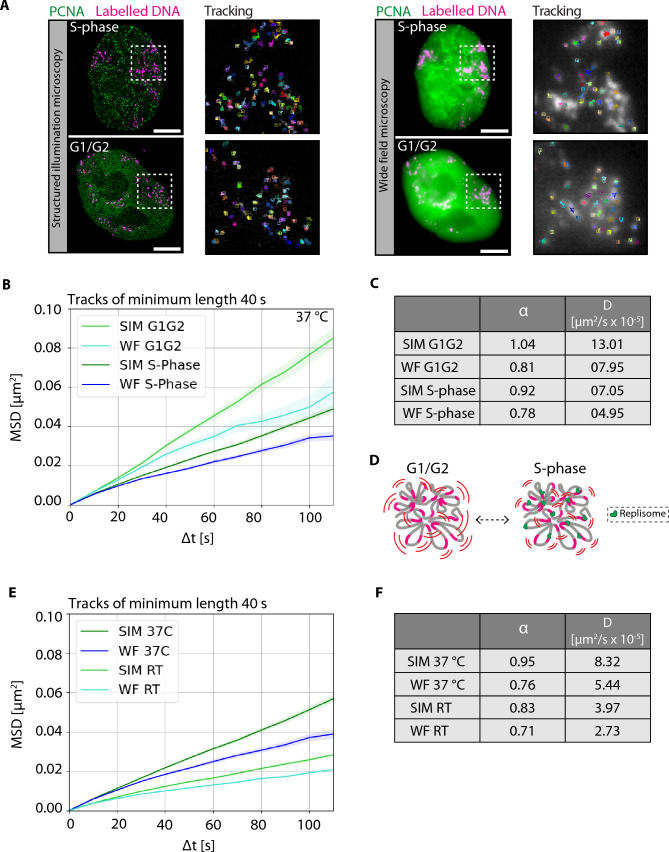
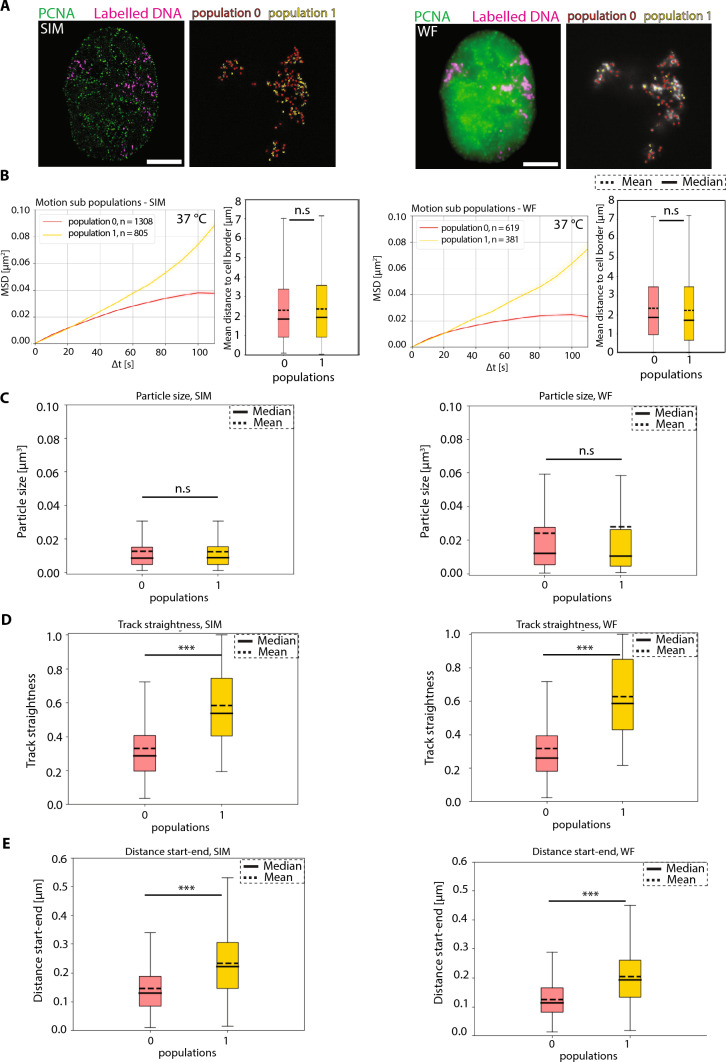
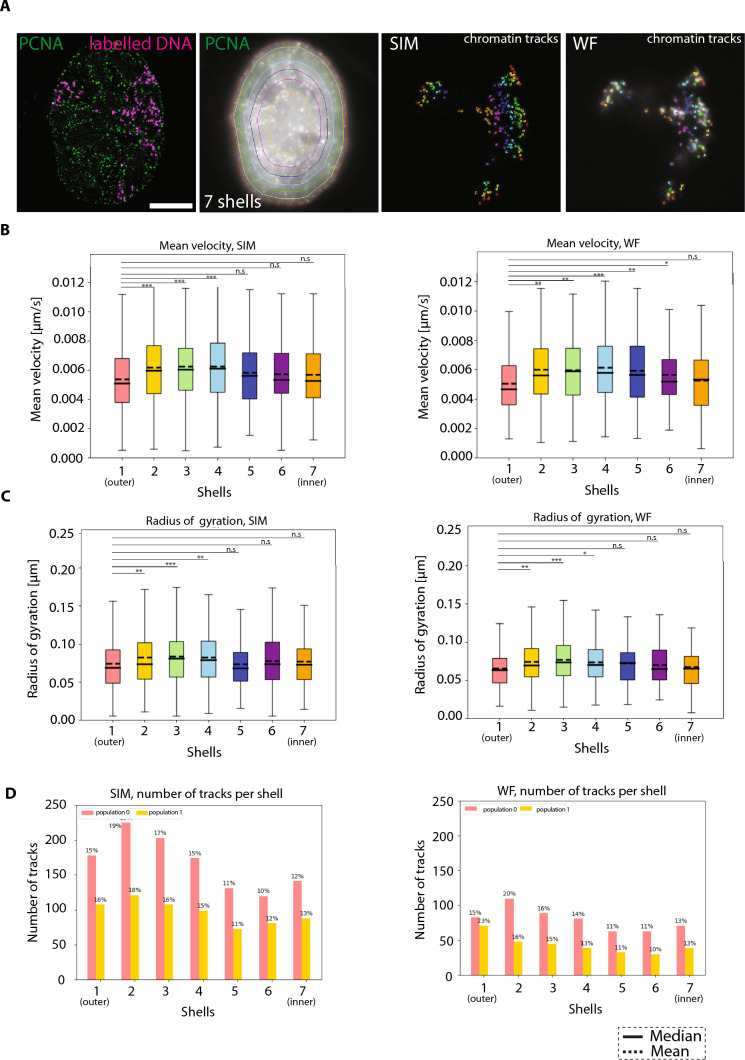
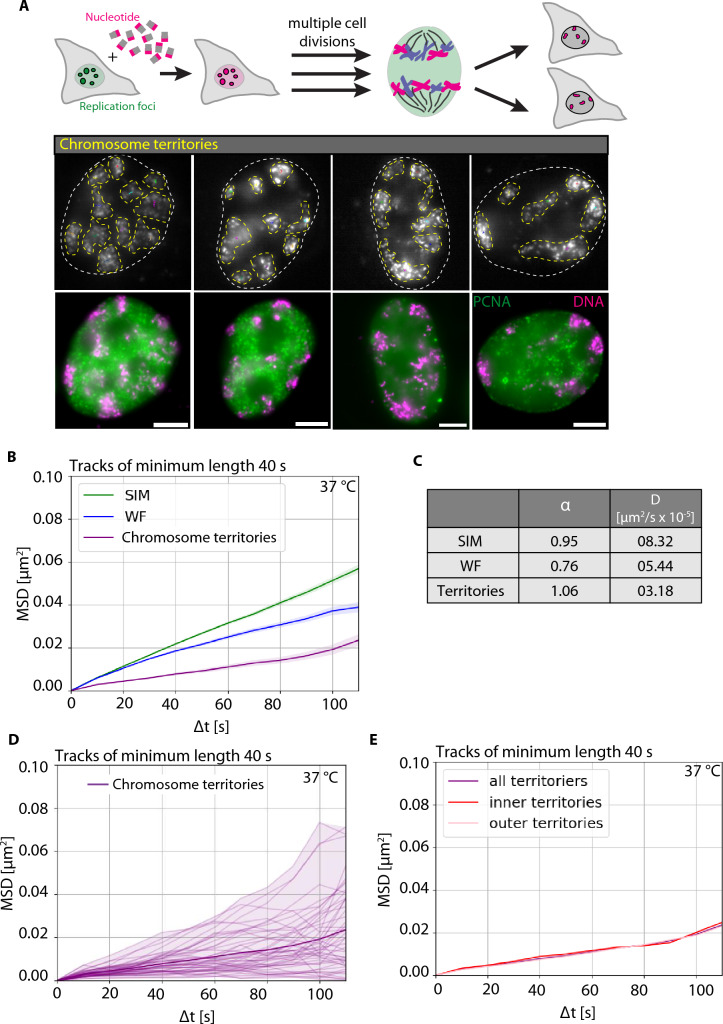
The dynamics of DNA in the cell nucleus plays a role in cellular processes and fates but the interplay of DNA mobility with the hierarchical levels of DNA organization is still underexplored. Here, we made use of DNA replication to directly label genomic DNA in an unbiased genome-wide manner. This was followed by live-cell time-lapse microscopy of the labeled DNA combining imaging at different resolutions levels simultaneously and allowing one to trace DNA motion across organization levels within the same cells. Quantification of the labeled DNA segments at different microscopic resolution levels revealed sizes comparable to the ones reported for DNA loops using 3D super-resolution microscopy, topologically associated domains (TAD) using 3D widefield microscopy, and also entire chromosomes. By employing advanced chromatin tracking and image registration, we discovered that DNA exhibited higher mobility at the individual loop level compared to the TAD level and even less at the chromosome level. Additionally, our findings indicate that chromatin movement, regardless of the resolution, slowed down during the S phase of the cell cycle compared to the G1/G2 phases. Furthermore, we found that a fraction of DNA loops and TADs exhibited directed movement with the majority depicting constrained movement. Our data also indicated spatial mobility differences with DNA loops and TADs at the nuclear periphery and the nuclear interior exhibiting lower velocity and radius of gyration than the intermediate locations. On the basis of these insights, we propose that there is a link between DNA mobility and its organizational structure including spatial distribution, which impacts cellular processes.

Keywords: Image registration; Live cell DNA labeling; Motion analysis; Single particle tracking; Super-resolution microscopy; Widefield microscopy.


Conflict of interest statement

The authors declare no competing interests.

Figures

Fig. 1
Fig. 1
Genome-wide DNA labeling and estimation of nucleotide pulse duration. A Illustration of the labeling scheme. Fluorescently labeled nucleotides are introduced in an asynchronous population of HeLa K GFP-PCNA cells (Supplementary Table 1) using scratch loading before imaging in subsequent cell cycle stages (Replication labeling and live cell imaging, Supplementary Table 4). On the right, a single Z slice and maximum Z projection of a representative cell with GFP-PCNA (green) and ATTO-590 dUTP (magenta) is shown at SIM resolution (Supplementary Table 2). B Representative images of HeLa K cells labeled with nucleotides (magenta) and DAPI (gray). The replication labeling pattern was used to determine the S phase stage where the chromatin was labeled in the previous cell cycle. We then performed chromatin compaction class analysis using DAPI intensity (Methods) of 3D-SIM imaged fixed cells and mapped the distribution of chromatin label within the compaction class and plotted it as a bar plot. C The labeling scheme to determine the DNA labeling duration using scratch loading, we first labeled cells with Cy3-dUTP (magenta) using scratch loading followed by different chase times (0′/15′/30′/45′/60′/120′), which was then followed by a second nucleoside pulse (BrdU—40 µM) for 5 min to label cells. The cells were then fixed after a few hours and BrdU detection was performed (Methods, Supplementary Table 3). D The cells were then imaged using a high-throughput widefield microscope (Supplementary Table 4) and representative images of all samples are shown (Cy3-dUTP—magenta, BrdU—cyan, DAPI—blue). E We performed colocalization analysis of both labels to determine the overlap percentage over time (Supplementary Fig. 2), which was then plotted as bar plots with error bars. Scale 5 µm
Fig. 2
Fig. 2
Quantification and correlation of labeled replication domains using microscopy and single molecule DNA fibers. A HeLa K GFP-PCNA cells were labeled with Cy3-dUTP (magenta) (Supplementary Table 2) using scratch loading technique and were then fixed using 3.7% paraformaldehyde for 15 min and DNA was stained using DAPI. The cells were then imaged using the DeltaVision OMX microscope for both GFP-PCNA and Cy3-dUTP (Supplementary Tables 1, 2, 3, 4) and processed to display corresponding widefield and 3D-SIM images. GFP-PCNA patterns were used to determine the cell cycle stage and the cell cycle correction factor (Supplementary Figs. 3, 4). Representative images of DNA (DAPI—gray) and labeled chromatin (Cy3-dUTP—magenta) in WF and 3D-SIM resolution  are shown. Individual cells were segmented, analyzed, and corrected for genome size and the histograms representing the quantified DNA amount per focus (N = 30) was plotted. The mode ± 5 bin of the histogram was represented in the figure (DNA quantification of labeled chromatin, Supplementary Figs. 3, 4, 5). The statistics of the histogram are shown in Supplementary Table 6. Scale bar 5 µm. B Single molecule DNA fiber experiment of DIG-dUTP labeled cells was performed to estimate the labeling efficiency of cells and correlate the DNA domain quantification using microscopy (DNA combing, Supplementary Figs. 6, 7, Supplementary Tables 3, 4). C Representative image of a single linearly stretched DNA fiber (cyan) and the labeled replication foci (DIG-dUTP: magenta). D The DNA fiber length and the labeled replication foci in kbp were plotted using the calibration measurements performed using lambda DNA (Supplementary Fig. 7). Scale bar 100 kbp
Fig. 3
Fig. 3
Correlative chromatin mobility of labeled DNA in HeLa K cells at widefield and structured illumination microscopy resolution. A HeLa K cells expressing GFP-PCNA were labeled with ATTO-590-dUTP (Methods, Supplementary Tables 1, 2) using scratch loading. After a few cell cycles, live cells were imaged in 3D and processed for structured illumination microscopy (SIM) and widefield (WF) resolutions, and time-lapse movies (frame interval of 10 s) of both GFP-PCNA (green) and labeled chromatin (magenta) were obtained (Supplementary Table 4). Representative images of HeLa K cells with PCNA (green) and labeled chromatin (magenta) in SIM and WF are shown. Inserts (white—1, 2) represent the zoom of chromatin imaged with SIM and WF resolutions, respectively. The zoomed inserts also show the computed tracks of chromatin over time (Supplementary Fig. 8, Videos 1, 2, 3, 4). B Non-rigid registration of the time-lapse movies using PCNA-GFP was performed to correct for the movement of cells (Methods, Supplementary Fig. 9). The registered movies were then used to detect labeled chromatin foci (Methods, Supplementary Fig. 10). These chromatin foci from the time-lapse movies of both SIM and WF were then analyzed to obtain the mean squared displacement curves (MSD, µm2) over time intervals (s) (Supplementary Fig. 8). MSD curves (µm2) over time intervals (s) for SIM (green), WF (blue), and control fixed cells (gray) were then plotted. C The table details the values of the anomalous diffusion coefficient α and the diffusion coefficient D (µm2/s × 10−5). D Illustration of labeled chromatin and its chromatin motion in SIM and WF. E, F Radius of gyration (µm) and mean particle size (µm3) for SIM (green) and WF (blue) chromatin domains (Supplementary Fig. 11). There is a highly significant difference between the SIM and WF foci (p < 0.001). The median and mean of the measurements are indicated in the figure. G Mean velocity (µm/s) of labeled chromatin foci for SIM (green) and WF (blue) plotted as a curve over time (s). H Mean velocity (µm/s) of labeled chromatin foci for SIM (green) and WF (blue) plotted as a box plot. There is a highly significant difference between the SIM and WF foci (p < 0.001). The median and mean values of the measurements are indicated in the figure. The statistics of the plots are shown in the figure and listed in Supplementary Table 6. Scale bar 5 µm. Also see Videos 1, 2, 3, 4
Fig. 4
Fig. 4
Correlative motion analysis of labeled chromatin during the cell cycle stages and depending on temperature. A HeLa K cells with labeled DNA were used to obtain live-cell time-lapse movies (frame interval of 10 s) (Methods, Supplementary Tables 1, 2). Correlative imaging of two channels GFP-PCNA and labeled chromatin in SIM and WF in 3D were obtained (Supplementary Table 4). During S phase, PCNA accumulates within the nucleus at sites of active DNA replication and exhibits a distinct puncta pattern. During G1 and G2, GFP-PCNA is diffusely distributed throughout the nucleus. GFP-PCNA patterns were used to classify cells in different cell cycle stages (Supplementary Fig. 3). The representative images show GFP-PCNA (green) and labeled DNA (magenta) for both SIM and WF resolutions. The tracks of chromatin mobility of the white inserts are shown in zoom. B The registered time-lapse movies were used to detect chromatin foci of both SIM and WF and then analyzed to obtain the mean squared displacement curves (MSD, µm2) over time intervals (s) (Supplementary Figs. 8, 13). The MSD curves over time intervals (s) were plotted for S phase and G1/G2 for both SIM and WF. C The table details the values of the anomalous diffusion coefficient α and the diffusion coefficient D (µm2/s × 10−5). D Illustration of labeled chromatin and in S phase and G1/G2. E During live cell imaging of chromatin labeled HeLa K GFP-PCNA cells, experiments at two different temperatures (37 ºC and room temperature (RT)) were performed. The MSD curves over time intervals (s) were plotted for imaging at 37 °C and RT for both SIM and WF (Supplementary Fig. 12). F The table details the values of the anomalous diffusion coefficient α and the diffusion coefficient D (µm2/s × 10−5). The statistics of the plots are shown in figure and listed in (Supplementary Table 6). Scale bar 5 µm. See Video 5
Fig. 5
Fig. 5
Subpopulation classification of chromatin motion. A Representative images of HeLa K GFP-PCNA (green) and labeled chromatin (magenta) live cells in SIM and WF. The computed chromatin tracks were classified into population 0 (red) and population 1 (yellow) based on k-means clustering of the α values. The tracks were colored in red (population 0) and yellow (population 1) in both SIM and WF images. The subpopulation mean values of α for SIM are 0.56 and 1.66 for population 0 (red) and population 1 (yellow), respectively. The subpopulation mean values of α for WF are 0.48 and 1.63 for population 0 (red) and population 1 (yellow), respectively. We analyzed different parameters for different subpopulations and plotted them (Supplementary Fig. 13). B Mean squared displacement (MSD, µm2) over time intervals (s) for population 0 (red) and population 1 (yellow) was plotted for SIM and WF time-lapse movies. We also plotted the mean distance (µm) to the cell border for the chromatin tracks of the subpopulations. There is no significant difference in mean distance (µm) to the cell border between the subpopulations. The mean and median of the box plots are also indicated. The statistics of the plots are shown in figure and listed in (Supplementary Table 6). C The mean particle size (µm3) of SIM and WF chromatin domains of population 0 (red) and population 1 (yellow) are plotted as box plots. There is no significant difference between the populations. The mean and median of the box plots are also indicated. D The track straightness of SIM and WF chromatin domains of population 0 (red) and population 1 (yellow) are plotted as box plots. There is a highly significant difference between the two populations (p < 0.001). The mean and median of the box plots are also indicated. E The distance start–end (µm) of SIM and WF chromatin domains of population 0 (red) and population 1 (yellow) are plotted as box plots. There is a highly significant difference between the two populations (p < 0.001). The mean and median of the box plots are also indicated. The statistics of the plots are shown in figure and listed in (Supplementary Table 6). Scale bar 5 µm
Fig. 6
Fig. 6
Location-based analysis of chromatin domains. A Representative images for chromatin classification (shells with equal volume) based on the spatial location of labeled foci. HeLa K GFP-PCNA cells with overlaid GFP-PCNA signal (green) and labeled chromatin (magenta) are shown. The PCNA signal was used to identify the nuclear border, and the whole nuclear volume was divided into 7 shells having equal volume. The 7 shells are represented in different colors. The chromatin tracks of SIM and WF within each shell were then marked and colored according to the shell (Supplementary Fig. 14). B The mean velocity (µm/s) of labeled chromatin domains subdivided into different shells are plotted in a box plot and the median and mean values of mean velocity are indicated. The significance test between chromatin in shell 1 (outer) versus other shells were plotted (Supplementary Fig. 13). C The radius of gyration (µm) of labeled chromatin domains subdivided into different shells are plotted in a box plot and the median and mean values of mean velocity are indicated. The significance test between chromatin in shell 1 (outer) versus other shells was plotted. D The number of particles present in each shell and subdivided into population 0 (red) and population 1 (yellow) were plotted in percentages for both SIM and WF time-lapse videos. The statistics of the plots are shown in the figure and listed in (Supplementary Table 6). Scale bar 5 µm
Fig. 7
Fig. 7
Mobility of chromosome territories. A Illustration of labeled DNA after segregation over several cell cycles resulting into individual chromosome territories labeled. Overlay image of HeLa K GFP-PCNA cells with PCNA (green) and labeled DNA (magenta). The borders of chromosome territories are marked with yellow dotted lines. The chromatin tracks of chromosome territories are overlaid. The white dotted lines represent the nuclear borders. B The chromosome territories were tracked as a whole chromosome from the widefield (WF) time-lapse movies to obtain the mean squared displacement curves (MSD, µm2) over time intervals (s) (Supplementary Fig. 8). The MSD curves (µm2) over time intervals (s) were plotted for SIM (green), WF (blue), and chromosome territories (purple) were then plotted. C The table details the values of the anomalous diffusion coefficient α and the diffusion coefficient D (µm2/s × 10−5). D Mean squared displacement curves (MSD, µm2) over time intervals (s) of individual chromosome territories were plotted. The dark curve represents the average MSD (µm2) of all chromosome territories. E MSD (µm2) over time intervals (s) of chromosome territories grouped as labeled chromosomes touching the nuclear border (outer territories, light red) and labeled chromosomes not touching the nuclear border (inner territories, red) was plotted. Scale bar 5 µm. See Video 6

Similar articles

Cited by

  • Seeing genomes.
    Misteli T. Misteli T. Histochem Cell Biol. 2024 Jul;162(1-2):1-2. doi: 10.1007/s00418-024-02301-0. Histochem Cell Biol. 2024. PMID: 38850309 No abstract available.

References

    1. Adey A, Burton JN, Kitzman JO, et al. The haplotype-resolved genome and epigenome of the aneuploid HeLa cancer cell line. Nature. 2013;500:207–211. doi: 10.1038/nature12064. - DOI - PMC - PubMed
    1. Albiez H, Cremer M, Tiberi C, et al. Chromatin domains and the interchromatin compartment form structurally defined and functionally interacting nuclear networks. Chromosome Res. 2006;14:707–733. doi: 10.1007/s10577-006-1086-x. - DOI - PubMed
    1. Arthur D, Vassilvitskii S. k-means++: The advantages of careful seeding. In Soda. 2007;7:1027–1035.
    1. Baddeley D, Chagin VO, Schermelleh L, et al. Measurement of replication structures at the nanometer scale using super-resolution light microscopy. Nucl Acids Res. 2010;38:e8. doi: 10.1093/nar/gkp901. - DOI - PMC - PubMed
    1. Balakrishnan G, Zhao A, Sabuncu MR, et al. Voxelmorph: a learning framework for deformable medical image registration. IEEE Trans Med Imaging. 2019 doi: 10.1109/TMI.2019.2897538. - DOI - PubMed

LinkOut - more resources