. 2024 May 28;43(5):114229.
doi: 10.1016/j.celrep.2024.114229. Epub 2024 May 16.

Modulation of GPR133 (ADGRD1) signaling by its intracellular interaction partner extended synaptotagmin 1

Affiliations

Modulation of GPR133 (ADGRD1) signaling by its intracellular interaction partner extended synaptotagmin 1

Gabriele Stephan et al. Cell Rep. .

Abstract

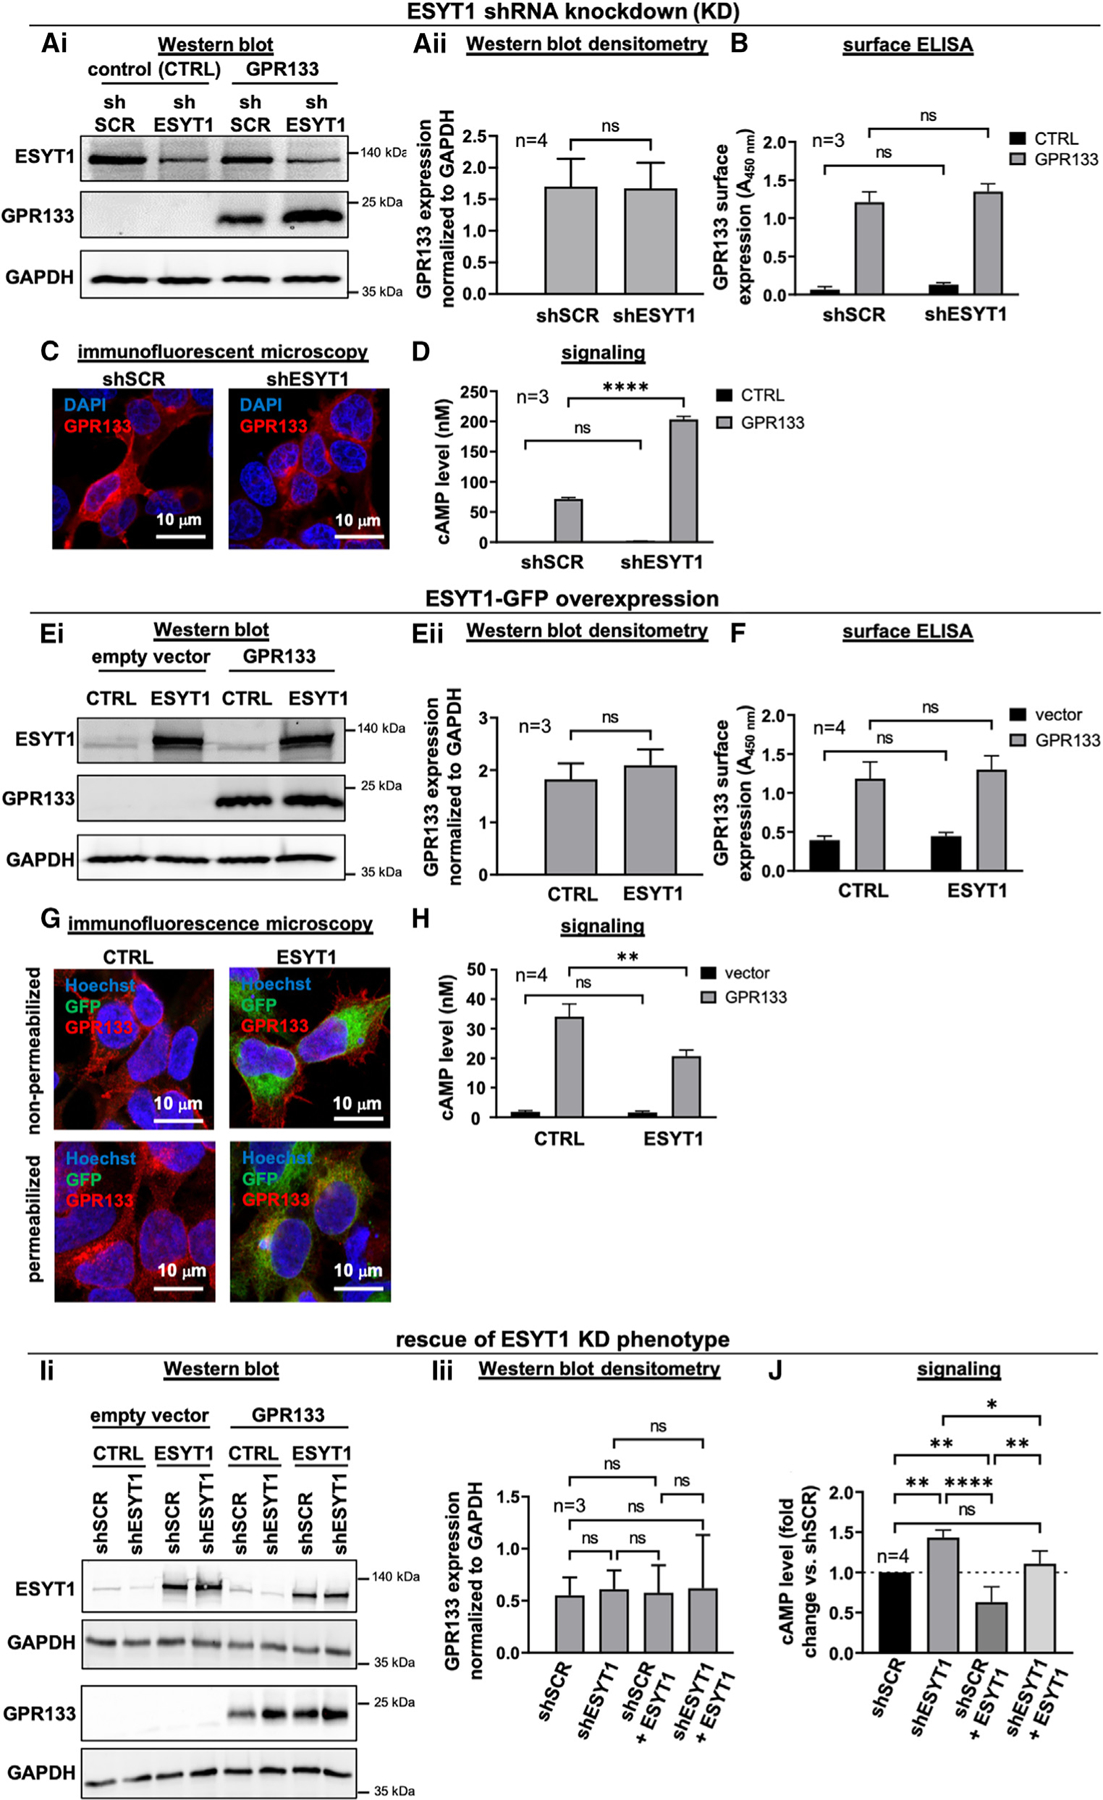
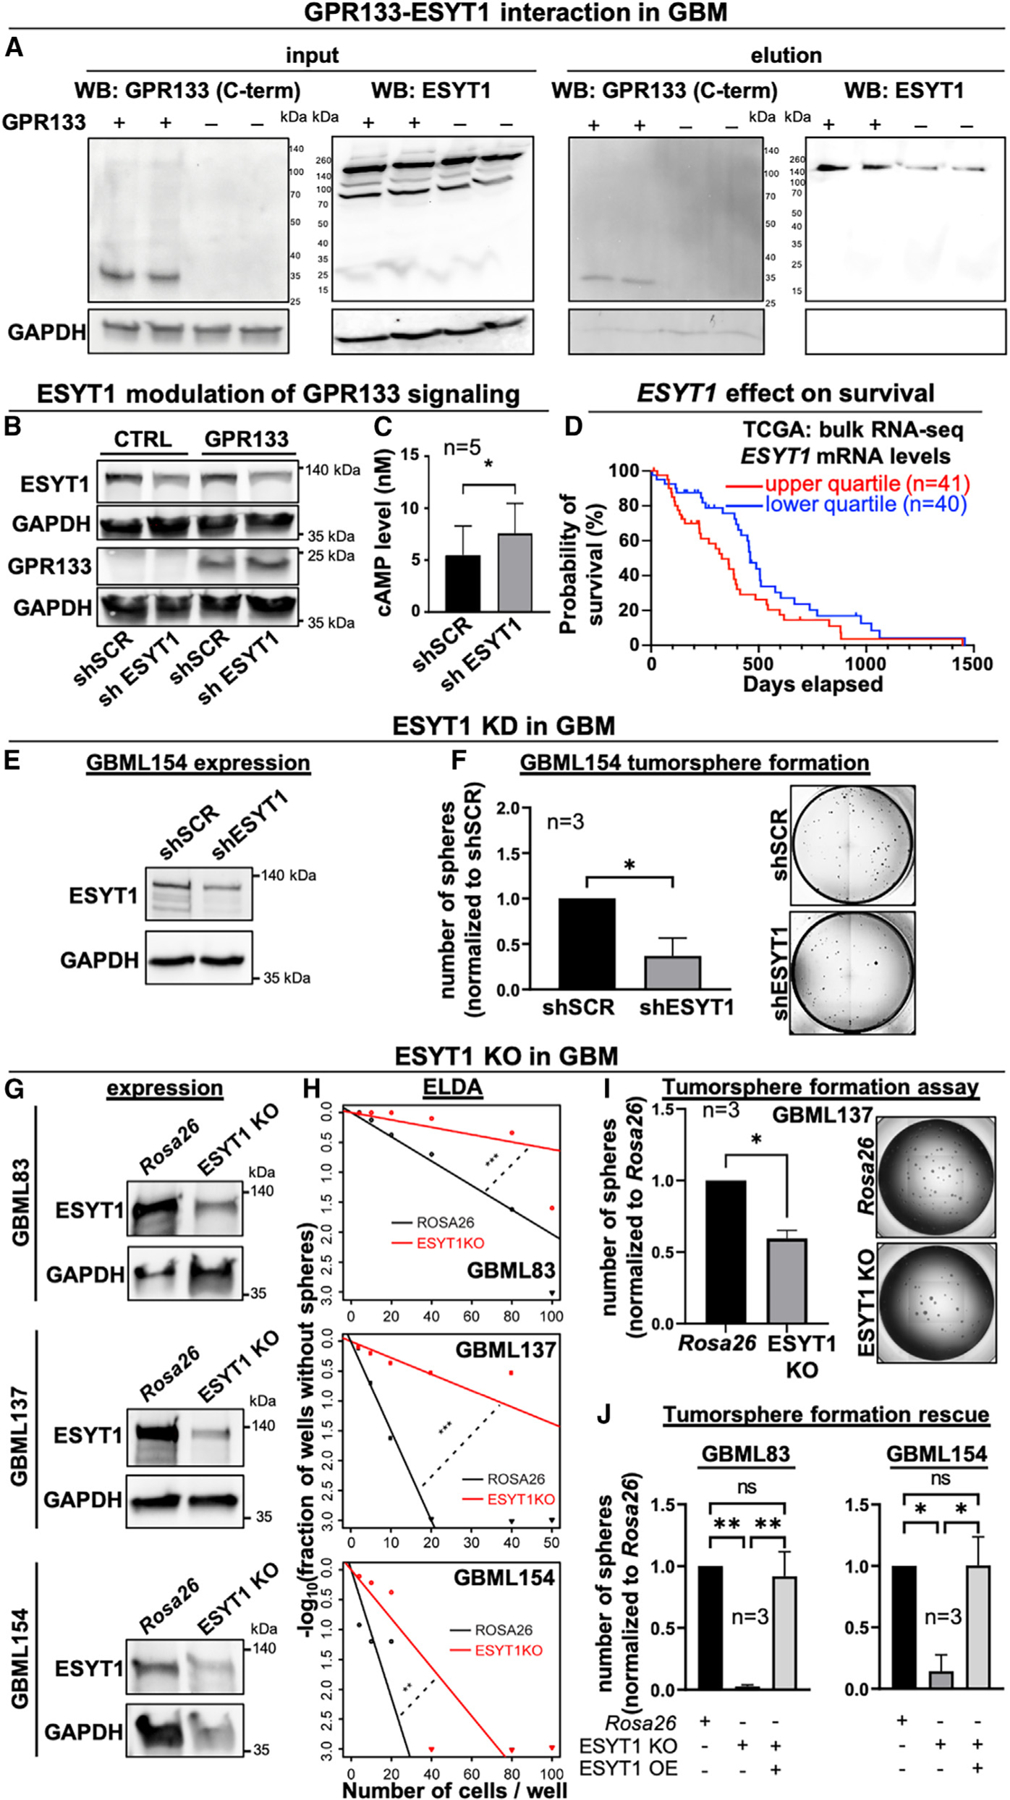
GPR133 (ADGRD1) is an adhesion G-protein-coupled receptor that signals through Gαs/cyclic AMP (cAMP) and is required for the growth of glioblastoma (GBM), an aggressive brain malignancy. The regulation of GPR133 signaling is incompletely understood. Here, we use proximity biotinylation proteomics to identify ESYT1, a Ca2+-dependent mediator of endoplasmic reticulum-plasma membrane bridge formation, as an intracellular interactor of GPR133. ESYT1 knockdown or knockout increases GPR133 signaling, while its overexpression has the opposite effect, without altering GPR133 levels in the plasma membrane. The GPR133-ESYT1 interaction requires the Ca2+-sensing C2C domain of ESYT1. Thapsigargin-mediated increases in cytosolic Ca2+ relieve signaling-suppressive effects of ESYT1 by promoting ESYT1-GPR133 dissociation. ESYT1 knockdown or knockout in GBM slows tumor growth, suggesting tumorigenic functions of ESYT1. Our findings demonstrate a mechanism for the modulation of GPR133 signaling by increased cytosolic Ca2+, which reduces the signaling-suppressive interaction between GPR133 and ESYT1 to raise cAMP levels.

Keywords: CP: Cancer; CP: Cell biology; ESYT1; GPR133; adhesion G-protein-coupled receptor; cAMP; calcium; extended synaptotagmin; proximity biotinylation proteomics.


Conflict of interest statement

Declaration of interests D.G.P. and NYU Grossman School of Medicine own an EU and Hong Kong patent titled “Method for treating high-grade gliomas” on the use of GPR133 as a treatment target in glioma. D.G.P. and collaborators at NYU Grossman School of Medicine have filed a patent application titled “Anti-CD97 antibodies and antibody-drug conjugates”. D.G.P. has received consultant fees from Tocagen, Synaptive Medical, Monteris, Robeaute, Advantis, and Servier Pharmaceuticals.

Figures

Figure 1.
Figure 1.. Identification of ESYT1 as a cytosolic interaction partner of GPR133
(A) Experimental design: BioID2-fusion constructs of wild-type (WT) or mutant (H543R/T545A) GPR133 were overexpressed in HEK293T cells. Following treatment with biotin, biotinylated proteins were purified using NeutrAvidin beads. Purified proteins were analyzed by mass spectrometry. (B) Volcano plots showing enriched (orange) proteins in the comparisons of WT or mutant GPR133 to control. The dashed lines show a p-value cutoff of <10−5 and log10 fold-change cutoff of >1. GPR133 and ESYT1 are identified on the plots. (C) Structure and function of ESYT1. (i) Structural domains of ESYT1. (ii) ESYT1 dimers form ER-PM tethers in response to elevations in cytosolic Ca2+. (D) Co-purification confirms binding of ESYT1 to Twin-Strep-tagged GPR133, both WT and the uncleavable H543R mutant. (i) Input samples: whole-cell lysates of HEK293T cells expressing WT GPR133 or the cleavage-deficient mutant GPR133 (H543R) with a C-terminal Twin-Strep-tag following transfection with ESYT1 (red arrowheads, full-length uncleaved GPR133; blue arrowheads, GPR133 CTF after cleavage; black arrowheads, ESYT1). (ii) Elution samples following Strep-Tactin purification. The ESYT1 bands in elution samples (ii) ran at a slightly higher apparent molecular weight than the ESYT1 bands in input samples (i), possibly because of the impact of reagents used for the co-purification and elution on electrophoretic mobility. WB, western blot; C-term, antibody against the cytosolic C terminus of GPR133.
Figure 2.
Figure 2.. Effects of ESYT1 knockdown and overexpression on GPR133 signaling
(A–D) ESYT1 knockdown. (A) Western blot confirms reduced levels of endogenous ESYT1, following its knockdown (shESYT1) compared to the control (shSCR), and stable expression of GPR133, in transduced HEK293T cells. (i) Representative western blot membrane. (ii) Densitometry of the GPR133 signal confirms unchanged GPR133 expression following the knockdown of ESYT1 (shESYT1) compared to the control (shSCR) (paired t test, p = 0.8986). Bars represent mean ± standard error of the mean (SEM) of four experiments. ns, not significant. (B) GPR133 surface expression is not affected by ESYT1 knockdown in ELISA (two-way ANOVA, p > 0.05). ns, not significant; A450 nm, absorbance/optical density at 450 nm. Bars represent mean ± SEM of three experiments. (C) Immunofluorescent staining shows no change in the subcellular localization of GPR133 following knockdown of ESYT1 compared to the control. (D) Intracellular cAMP levels increase significantly in GPR133-expressing HEK293T cells after knockdown of ESYT1 compared to the control (two-way ANOVA F(1,8) = 503.2, p < 0.0001; Sidak’s post hoc test, GPR133 + shSCR vs. GPR133 + shESYT1, p < 0.0001). Bars represent mean ± SEM of three experiments. (E–H) ESYT1-GFP overexpression. (i) Western blot confirms increased ESYT1-GFP protein levels following transfection of GPR133-expressing cells. (ii) GPR133 expression levels are not affected in HEK293T cells overexpressing ESYT1 in quantitative densitometry comparisons (paired t test, p = 0.3203). Bars represent mean ± SEM of three experiments. ns, not significant. (F) GPR133 surface expression remains unchanged following overexpression of ESYT1-GFP (two-way ANOVA, p > 0.05). Bars represent mean ± SEM of four experiments. ns, not significant; A450 nm, absorbance/optical density at 450 nm. (G) Immunofluorescent staining of both permeabilized and non-permeabilized HEK293T cells expressing GPR133 combined with either empty vector or ESYT1-GFP. The subcellular distribution of GPR133 immunoreactivity is unchanged by the presence of ESYT1-GFP. The permeabilized cells also show co-localization in ESYT1-GFP and GPR133 immunoreactivity within intracellular compartments. (H) Intracellular cAMP levels significantly decrease in GPR133-expressing HEK293T cells following overexpression of ESYT1-GFP compared to the control (two-way ANOVA F(1,12) = 7.928, p < 0.0156; Sidak’s post hoc test, GPR133 + CTRL vs. GPR133 + ESYT1, p = 0.0041). Bars represent mean ± SEM of four experiments. ns, not significant. (I and J) ESYT1 overexpression rescues the effect of ESYT1 knockdown in GPR133-overexpressing cells. (i) Western blot confirming ESYT1 knockdown and overexpression in HEK293T cells and HEK293T cells overexpressing GPR133. (ii) Expression levels of GPR133 were not affected following knockdown or overexpression of ESYT1 in quantitative densitometry (one-way ANOVA, p > 0.05). Bars represent mean ± SEM of three experiments. ns, not significant. (J) Intracellular cAMP levels of GPR133-expressing HEK293T cells are normalized to shSCR. Bars represent mean ± SEM of four experiments. Compared to the control (shSCR), GPR133 signaling increases significantly following transduction with shESYT1 and decreases significantly following transfection with ESYT1. ESYT1 overexpression rescues the increase in cAMP levels after ESYT1 KD (one-way ANOVA F(3,12) = 24.64, p < 0.0001; Tukey’s post hoc test, shSCR vs. shESYT1, p = 0.0030; shSCR vs. shSCR + ESYT1, p = 0.0094; shESYT1 vs. shSCR + ESYT1, p < 0.0001; shESYT1 vs. shESYT1 + ESYT1, p = 0.0217; shSCR + ESYT1 vs. shESYT1 + ESYT1, p = 0.0014). Bars represent mean ± SEM of four experiments. ns, not significant.
Figure 3.
Figure 3.. ESYT1 domains necessary for the interaction with GPR133
(A) Schematic showing ESYT1 deletion mutants used in this experiment. (B) GPR133 surface expression in ELISAs following transfection of control HEK293T cells and HEK293T cells stably expressing GPR133 with different ESYT1 constructs. Overexpression of ESYT1, ΔC2C, ΔC2E, or ΔC2C+E did not affect GPR133 surface expression compared to the vector control (two-way ANOVA, p > 0.05). Bars represent the mean ± SEM of five to eight experiments. A450 nm, absorbance/optical density at 450 nm. (C) Intracellular cAMP levels following transfection of HEK293T cells stably expressing GPR133 with WT or mutant ESYT1 constructs. Concentrations of cAMP were significantly decreased in GPR133-expressing cells after transfection with ESYT1 and ΔC2E compared to the vector control. Overexpression of ΔC2C increased cAMP levels compared to the vector control and WT ESYT1 in GPR133-expressing HEK293T cells (two-way ANOVA F(4,46) = 9.471, p < 0.0001; Sidak’s post hoc test, GPR133 + vector vs. GPR133 + ESYT1, p = 0.0001; GPR133 + vector vs. GPR133 + ΔC2C, p = 0.0080; GPR133 + ESYT1 vs. GPR133 + ΔC2C, p < 0.0001; GPR133 + ESYT1 vs. GPR133 + ΔC2C+E, p = 0.0002; GPR133 + ΔC2E vs. GPR133 + ΔC2C+E, p = 0.0218). Bars represent the mean ± SEM of five to eight experiments. (D) Affinity purification analysis testing binding of different ESYT1 constructs to GPR133. Input samples represent whole-cell lysates of naive HEK293T cells and HEK293T cells stably overexpressing GPR133 transfected with WT or deletion ESYT1 constructs. Elution samples following Strep-Tactin purification demonstrate that ESYT1-specific bands are detected only in GPR133-expressing cells transfected with WT ESYT1 and ΔC2E, but not after transfection with ΔC2C or ΔC2C+E.
Figure 4.
Figure 4.. Intracellular Ca2+ increases impact GPR133 signaling dependent on ESYT1 expression
(A) Confocal images of HEK293 cells stably overexpressing MAPPER-GFP (green) transfected with Myc-tagged ESYT1 WT and mutant constructs (red) following treatment with DMSO or 1 μM TG to increase intracellular Ca2+ concentration. Yellow regions within the images represent overlap of MAPPER (green) and Myc-tagged ESYT1 (red), suggesting localization of ESYT1 at ER-PM junctions. The overlap is significantly more extensive following TG treatment of HEK293-MAPPER cells overexpressing WT ESYT1 rather than the mutant constructs. (B–G) Effects of intracellular Ca2+ increases on GPR133 surface expression (B, D, and F) and cAMP levels (C, E, and G). (B and C) TG treatment of HEK293T cells stably expressing GPR133 transfected with vector or full-length WT or D724A mutant ESYT1. Bars represent mean ± SEM of four to seven experiments. (B) TG treatment had no effect on GPR133 surface expression in GPR133-expressing HEK293T cells transfected with vector, WT ESYT1, or D724A ESYT1 compared to treatment with DMSO (paired t test, p > 0.05). (C) TG treatment significantly increased cAMP levels in GPR133-expressing HEK293T cells transfected with vector and WT ESYT1 compared to treatment with DMSO (paired t test; GPR133 + vector, DMSO vs. TG, p = 0.0210; GPR133 + ESYT1, DMSO vs. TG, p = 0.0189). TG treatment did not affect GPR133 signaling following transfection of D724A ESYT1 (paired t test, p > 0.05). ns, not significant. (D and E) TG treatment of HEK293T cells transduced with shSCR or shESYT1 to knock down ESYT1. Bars represent mean ± SEM of four experiments. (D) TG treatment did not affect GPR133 surface expression compared to treatment with DMSO in GPR133-expressing HEK293T cells transduced with shSCR or shESYT (paired t test, p > 0.05). (E) TG treatment significantly increased cAMP concentrations compared to treatment with DMSO in HEK293T cells overexpressing GPR133 and transduced with shSCR (paired t test, p = 0.018). TG treatment had no effect on cAMP levels compared to DMSO following overexpression of GPR133 and ESYT1 KD (paired t test, p > 0.05). ns, not significant. (F and G) TG treatment of HEK293T cells stably expressing GPR133 transfected with ESYT1 deletion mutants ΔC2C, ΔC2E, or ΔC2C+E. Bars represent mean ± SEM of four or five experiments. (F) Treatment with TG had no effect on GPR133 surface expression in GPR133-expressing HEK293T cells transfected with ΔC2C, ΔC2E, or ΔC2C+E compared to treatment with DMSO (paired t test, p > 0.05). (G) TG treatment did not affect cAMP concentrations compared to treatment with DMSO in GPR133-expressing HEK293T cells transfected with ΔC2C, ΔC2E, or ΔC2C+E (paired t test, p > 0.05). ns, not significant.
Figure 5.
Figure 5.. Intracellular Ca2+ increases disrupt binding of GPR133 and ESYT1
(A) Confocal images of HEK293T cells transfected with GPR133 alone (green) or co-transfected with GPR133 and Myc-tagged ESYT1 (red). In the co-transfection condition, the majority of transfected cells express both GPR133 and ESYT1 (orange arrowheads). (B) Western blot confirms overexpression of GPR133 and ESYT1 in transfected HEK293T cells. (C) Representative PLA images of HEK293T cells transfected with GPR133 or co-transfected with GPR133 and ESYT1. The red PLA signal (arrow) is only present in cells co-transfected with GPR133 and ESYT1. The signal is weaker in cells treated with 1 μM TG compared to cells treated with DMSO. (D) Quantification of PLA-positive signals (red dots) over DAPI-positive cells overexpressing GPR133 and ESYT1. Bars represent the mean ± SEM of three experiments. The PLA/DAPI ratio is significantly decreased in TG-treated cells (paired t test, p < 0.05). (E) Optical sections of GPR133 + ESYT1 images from the lower images in (C), detecting a strong PLA signal in DMSO-treated cells (arrows), but a weaker signal in TG-treated cells.
Figure 6.
Figure 6.. ESYT1 impacts GPR133 signaling and tumorsphere formation in patient-derived GBM cells
(A) Co-purification assay in GBML128 demonstrates interaction of endogenous ESYT1 with C-terminal Twin-Strep-tagged WT GPR133. Input samples (left) show whole-cell lysates of GBML128 GSCs expressing WT GPR133 with a C-terminal Twin-Strep-tag. Elution samples following Strep-Tactin purification are shown on the right. Note that endogenous ESYT1 shows some non-specific purification in the absence of Twin-Strep-tagged GPR133, but it is significantly enriched in the presence of GPR133. Two independent biological replicates were run on the same gel. WB, western blot; GPR133 C-term, antibody against the cytosolic C terminus of GPR133. (B and C) GBML109 was transduced with lentivirus for overexpression of GPR133 and shRNA-mediated knockdown (KD) of ESYT1. (B) Western blot analysis using specific antibodies against ESYT1 (top) and GPR133 (bottom) confirms expression of ESYT1 in GBML109 transduced with the shSCR control and KD of ESYT1 following transduction with shESYT1 in cells overexpressing GPR133 or an empty vector control. (C) Intracellular cAMP levels in GPR133-expressing GBML109 cells are significantly increased following KD of ESYT1 compared with the control (paired t test, p < 0.05). Bars represent the mean ± SEM of five experiments. (D) Kaplan-Meier survival curves from the TCGA GBM dataset as a function of ESYT1 mRNA levels in bulk RNA-seq of surgical specimens. Patients in the upper quartile of ESYT1 mRNA levels experience shorter survival (median 329 days) relative to patients in the lower quartile (median 460 days) (log-rank Mantel-Cox test, p = 0.0413). (E and F) Effects of ESYT1 KD by lentiviral transduction of shRNA in GBML154. (E) Western blot analysis confirms KD of ESYT1. (F) Tumorsphere formation is significantly reduced in GBML154 following KD of ESYT1 compared to the control shSCR (paired t test, p = 0.0306). Bars represent the mean ± SEM of three experiments. Representative examples are shown. (G–J) Tumorsphere formation following the CRISPR-Cas9-mediated KO of ESYT1 in GBML83, GBML137, and GBML154. (G) Reduced ESYT1 expression, detected by western blot, following transduction with an ESYT1-specific CRISPR-Cas9 construct compared to the Rosa26 control in three different GSC cultures. (H) Extreme limiting dilution assays (ELDAs) demonstrate impaired clonogenic tumorsphere formation after ESYT1 KO relative to the Rosa26 control in three different GSC cultures. χ2 test; **p < 0.01, ***p < 0.001. (I) Representative example of impaired tumorsphere formation following KO of ESYT1 in GBML137 GSCs (paired t test; *p < 0.05). In this example, 500 cells were seeded per well. Bars represent the mean ± SEM of three experiments. (J) Overexpression (OE) of ESYT1 in GBML83 and GBML154 GSCs rescues the impairment in tumorsphere formation imparted by ESYT1 KO (GBML83: one-way ANOVA F(2,6) = 22.32, p = 0.0017; Tukey’s post hoc test, Rosa26 vs. ESYT1 KO, p = 0.0023; ESYT1 KO vs. ESYT1 KO + ESYT1 OE, p = 0.0036; GBML154: one-way ANOVA F(2,6) = 10.30, p = 0.0115; Tukey’s post hoc test, Rosa26 vs. ESYT1 KO, p = 0.0183; ESYT1 KO vs. ESYT1 KO + ESYT1 OE, p = 0.0179). Bars represent the mean ± SEM of three experiments. ns, not significant.

Update of

References

    1. Krishnan A, Nijmeijer S, de Graaf C, and Schiöth HB (2016). Classification, Nomenclature, and Structural Aspects of Adhesion GPCRs. Handb. Exp. Pharmacol 234, 15–41. 10.1007/978-3-319-41523-9_2. - DOI - PubMed
    1. Hamann J, Aust G, Araç D, Engel FB, Formstone C, Fredriksson R, Hall RA, Harty BL, Kirchhoff C, Knapp B, et al. (2015). International Union of Basic and Clinical Pharmacology. XCIV. Adhesion G protein-coupled receptors. Pharmacol. Rev 67, 338–367. 10.1124/pr.114.009647. - DOI - PMC - PubMed
    1. Scholz N, Langenhan T, and Schöneberg T (2019). Revisiting the classification of adhesion GPCRs. Ann. N. Y. Acad. Sci 1456, 80–95. 10.1111/nyas.14192. - DOI - PMC - PubMed
    1. Kaczmarek I, Suchý T, Prömel S, Schöneberg T, Liebscher I, and Thor D (2021). The relevance of adhesion G protein-coupled receptors in metabolic functions. Biol. Chem 403, 195–209. 10.1515/hsz-2021-0146. - DOI - PubMed
    1. Langenhan T (2020). Adhesion G protein-coupled receptors-Candidate metabotropic mechanosensors and novel drug targets. Basic Clin. Pharmacol. Toxicol 126 (Suppl 6), 5–16. 10.1111/bcpt.13223. - DOI - PubMed

LinkOut - more resources