. 2024 May 17;10(20):eadj5942.
doi: 10.1126/sciadv.adj5942. Epub 2024 May 17.

Mitochondrial ACSS1-K635 acetylation knock-in mice exhibit altered metabolism, cell senescence, and nonalcoholic fatty liver disease

Affiliations

Mitochondrial ACSS1-K635 acetylation knock-in mice exhibit altered metabolism, cell senescence, and nonalcoholic fatty liver disease

Guogang Xu et al. Sci Adv. .

Abstract

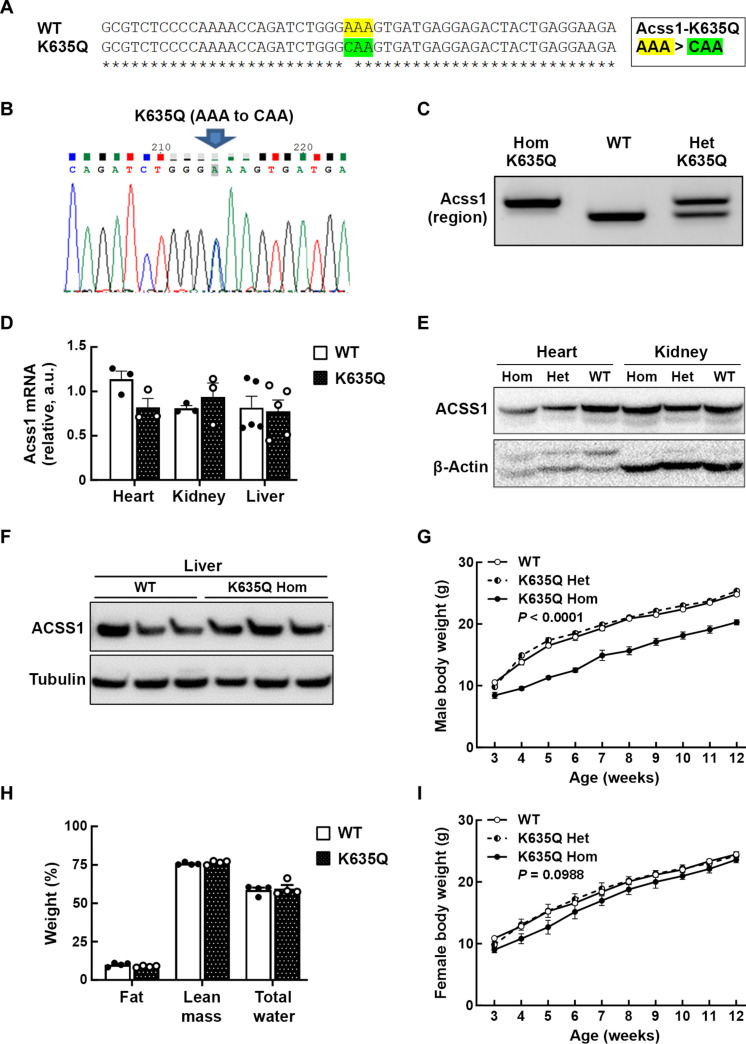
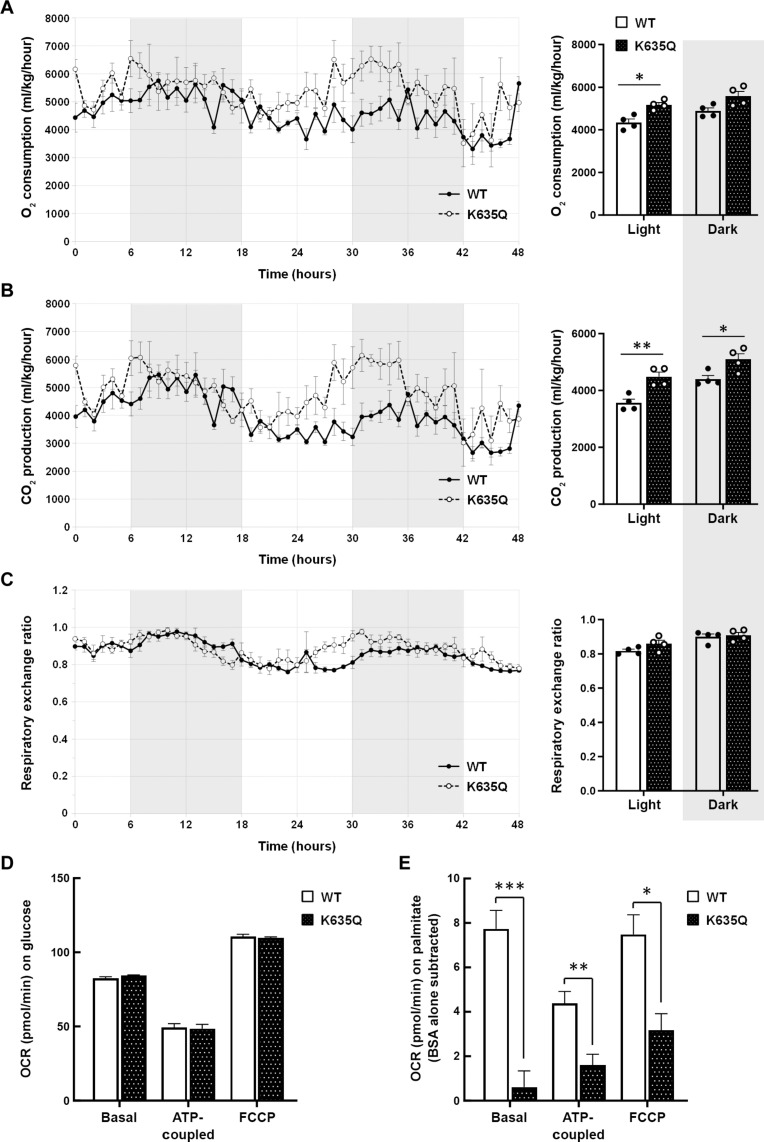
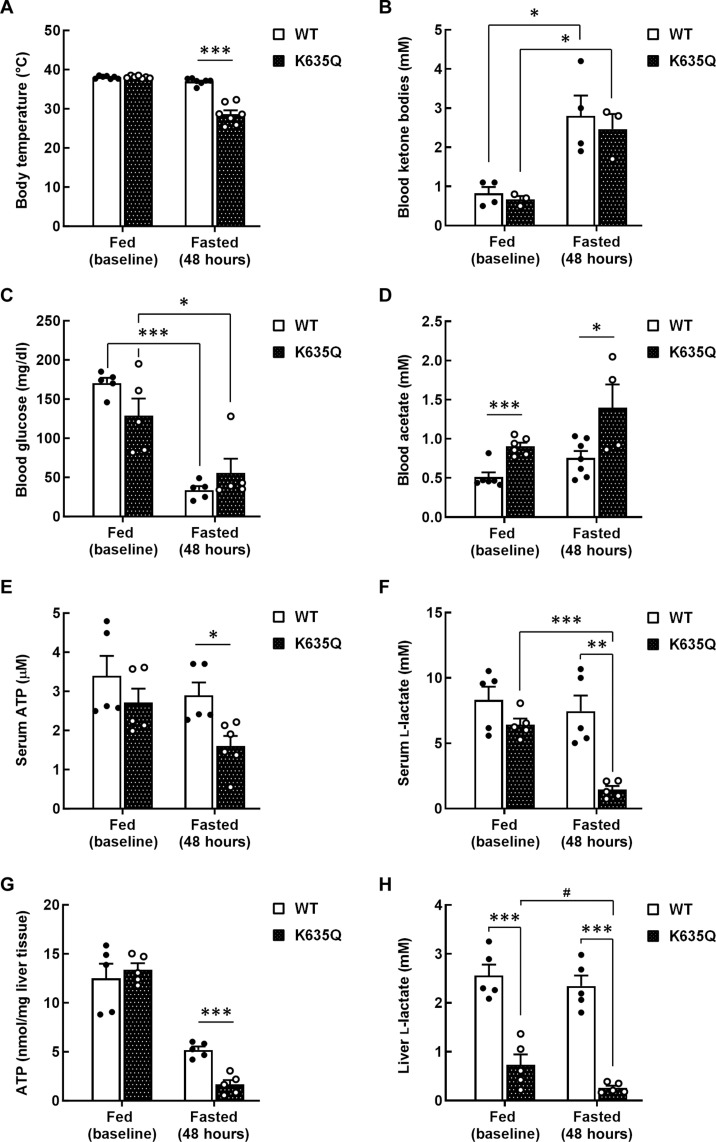
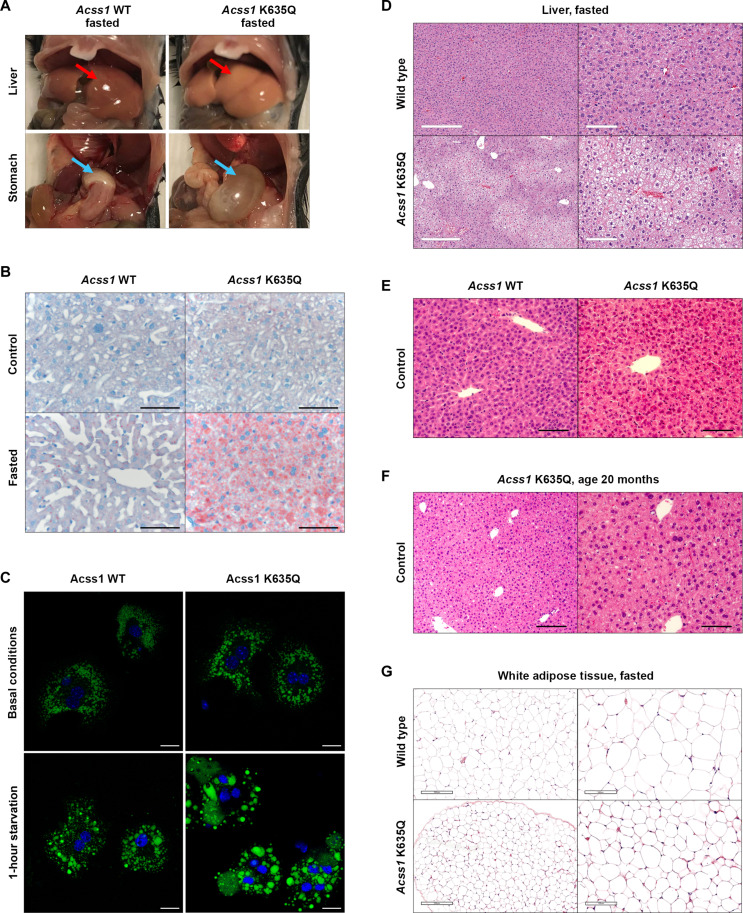
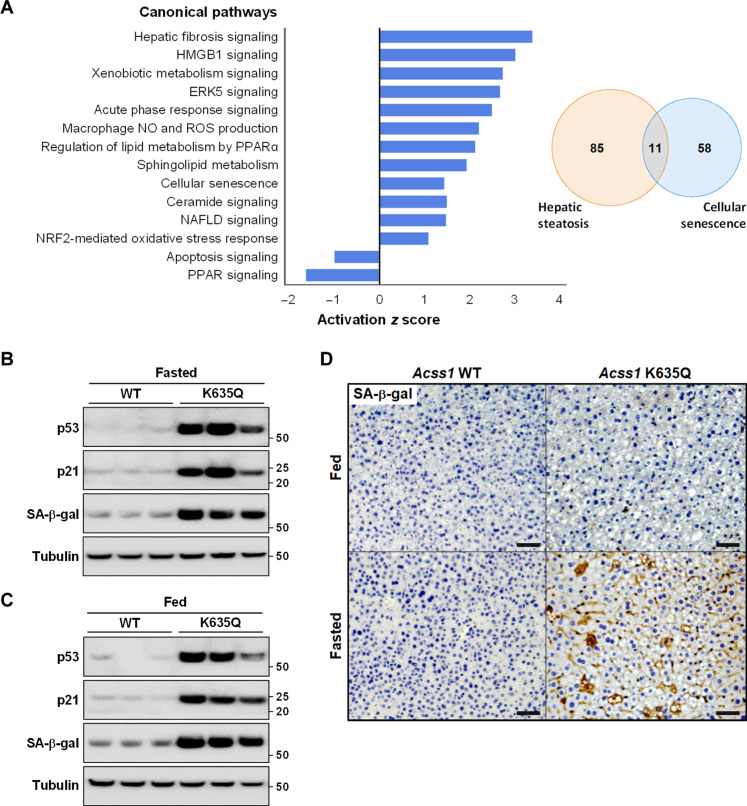
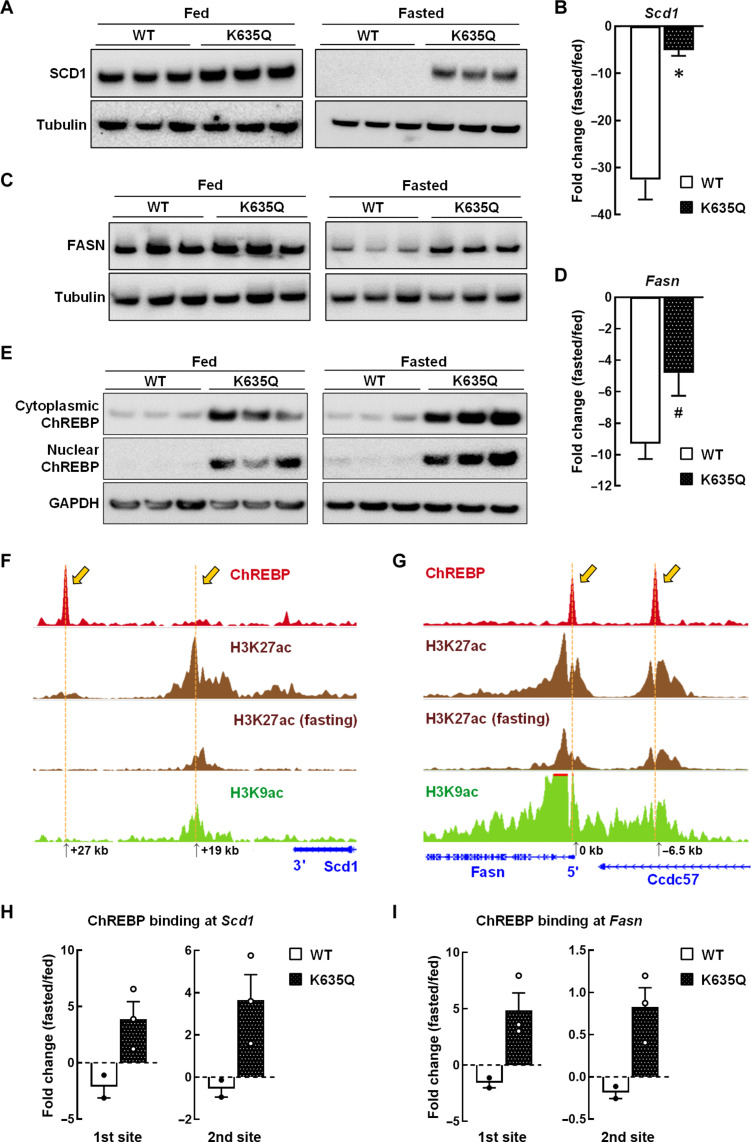
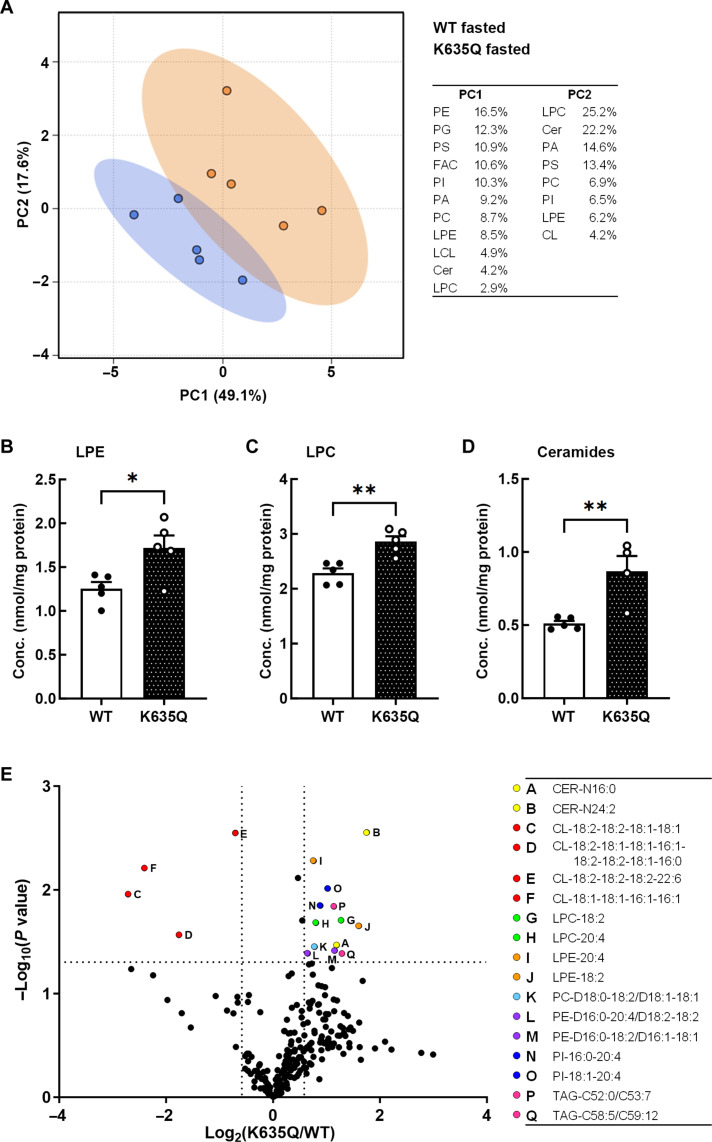
Acetyl-CoA synthetase short-chain family member 1 (ACSS1) uses acetate to generate mitochondrial acetyl-CoA and is regulated by deacetylation by sirtuin 3. We generated an ACSS1-acetylation (Ac) mimic mouse, where lysine-635 was mutated to glutamine (K635Q). Male Acss1K635Q/K635Q mice were smaller with higher metabolic rate and blood acetate and decreased liver/serum ATP and lactate levels. After a 48-hour fast, Acss1K635Q/K635Q mice presented hypothermia and liver aberrations, including enlargement, discoloration, lipid droplet accumulation, and microsteatosis, consistent with nonalcoholic fatty liver disease (NAFLD). RNA sequencing analysis suggested dysregulation of fatty acid metabolism, cellular senescence, and hepatic steatosis networks, consistent with NAFLD. Fasted Acss1K635Q/K635Q mouse livers showed increased fatty acid synthase (FASN) and stearoyl-CoA desaturase 1 (SCD1), both associated with NAFLD, and increased carbohydrate response element-binding protein binding to Fasn and Scd1 enhancer regions. Last, liver lipidomics showed elevated ceramide, lysophosphatidylethanolamine, and lysophosphatidylcholine, all associated with NAFLD. Thus, we propose that ACSS1-K635-Ac dysregulation leads to aberrant lipid metabolism, cellular senescence, and NAFLD.


Figures

Fig. 1.
Fig. 1.. Characterization of ACSS1-K635Q mouse model.
(A) DNA sequence for the mice that were genetically altered to express the K635-Ac mimic mutant Acss1 gene by replacing lysine (AAA) at codon location 635 to glutamine (CAA). WT, wild type. (B) Genomic DNA was extracted from a hemizygous founder mouse and sequenced to confirm the AAA to CAA substitution at codon 635. (C) PCR product sizes of the target region of Acss1 confirm the genotypes of Acss1K635Q/K635Q, Acss1+/+ (WT), and heterozygous Acss1K635Q/+ mice. Hom, homozygous; Het, heterozygous. (D) RNA was isolated from Acss1+/+ (WT) and Acss1K635Q/K635Q (Hom) heart, kidney, and liver tissues, and Acss1 mRNA expression levels were quantified by qPCR. a.u., arbitrary units. (E) Immunoblot showing ACSS1 in heart and kidney extracts from Acss1+/+ (WT), Acss1K635Q/+ (Het), and Acss1K635Q/K635Q (Hom) mice. (F) Immunoblot showing ACSS1 in liver extracts from wild-type and Acss1K635Q/K635Q mice. (G) The body weights of male Acss1+/+, Acss1K635Q/+, and Acss1K635Q/K635Q mice were measured from 3 weeks of age until 12 weeks (N = 5 mice per group). Exact P value shown, calculated by two-way analysis of variance (ANOVA). (H) qMRI showing fat, lean mass, and total water as percentage of total body weight in 3-month-old male Acss1K635Q/K635Q mice versus wild-type mice (N = 4 mice per group). (I) The body weights of female Acss1+/+, Acss1K635Q/+, and Acss1K635Q/K635Q mice were measured from 3 weeks of age until 12 weeks (N = 5 mice per group). Exact P value shown, calculated by two-way ANOVA.
Fig. 2.
Fig. 2.. ACSS1-K635Q alters metabolism.
(A to C) Wild-type and Acss1K635Q/K635Q mice were individually housed to measure (A) oxygen consumption, (B) carbon dioxide production, and (C) RER during light and dark cycles (N = 4 mice per group). Data are normalized to lean body mass and represented as mean ± SEM. *P < 0.05, **P < 0.01 calculated by one-way ANOVA. (D) Basal, ATP-coupled, and FCCP-uncoupled OCRs in wild-type and Acss1K635Q/K635Q primary fibroblasts with 0.5 mM glucose (N = 2 mice per group, four to six technical replicates each). (E) Basal, ATP-coupled, and FCCP-uncoupled OCR in wild-type and Acss1K635Q/K635Q primary fibroblasts with 0.5 μM carnitine and 100 μM BSA-conjugated palmitate (N = 3 mice per group, four technical replicates each), as compared to BSA alone (OCR on BSA was subtracted from BSA-conjugated palmitate). Data are represented as mean ± SEM. *P < 0.05, **P < 0.01, ***P < 0.001, calculated by two-tailed unpaired Student’s t tests.
Fig. 3.
Fig. 3.. Metabolic dysregulation in fasted Acss1K635Q/K635Q mice.
(A) Body temperature of fed and 48-hour–fasted wild-type and Acss1K635Q/K635Q mice. (B to F) Serum extracted from wild-type and Acss1K635Q/K635Q mice at baseline (fed) and after a 48-hour fast was measured for (B) ketones, (C) glucose, (D) acetate, (E) ATP, and (F) l-lactate. (G and H) Liver tissue isolated from fed and fasted wild-type and Acss1K635Q/K635Q mice was used to measure (G) ATP and (H) l-lactate levels. Data are represented as mean ± SEM. #P < 0.08, *P < 0.05, **P < 0.01, ***P < 0.001, calculated by two-tailed unpaired Student’s t tests.
Fig. 4.
Fig. 4.. Liver microsteatosis and fatty liver in fasted Acss1K635Q/K635Q mice.
(A) Images of liver and stomach from fasted wild-type and Acss1K635Q/K635Q mice (see arrows). (B) Oil Red O staining of liver from fed and fasted wild-type and Acss1K635Q/K635Q mice. Scale bars, 100 μm. (C) Lipid droplet staining in primary hepatocytes from wild-type and Acss1K635Q/K635Q mice under basal conditions (top) and after 1-hour starvation (bottom). Scale bars, 20 μm. (D to F) H&E staining of liver from (D) fasted wild-type and Acss1K635Q/K635Q mice [scale bars, 300 μm (left) and 100 μm (right)], (E) fed wild-type and Acss1K635Q/K635Q mice (scale bars, 50 μm), and (F) 20-month-old Acss1K635Q/K635Q mice [scale bars, 100 μm (left) and 50 μm (right)]. (G) H&E staining of white adipose tissue from fasted wild-type and Acss1K635Q/K635Q mice. Scale bars, 200 μm (left) and 100 μm (right).
Fig. 5.
Fig. 5.. Dysregulated cell senescence and fatty acid metabolism in Acss1K635Q/K635Q liver.
(A) Total RNAs were isolated from the liver tissues of wild-type and Acss1K635Q/K635Q mice after a 48-hour fast and sent for RNA-seq (N = 3 mice per group). Differentially expressed genes were processed using the Qiagen Ingenuity Pathway Analysis (IPA) software to determine pathway enrichment and significance scores. Bar graph shows the top five differentially regulated Ingenuity Canonical Pathways by P value as well as select differentially regulated pathways involved in metabolism and stress response. Venn diagram shows overlap between differentially regulated genes involved in hepatic steatosis and cellular senescence. (B and C) Immunoblots showing relative p53, p21, and SA-β-gal levels in liver tissue from (B) fasted and (C) fed wild-type and Acss1K635Q/K635Q mice. (D) IHC staining for SA-β-gal in liver tissue from fed and fasted wild-type and Acss1K635Q/K635Q mice. Scale bars, 100 μm.
Fig. 6.
Fig. 6.. Dysregulated fatty acid synthesis in Acss1K635Q/K635Q liver.
(A) Immunoblots showing relative SCD1 in liver extracts from fed (left panel) and fasted (right panel) wild-type and Acss1K635Q/K635Q mice. (B) Scd1 was quantified by qPCR in liver from fed and fasted wild-type and Acss1K635Q/K635Q mice (N = 3 mice per group). Data are presented as mean fold change ± SEM. *P < 0.05, calculated by two-tailed unpaired Student’s t tests. (C) Immunoblots showing relative FASN in liver extracts from fed (left panel) and fasted (right panel) wild-type and Acss1K635Q/K635Q mice. (D) Fasn was quantified by qPCR in liver from fed and fasted wild-type and Acss1K635Q/K635Q mice (N = 3 mice per group). Data are presented as mean fold change ± SEM. #P < 0.08, calculated by two-tailed unpaired Student’s t tests. (E) Immunoblots showing relative ChREBP in cytoplasmic and nuclear subcellular fractions from livers of fed (left panel) and fasted (right panel) wild-type and Acss1K635Q/K635Q mice. (F and G) GEO datasets identify ChREBP DNA binding sites in (F) Scd1 and (G) Fasn in liver tissue (accession ID GSM6730577). Sites of H3K27ac, with and without fasting, and H3K9ac are shown. The Scd1 and Fasn gene locations are in blue. (H and I) ChIP assay using an anti-ChREBP antibody and primers overlapping the DNA binding sites in (H) Scd1 and (I) Fasn with liver extracts from fed and fasted wild-type and Acss1K635Q/K635Q mice. Data are represented as mean fold change ± SEM.
Fig. 7.
Fig. 7.. Liver lipidomics comparing fasted wild-type and Acss1K635Q/K635Q mice.
(A) Principal components analysis (N = 5 mice per group). (B to D) LPE (B), LPC (C), and ceramides (D) are up-regulated 1.4-fold, 1.3-fold, and 1.7-fold, respectively, in fasted Acss1K635Q/K635Q mice compared to fasted wild-type mice. Data are represented as mean ± SEM. *P < 0.05 and **P < 0.01, calculated by two-tailed unpaired Student’s t tests. (E) Volcano plot showing the degree of differential regulation of specific lipid species. Cer, ceramide; CL, cardiolipin; FAC, fatty acyl chains; LCL, lysocardiolipin; LPC, lysophosphatidylcholine; LPE, lysophosphatidylethanolamine; PA, phosphatidic acid; PC, phosphatidylcholine; PE, phosphatidylethanolamine; PG, phosphatidylglycerol; PI, phosphatidylinositol; PS, phosphatidylserine; TAG, triacylglycerol.

References

    1. Schug Z. T., Peck B., Jones D. T., Zhang Q., Grosskurth S., Alam I. S., Goodwin L. M., Smethurst E., Mason S., Blyth K., McGarry L., James D., Shanks E., Kalna G., Saunders R. E., Jiang M., Howell M., Lassailly F., Thin M. Z., Spencer-Dene B., Stamp G., van den Broek N. J., Mackay G., Bulusu V., Kamphorst J. J., Tardito S., Strachan D., Harris A. L., Aboagye E. O., Critchlow S. E., Wakelam M. J., Schulze A., Gottlieb E., Acetyl-CoA synthetase 2 promotes acetate utilization and maintains cancer cell growth under metabolic stress. Cancer Cell 27, 57–71 (2015). - PMC - PubMed
    1. Castro L. F., Lopes-Marques M., Wilson J. M., Rocha E., Reis-Henriques M. A., Santos M. M., Cunha I., A novel acetyl-CoA synthetase short-chain subfamily member 1 (Acss1) gene indicates a dynamic history of paralogue retention and loss in vertebrates. Gene 497, 249–255 (2012). - PubMed
    1. Gerhart-Hines Z., Rodgers J. T., Bare O., Lerin C., Kim S. H., Mostoslavsky R., Alt F. W., Wu Z., Puigserver P., Metabolic control of muscle mitochondrial function and fatty acid oxidation through SIRT1/PGC-1α. EMBO J. 26, 1913–1923 (2007). - PMC - PubMed
    1. Morise A., Mourot J., Boue C., Combe N., Amsler G., Gripois D., Quignard-Boulange A., Yvan-Charvet L., Fenart E., Weill P., Hermier D., Gender-related response of lipid metabolism to dietary fatty acids in the hamster. Br. J. Nutr. 95, 709–720 (2006). - PubMed
    1. Schwer B., Bunkenborg J., Verdin R. O., Andersen J. S., Verdin E., Reversible lysine acetylation controls the activity of the mitochondrial enzyme acetyl-CoA synthetase 2. Proc. Natl. Acad. Sci. U.S.A. 103, 10224–10229 (2006). - PMC - PubMed

MeSH terms