. 2024 May 17;10(20):eado1463.
doi: 10.1126/sciadv.ado1463. Epub 2024 May 17.

Ketogenic diet induces p53-dependent cellular senescence in multiple organs

Affiliations

Ketogenic diet induces p53-dependent cellular senescence in multiple organs

Sung-Jen Wei et al. Sci Adv. .

Abstract

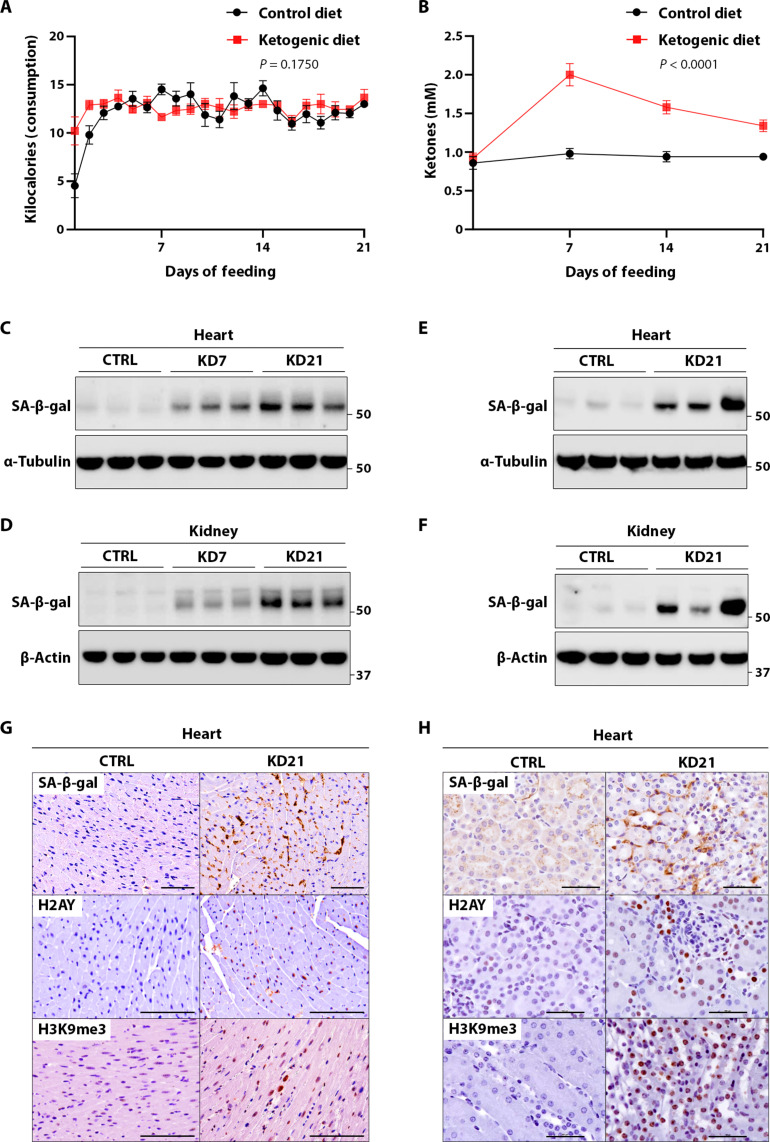
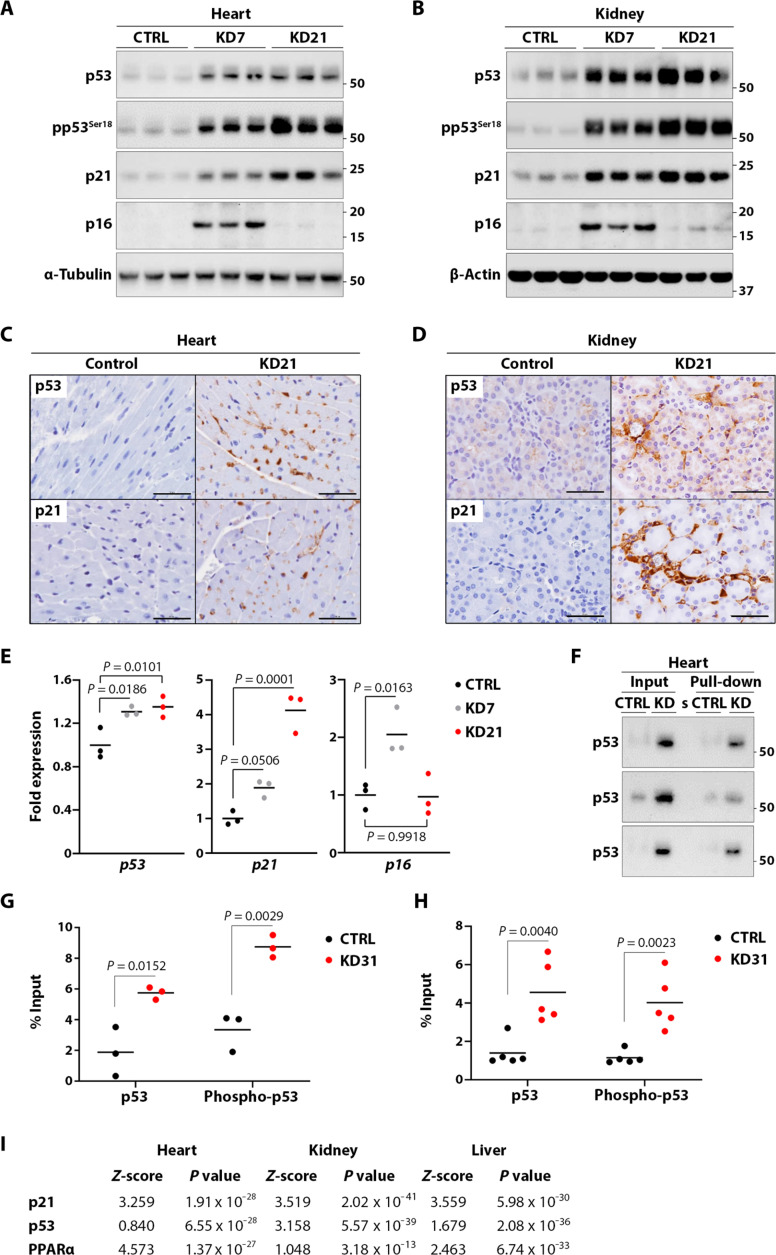
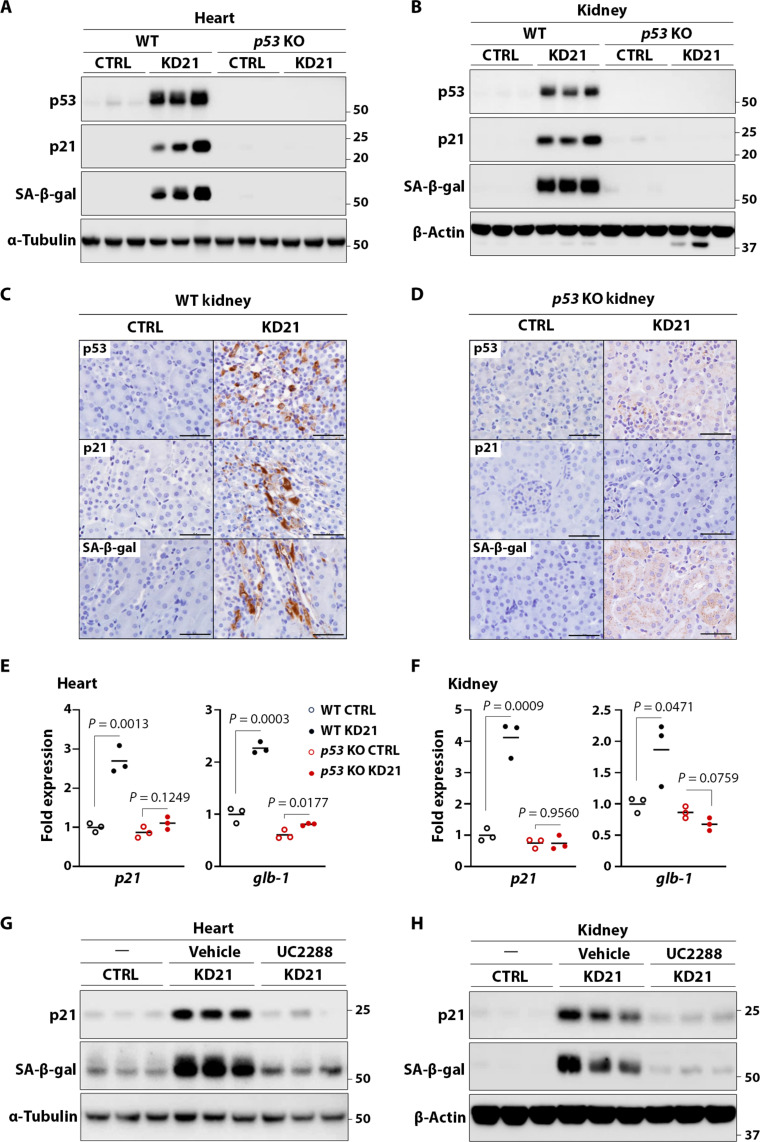
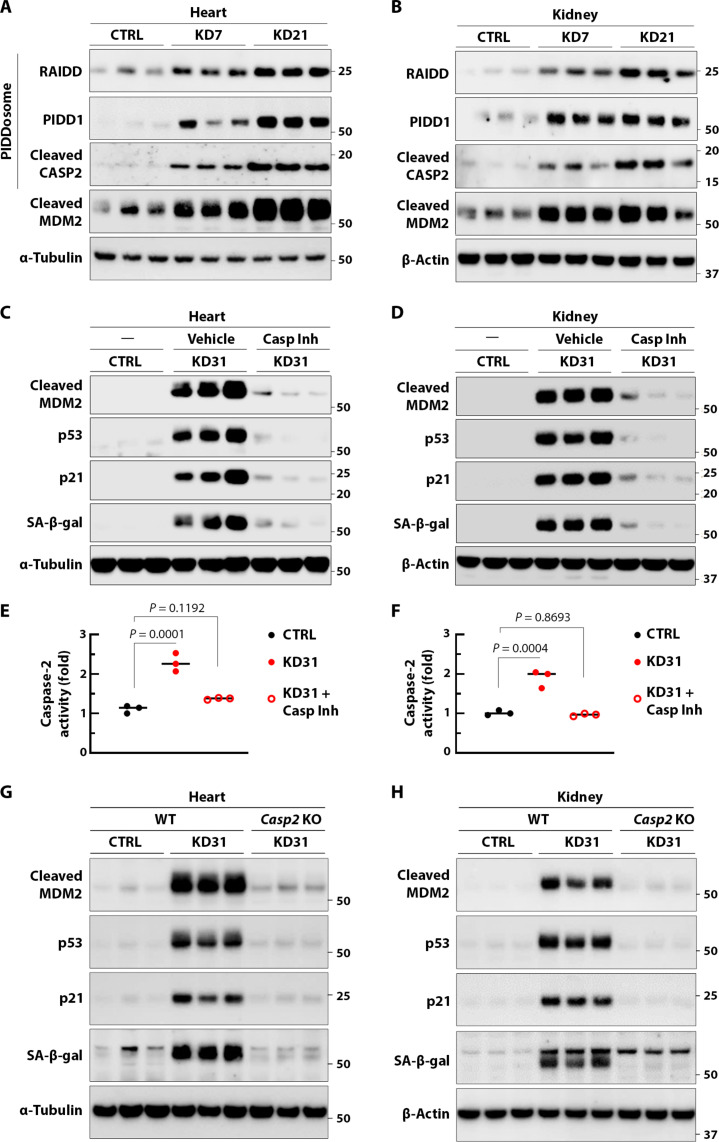
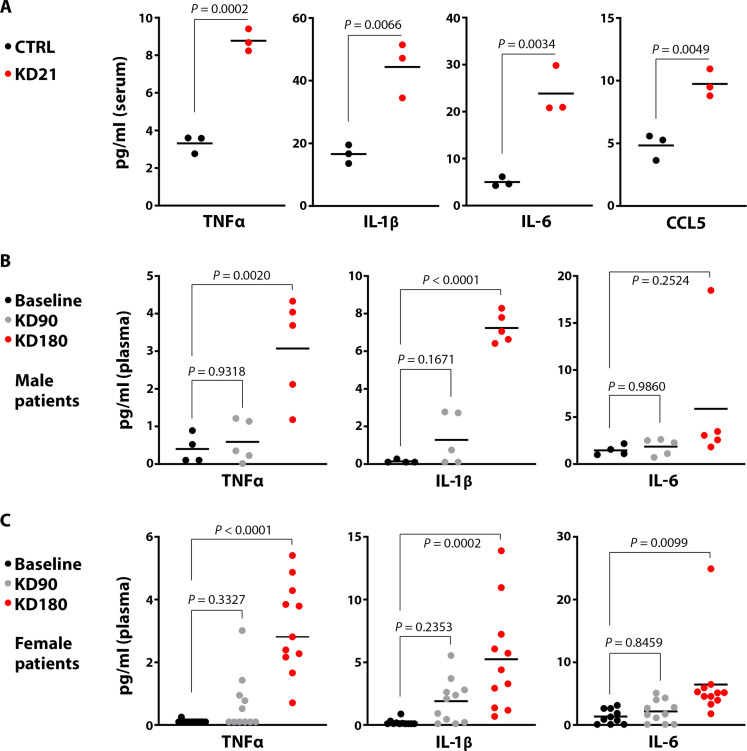
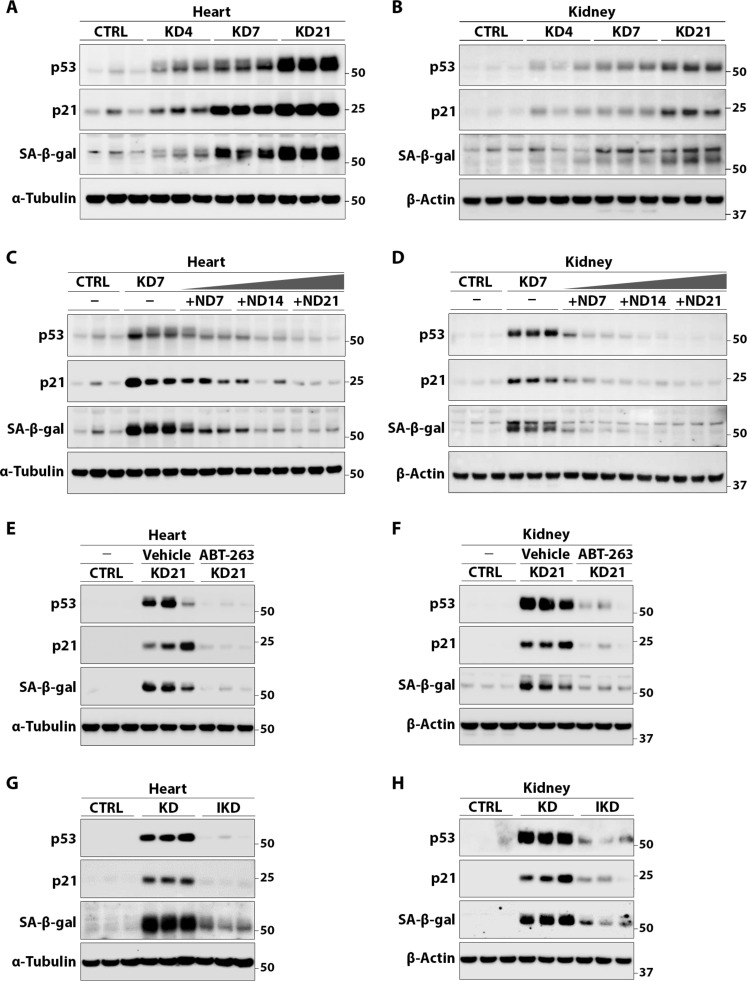
A ketogenic diet (KD) is a high-fat, low-carbohydrate diet that leads to the generation of ketones. While KDs improve certain health conditions and are popular for weight loss, detrimental effects have also been reported. Here, we show mice on two different KDs and, at different ages, induce cellular senescence in multiple organs, including the heart and kidney. This effect is mediated through adenosine monophosphate-activated protein kinase (AMPK) and inactivation of mouse double minute 2 (MDM2) by caspase-2, leading to p53 accumulation and p21 induction. This was established using p53 and caspase-2 knockout mice and inhibitors to AMPK, p21, and caspase-2. In addition, senescence-associated secretory phenotype biomarkers were elevated in serum from mice on a KD and in plasma samples from patients on a KD clinical trial. Cellular senescence was eliminated by a senolytic and prevented by an intermittent KD. These results have important clinical implications, suggesting that the effects of a KD are contextual and likely require individual optimization.


Figures

Fig. 1.
Fig. 1.. Two different KDs induce cellular senescence.
(A and B) Kilocalorie consumption (A) and serum ketone levels (B) in mice on control (CTRL) or Crisco-based KD (n = 5 mice per group). Data are represented as means ± SEM. P values were calculated by two-way analysis of variance (ANOVA). (C and D) Immunoblots showing senescence-associated β-galactosidase (SA-β-gal) levels in heart (C) and kidney (D) tissue on control or 7- and 21-day Crisco-based KD (n = 6 mice per group). (E and F) Immunoblots show SA-β-gal in heart (E) and kidney (F) tissue on control diet versus 21-day cocoa butter–based KD (n = mice 6 per group). (G and H) Immunohistochemistry (IHC) staining for SA-β-gal, histone protein macroH2A.1 (H2AY), and histone 3 lysine 9 trimethylation (H3K9me3) in heart (G) and kidney (H) tissue on control versus 21-day Crisco-based KD (n = 4 mice per group). Scale bars, 100 μm. All measurements are of distinct biological samples. Representative blots and images are shown.
Fig. 2.
Fig. 2.. A KD activates p53 and induces p21.
(A and B) Immunoblots show p53, phospho-p53Ser18 (pp53Ser18), p21, and p16 levels in heart (A) and kidney (B) tissue following control, 7-day KD, and 21-day KD (n = 6 mice per group). (C and D) IHC staining for p53 and p21 in heart (C) and kidney (D) tissue on control versus 21-day KD (n = 4 mice per group). Scale bars, 100 μm. (E) Reverse transcription quantitative polymerase chain reaction (RT-qPCR) quantification of p53, p21, and p16 mRNA in kidney tissue from mice on the control diet, 7-day KD, and 21-day KD (n = 3 mice per group). P values were calculated by two-tailed Student’s unpaired t test. (F) Kidney lysates were mixed with a biotin-labeled four–tandemly repeated p53 DNA binding sequence (from the p21 promoter), recovered using streptavidin agarose beads, and immunoblotted with p53 antibody (n = 3 mice per group). Lanes labeled “s” were left empty. (G and H) Chromatin immunoprecipitation (ChIP)–qPCR analysis shows binding of p53 and phospho-p53Ser18 at two known p53 binding sites within the p21 promoter region in heart (G) (n = 3 mice per group) and kidney (H) (n = 5 mice per group) cells isolated from mice on control and 31-day KD. P values were calculated by two-tailed Student’s unpaired t test. (I) Total RNAs were isolated from heart, kidney, and liver tissues for RNA sequencing (RNA-seq) from mice on the control diet and on 21-day KD (n = 3 mice per group). Sequence reads were mapped with HiSAT2 aligner and quantified by StringTie, and differential gene expression was identified by DESeq R. The resulting lists of hundreds of differentially expressed genes were processed by QIAGEN ingenuity pathway analysis (IPA) software to identify activated upstream regulators. Representative blots and images are shown. PPARα, peroxisome proliferator–activated receptor α.
Fig. 3.
Fig. 3.. KD-induced cellular senescence is dependent on p53 and p21.
(A and B) Immunoblots from heart (A) and kidney (B) tissue of control [wild type (WT)] or homozygous p53 knockout (p53 KO) mice on control or 21-day KD (n = 6 mice per group). (C and D) IHC staining for p53, p21, and SA-β-gal levels in kidney tissue from WT (C) and p53 KO (D) mice on control or 21-day KD (n = 4 mice per group). Scale bars, 100 μm. (E and F) mRNA levels of p21 and glb1 in WT and p53 KO mice on control versus 21-day KD in heart (E) and kidney (F) tissue (n = 4 mice per group). P values were calculated by two-sided Student’s unpaired t test. (G and H) Immunoblots of heart (G) and kidney (H) tissue from mice on control or 21-day KD during which mice were given UC2288, which chemically inhibits p21, at 15 mg/kg or vehicle every other day by oral gavage (n = 6 mice per group). Representative blots and images are shown.
Fig. 4.
Fig. 4.. A KD activates p53 through cleavage of MDM2.
(A and B) Immunoblots show RAIDD, PIDD1, cleaved caspase-2, and cleaved MDM2 levels in heart (A) and kidney (B) from mice on control diet, 7-day KD, and 21-day KD (n = mice 6 per group). (C and D) Immunoblot analysis of heart (C) and kidney (D) tissue from mice on control or 31-day KD during which mice on a KD were also administered either a selective caspase inhibitor Z-VDVAD-FMK (Casp Inh) at 10 mg/kg or vehicle, every other day by intraperitoneal injection (n = 6 mice per group). (E and F) Caspase-2 activity in heart (E) and kidney (F) lysate on a 21-day KD. P values were calculated by one-way ANOVA followed by Dunnett’s multiple comparisons test. (G and H) Immunoblots show cleaved MDM2, p53, p21, and SA-β-gal in heart (G) or kidney (H) from WT Casp2 and homozygous Casp2 KO mice on a control diet or 21-day KD (n = 5 mice per group). Representative blots are shown.
Fig. 5.
Fig. 5.. A KD activates p53 through AMPK.
(A and B) Immunoblots show total AMPKα and phospho-AMPKα-Thr172 (pAMPKαThr172) levels in heart (A) and kidney (B) tissue in mice on the control diet or 21-day KD (n = 6 mice per group). (C and D) Mice on a 21-day KD were given dorsomorphin (DM), an inhibitor of AMPK activation, at 5 mg/kg or vehicle through daily intraperitoneal injection. Immunoblots show p53, pAMPKαThr172, and SA-β-gal levels (n = 6 mice per group). (E and F) Mice on a 21-day KD were given DM, as above, and immunoblots show levels of PIDD1, RAIDD, and cleaved MDM2 (n = 6 mice per group). Representative blots are shown.
Fig. 6.
Fig. 6.. A KD induces markers of the SASP.
(A) Mouse serum TNFα, IL-1β, IL-6, and CCL5, measured by ELISA in mice on a control or 21-day KD (n = 3 mice per group). P values were calculated by two-sided Student’s unpaired t test. (B and C) TNFα, IL-1β, and IL-6 measured by ELISA in plasma collected from male (B) (n = 5, except 4 at baseline) and female (C) (n = 11) patients at baseline and after 3 and 6 months on a clinical KD trial. P values were calculated by one-way ANOVA followed by Dunnett’s multiple comparisons test.
Fig. 7.
Fig. 7.. KD induces cellular senescence in mice of different ages.
(A to F) Immunoblot assays of p53, p21, and SA-β-gal levels in heart and kidney tissue from mice on control or KD for 21 days at the age of 6 weeks (controls), 16 weeks [(A) and (B)], 24 weeks [(C) and (D)], and 52 weeks [(E) and (F)] (n = 5 mice per group). Representative blots are shown.
Fig. 8.
Fig. 8.. Time course and interventions that prevent KD induced cellular senescence.
(A and B) Immunoblots show p53, p21, and SA-β-gal immunoreactive protein levels in heart (A) and kidney (B) tissue from mice on control diet, 4-day KD, 7-day KD, and 21-day KD (n = 5 mice per group). (C and D) Immunoblot assays from mice placed on a 7-day KD and then switched to the normal control diet (ND) for 0, 7, 14, or 21 days (n = 5 mice per group). (E and F) Immunoblot analysis of heart (E) and kidney (F) proteins from mice on control or 21-day KD followed by administration of ABT-263 at 50 mg/kg or vehicle administered daily by oral gavage for 7 days (n = 6 mice per group). (G and H) Immunoblot analysis of heart (G) and kidney (H) tissue from mice on control diet, 31-day KD, or IKD consisting of three cycles of 4 days KD and 7 days control diet (n = 6 mice per group). Representative blots are shown.

References

    1. Crosby L., Davis B., Joshi S., Jardine M., Paul J., Neola M., Barnard N. D., Ketogenic diets and chronic disease: Weighing the benefits against the risks. Front. Nutr. 8, 702802 (2021). - PMC - PubMed
    1. Chun K.-C., Ma S.-C., Oh H., Rho J. M., Kim D. Y., Ketogenic diet-induced extension of longevity in epileptic Kcna1-null mice is influenced by gender and age at treatment onset. Epilepsy Res. 140, 53–55 (2018). - PMC - PubMed
    1. Ko G. J., Rhee C. M., Kalantar-Zadeh K., Joshi S., The effects of high-protein diets on kidney health and longevity. J. Am. Soc. Nephrol. 31, 1667–1679 (2020). - PMC - PubMed
    1. Neal E. G., Chaffe H., Schwartz R. H., Lawson M. S., Edwards N., Fitzsimmons G., Whitney A., Cross J. H., The ketogenic diet for the treatment of childhood epilepsy: A randomised controlled trial. Lancet Neurol. 7, 500–506 (2008). - PubMed
    1. Allen B. G., Bhatia S. K., Anderson C. M., Eichenberger-Gilmore J. M., Sibenaller Z. A., Mapuskar K. A., Schoenfeld J. D., Buatti J. M., Spitz D. R., Fath M. A., Ketogenic diets as an adjuvant cancer therapy: History and potential mechanism. Redox Biol. 2, 963–970 (2014). - PMC - PubMed

MeSH terms

Substances