. 2024 May 17;9(95):eadi5374.
doi: 10.1126/sciimmunol.adi5374. Epub 2024 May 17.

TREM2 deficiency reprograms intestinal macrophages and microbiota to enhance anti-PD-1 tumor immunotherapy

Affiliations

TREM2 deficiency reprograms intestinal macrophages and microbiota to enhance anti-PD-1 tumor immunotherapy

Blanda Di Luccia et al. Sci Immunol. .

Abstract

The gut microbiota and tumor-associated macrophages (TAMs) affect tumor responses to anti-programmed cell death protein 1 (PD-1) immune checkpoint blockade. Reprogramming TAM by either blocking or deleting the macrophage receptor triggering receptor on myeloid cells 2 (TREM2) attenuates tumor growth, and lack of functional TREM2 enhances tumor elimination by anti-PD-1. Here, we found that anti-PD-1 treatment combined with TREM2 deficiency in mice induces proinflammatory programs in intestinal macrophages and a concomitant expansion of Ruminococcus gnavus in the gut microbiota. Gavage of wild-type mice with R. gnavus enhanced anti-PD-1-mediated tumor elimination, recapitulating the effect occurring in the absence of TREM2. A proinflammatory intestinal environment coincided with expansion, increased circulation, and migration of TNF-producing CD4+ T cells to the tumor bed. Thus, TREM2 remotely controls anti-PD-1 immune checkpoint blockade through modulation of the intestinal immune environment and microbiota, with R. gnavus emerging as a potential probiotic agent for increasing responsiveness to anti-PD-1.


Conflict of interest statement

Competing interests: M. Colonna is a member of the Vigil Neuro scientific advisory board, is a consultant for Cell Signaling Technology, received research grants from Vigil Neuro during the conduct of the study, and has a patent to TREM2 pending (PCT/US2021/019914). All other authors declare that they have no competing interests.

Figures

Fig. 1.
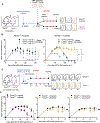
Fig. 1.. Co-housing of TREM2-deficient and wild-type mice abolishes the improved tumor response to anti–PD-1 observed in the absence of TREM2.
(A) Experimental schemes. Mice were co-housed from birth and kept co-housed during the experiment (Coh) or separated at day 0 (Sep). Pregnant mothers of different genotypes were co-housed and litters were cross-fostered to avoid a potential effect driven by the maternal microbiota. (B) MCA/1956 tumor growth in the indicated conditions: wild-type (Trem2+/+) or TREM2-deficient (Trem2−/−) Sep Coh. All groups were treated with anti–PD-1 (n = 4 to 6). (C) Experimental schemes. Mice were generated from separated breeders and therefore separated at birth (Sep-b). (D) MCA/1956 tumor growth in the indicated conditions: Trem2+/+ or Trem2−/− Sep or Sep-b (n = 4 or 5). (E) T cell frequency in the tumor at day 15 after tumor injection in the indicated groups. (B and D) All groups were treated with anti–PD-1. Results are representative of at least two independent experiments and are presented as means ± SEM. Two-way ANOVA followed by post hoc comparisons (Tukey’s multiple comparisons test) of time points was used to compare tumor growth across the indicated conditions; statistical significance is indicated for the last time point of the curve. (E) Mann-Whitney U test was used to compare two groups (***P < 0.001; *P < 0.05).
Fig. 2.
Fig. 2.. Gut microbiota affects tumor response to anti–PD-1 in the absence of TREM2.
(A) Schematic representation of CMT experiment. Trem2+/+ and Trem2−/− mice were treated with a cocktail of antibiotics (VNAM) for 3 weeks before colonization with cecal contents previously collected from either Trem2+/+ or Trem2−/− at steady state (mbt-d0) or 3 days after the anti–PD-1 injection (mbt-d12). (B) MCA/1956 tumor growth curve of Trem2+/+ mice (left) colonized with cecal contents previously collected from either Trem2+/+-mbt-d0, Trem2−/−-mbt-d0, or Trem2−/−-mbt-d12; tumor growth curve in Trem2−/− mice (right) colonized with cecal contents collected from either Trem2+/+-mbt-d0, Trem2−/−-mbt-d0, or Trem2+/+-mbt-d12. All mice were treated with anti–PD-1 (n = 5 to 7). (C) Schematic representation of antibiotic treatment experiment in Trem2+/+ and Trem2−/− during tumor growth. Trem2+/+ and Trem2−/− mice were treated with the indicated antibiotics for 3 weeks before tumor injection and throughout the experiment. (D) Tumor growth curve of Trem2+/+ or Trem2−/− treated with either vehicle, ampicillin, or vancomycin. All mice were treated with anti–PD-1 (n = 4 or 5). (B and D) Results are representative of at least two independent experiments and are presented as means ± SEM. (B) Two-way ANOVA followed by post hoc comparisons (Tukey’s multiple comparisons test) of time points was used to compare tumor growth across the indicated conditions; statistical significance is indicated for the last time point of the curve. (D) Two-way ANOVA followed by post hoc comparisons (Šidák’s multiple comparisons test) of time points was used to compare tumor growth across the indicated conditions; statistical significance is indicated for the last time point of the curve (***P < 0.0001; *P < 0.05; ns = not statistically significant).
Fig. 3.
Fig. 3.. Increased relative abundance of R. gnavus is specifically associated with TREM2 deficiency upon anti–PD-1 treatment.
(A) PCoA plots showing beta-diversity analysis performed on the microbiota of Trem2+/+-Sep, Trem2−/−-Sep, Trem2+/+-Coh, and Trem2−/−-Coh mice. (B) Heatmap showing the indicator species analysis performed to compare the fecal microbiota composition of Trem2+/+-Sep and Trem2−/−-Sep. (C) Heatmap showing the indicator species analysis performed to compare the fecal microbiota composition of Trem2−/−-Sep and Trem2−/−-Coh. (D) Heatmap showing the indicator species analysis performed to compare the fecal microbiota composition of Trem2+/+ and Trem2−/− mice treated with metronidazole (−Metro). (B to D) Each column represents a different mouse, and each row denotes a different ASV significantly associated with either group. (A to D) All groups were treated with anti–PD-1 and analyzed 3 days after anti–PD-1 injection (mbt-d12).
Fig. 4.
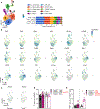
Fig. 4.. TREM2 deficiency is associated with a more inflamed colonic environment after anti–PD-1 treatment.
(A) UMAP plot showing scRNA-seq of colonic myeloid cell clusters from merged conditions: Trem2+/+ or Trem2−/− treated or not with anti–PD-1 (left). Cells were sorted as live/CD45+Ly6GSiglecF/CD11b+. Cluster proportions in each condition: Trem2+/+ and Trem2−/− treated or not with anti–PD-1 (bottom right panel) (n = 2 mice per group). (B) UMAP plots of selected genes from merged conditions. (C) UMAP plots showing Trem2 expression in Trem2+/+ and Trem2−/− mice from merged conditions. (D) T cell frequency in the colon lamina propria in Trem2+/+ and Trem2−/− mice, separated at day 0 (Sep) or co-housed (Coh). All groups were treated with anti–PD-1. (E) TNF protein content in Trem2+/+ and Trem2−/− CD4+ T cells from mice treated or not with anti–PD-1. (A to E) Samples were analyzed 3 days after anti–PD-1 treatment, 12 days after tumor injection (day 12). (A to C) Each group is representative of two mice that were sequenced separately. (D and E) Results are presented as means ± SEM. Mann-Whitney U test was used to compare two groups (*P < 0.05).
Fig. 5.
Fig. 5.. Microbiota from TREM2-deficient mice promotes T cell activation in the tumor bed.
(A) Experimental scheme of CMT in KikGR mice. Mice were treated with a cocktail of antibiotics (VNAM) for 3 weeks before colonization with the cecal content previously collected from either Trem2+/+ or Trem2−/− mice at 3 days after the anti–PD-1 injection (mbt-d12). Mice were treated with anti–PD-1 as indicated and underwent surgery and in situ photoconversion (PC) of mLNs 10 days after tumor injection. Mice were analyzed on day 14 after tumor injection. (B) TNF production in PC and not PC CD4+ T cells, upon ex vivo restimulation with PMA-ionomycin. Cells were sorted from dLNs. Each dot represents the pool of two mice. (C) Flow cytometry analysis of PC T cells in the indicated organs [dLN, tumor, spleen, and control lymph node (cLN)] in the two groups: KikGR mice transplanted with Trem2+/+ mbt-d12 or Trem2−/− mbt-d12. (D) Representative flow plots of PC T cells (KikR+) in dLNs, in the indicated groups. For the control mice (CTRL), mLNs were not photoconverted. (E) Flow cytometry analysis of PC and not PC T cells in the dLNs in the indicated groups. (B, C, and E) Results are representative of at least two independent experiments and presented as means ± SEM. Mann-Whitney U test was used to compare two groups (**P < 0.01; *P < 0.05).
Fig. 6.
Fig. 6.. R. gnavus exposure promotes anti–PD-1 response and drives a remodeling of the tumor immune environment.
(A) Experimental scheme. Wild-type mice were gavaged with R. gnavus (ATCC 29149) or vehicle at the indicated time points. All mice were treated with anti–PD-1. (B) MCA/1956 tumor growth in the indicated conditions: wild-type mice treated with vehicle (CTRL) or R. gnavus. All mice were treated with anti–PD-1 (n = 5). (C) UMAP plot showing scRNA-seq of CD45+ cells from tumors from merged conditions obtained. Mice were euthanized on day 14 (n = 4 mice per group). (D) UMAP plots of selected genes (cluster markers) in CD45+ cell clusters in merged conditions. (E) UMAP plots of CD45+ cells in each condition: mice treated with vehicle (CTRL) or R. gnavus. (F) Cluster proportions of CD45+ cells in the indicated conditions (bar plot and pie charts). (G) Bar plot showing the proportion of each group per cluster among the CD45+ cell clusters. (H) Heatmap showing the selected genes in the indicated T cell clusters. (A to C) Groups are representative of four mice that were sequenced together and deconvoluted on the basis of a unique hashtag antibody. (B) Results are representative of at least two independent experiments and presented as means ± SEM. Two-way ANOVA followed by post hoc comparisons (Šidák’s multiple comparisons test) of time points was used to compare tumor growth across the indicated conditions; statistical significance is indicated for the last time point of the curve (***P < 0.001).
Fig. 7.
Fig. 7.. R. gnavus exposure promotes anti–PD-1 response and drives remodeling of the macrophage compartment in the tumor.
(A) UMAP plot showing scRNA-seq of myeloid cell clusters after reclustering in merged conditions. (B) UMAP plots of myeloid cell clusters in each condition: mice treated with vehicle (CTRL) or R. gnavus. (C) Cluster proportions of myeloid cell clusters in the indicated conditions (bar plot and pie charts). (D) UMAP plots of selected genes (Tgfbr1 and Ifngr1) in myeloid cell clusters in the indicated conditions. (E) UMAP plots of manually curated module of the indicated genes associated with immunosuppression in the indicated conditions. (F) Frequency of macrophages in the tumors in the indicated groups. (G) Frequency of T cells and migratory dendritic cells (mig cDCs) in mLNs in the indicated groups. (H) Frequency of T cells, T cell subsets, and macrophages in colons in the indicated groups. (F to H) Results are presented as means ± SEM. Mann-Whitney U test was used to compare two groups (**P < 0.01; *P < 0.05). (E) One-way ANOVA test was used (P = 1.2 × 10−41). Tregs, regulatory T cells.

References

    1. Leach DR, Krummel MF, Allison JP, Enhancement of antitumor immunity by CTLA-4 blockade. Science 271, 1734–1736 (1996). - PubMed
    1. Freeman GJ, Long AJ, Iwai Y, Bourque K, Chernova T, Nishimura H, Fitz LJ, Malenkovich N, Okazaki T, Byrne MC, Horton HF, Fouser L, Carter L, Ling V, Bowman MR, Carreno BM, Collins M, Wood CR, Honjo T, Engagement of the PD-1 immunoinhibitory receptor by a novel B7 family member leads to negative regulation of lymphocyte activation. J. Exp. Med. 192, 1027–1034 (2000). - PMC - PubMed
    1. Sharma P, Siddiqui BA, Anandhan S, Yadav SS, Subudhi SK, Gao J, Goswami S, Allison JP, The next decade of immune checkpoint therapy. Cancer Discov. 11, 838–857 (2021). - PubMed
    1. Mantovani A, Allavena P, Marchesi F, Garlanda C, Macrophages as tools and targets in cancer therapy. Nat. Rev. Drug Discov. 21, 799–820 (2022). - PMC - PubMed
    1. Molgora M, Colonna M, Turning enemies into allies-reprogramming tumor-associated macrophages for cancer therapy. Med 2, 666–681 (2021). - PMC - PubMed

Publication types

MeSH terms