

Identification and characterization of ferroptosis-related genes in therapy-resistant gastric cancer
- PMID: 38758860
- PMCID: PMC11098190
- DOI: 10.1097/MD.0000000000038193
Identification and characterization of ferroptosis-related genes in therapy-resistant gastric cancer
Abstract
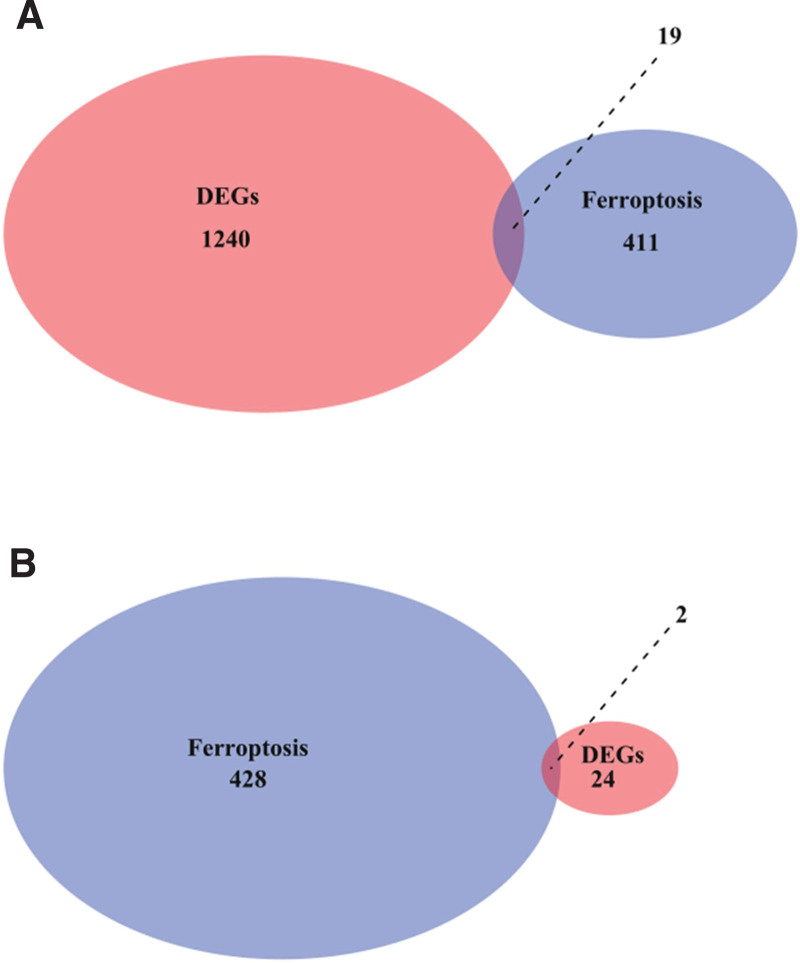
Therapy resistance in gastric cancer poses ongoing challenges, necessitating the identification of ferroptosis-related genes linked to overall survival for potential therapeutic insights. The purpose of the study was to identify ferroptosis-related genes contributing to therapy resistance in gastric cancer and explore their associations with overall survival. Differentially expressed ferroptosis-related genes were identified in therapy-resistant versus therapy-responsive gastric cancer patients. Hub genes were selected from these genes. Enrichment analysis focused on oxidative stress and ROS metabolism. Validation was conducted in a TCGA stomach adenocarcinoma dataset. A hub gene-based risk model (DUSP1/TNF/NOX4/LONP1) was constructed and assessed for overall survival prediction. Associations with the tumor immune microenvironment were examined using the ESTIMATE algorithm and correlation analysis. Ten hub genes were identified, enriched in oxidative stress and ROS metabolism. Validation confirmed their aberrant expressions in the TCGA dataset. The hub gene-based risk model effectively predicted overall survival. High G6PD/TNF expression and low NOX4/SREBF1/MAPK3/DUSP1/KRAS/SIRT3/LONP1 expression correlated with stromal and immune scores. KRAS/TNF/MAPK3 expression positively correlated with immune-related SREBF1/NOX4 expression. DUSP1/NOX4/SREBF1/TNF/KRAS expression was associated with immune cell infiltration. The hub gene-based risk model (DUSP1/TNF/NOX4/LONP1) shows promise as an overall survival predictor in gastric cancer. Ferroptosis-related hub genes represent potential therapeutic targets for overcoming therapy resistance in gastric cancer treatment.
Copyright © 2024 the Author(s). Published by Wolters Kluwer Health, Inc.
Conflict of interest statement
The authors have no funding and conflicts of interest to disclose.
Figures


Similar articles
-
Bioinformatics-based Prognosis Effect of Ferroptosis-related Genes on Gastric Cancer.Cell Biochem Biophys. 2025 Jun;83(2):2237-2251. doi: 10.1007/s12013-024-01634-w. Epub 2025 Feb 13. Cell Biochem Biophys. 2025. PMID: 39946033
-
Tumor microenvironment characteristics of lipid metabolism reprogramming related to ferroptosis and EndMT influencing prognosis in gastric cancer.Int Immunopharmacol. 2024 Aug 20;137:112433. doi: 10.1016/j.intimp.2024.112433. Epub 2024 Jun 12. Int Immunopharmacol. 2024. PMID: 38870879
-
Development and Validation of a Novel Ferroptosis-Related Gene Signature for Predicting Prognosis and the Immune Microenvironment in Gastric Cancer.Biomed Res Int. 2021 Oct 18;2021:6014202. doi: 10.1155/2021/6014202. eCollection 2021. Biomed Res Int. 2021. PMID: 34708125 Free PMC article.
-
Identification and validation of ferroptosis-related biomarkers and the related pathogenesis in precancerous lesions of gastric cancer.Sci Rep. 2023 Sep 26;13(1):16074. doi: 10.1038/s41598-023-43198-4. Sci Rep. 2023. PMID: 37752199 Free PMC article.
-
NOX4 regulates gastric cancer cell invasion and proliferation by increasing ferroptosis sensitivity through regulating ROS.Int Immunopharmacol. 2024 May 10;132:112052. doi: 10.1016/j.intimp.2024.112052. Epub 2024 Apr 8. Int Immunopharmacol. 2024. PMID: 38593505
Cited by
-
Gene Expression in Muscle-Invasive and Non-Muscle-Invasive Bladder Cancer Cells Exposed to Hypoxia.Cancers (Basel). 2025 Aug 11;17(16):2624. doi: 10.3390/cancers17162624. Cancers (Basel). 2025. PMID: 40867253 Free PMC article.
-
Development and validation of a hypoxia- and mitochondrial dysfunction- related prognostic model based on integrated single-cell and bulk RNA sequencing analyses in gastric cancer.Front Immunol. 2024 Aug 6;15:1419133. doi: 10.3389/fimmu.2024.1419133. eCollection 2024. Front Immunol. 2024. PMID: 39165353 Free PMC article.
-
Mechanism and role of ferroptosis in the development of gastric cancer.Clin Exp Med. 2025 May 29;25(1):182. doi: 10.1007/s10238-025-01722-y. Clin Exp Med. 2025. PMID: 40439806 Free PMC article. Review.
References
-
- Smyth EC, Nilsson M, Grabsch HI, van Grieken NC, Lordick F. Gastric cancer. Lancet. 2020;396:635–48. - PubMed
-
- Lordick F, Lorenzen S, Yamada Y, Ilson D. Optimal chemotherapy for advanced gastric cancer: is there a global consensus? Gastric Cancer. 2014;17:213–25. - PubMed
-
- Zhang SX, Liu W, Ai B, Sun LL, Chen ZS, Lin LZ. Current advances and outlook in gastric cancer chemoresistance: a review. Recent Pat Anticancer Drug Discov. 2022;17:26–41. - PubMed
MeSH terms
LinkOut - more resources
Full Text Sources
Medical
Miscellaneous
