. 2024 May 17;18(5):e0012179.
doi: 10.1371/journal.pntd.0012179. eCollection 2024 May.

Transcriptomic analysis of N-terminal mutated Trypanosoma cruzi UBP1 knockdown underlines the importance of this RNA-binding protein in parasite development

Affiliations

Transcriptomic analysis of N-terminal mutated Trypanosoma cruzi UBP1 knockdown underlines the importance of this RNA-binding protein in parasite development

Karina B Sabalette et al. PLoS Negl Trop Dis. .

Abstract

Background: During its life cycle, the human pathogen Trypanosoma cruzi must quickly adapt to different environments, in which the variation in the gene expression of the regulatory U-rich RNA-binding protein 1 (TcUBP1) plays a crucial role. We have previously demonstrated that the overexpression of TcUBP1 in insect-dwelling epimastigotes orchestrates an RNA regulon to promote differentiation to infective forms.

Methods: In an attempt to generate TcUBP1 knockout parasites by using CRISPR-Cas9 technology, in the present study, we obtained a variant transcript that encodes a protein with 95% overall identity and a modified N-terminal sequence. The expression of this mutant protein, named TcUBP1mut, was notably reduced compared to that of the endogenous form found in normal cells. TcUBP1mut-knockdown epimastigotes exhibited normal growth and differentiation into infective metacyclic trypomastigotes and were capable of infecting mammalian cells.

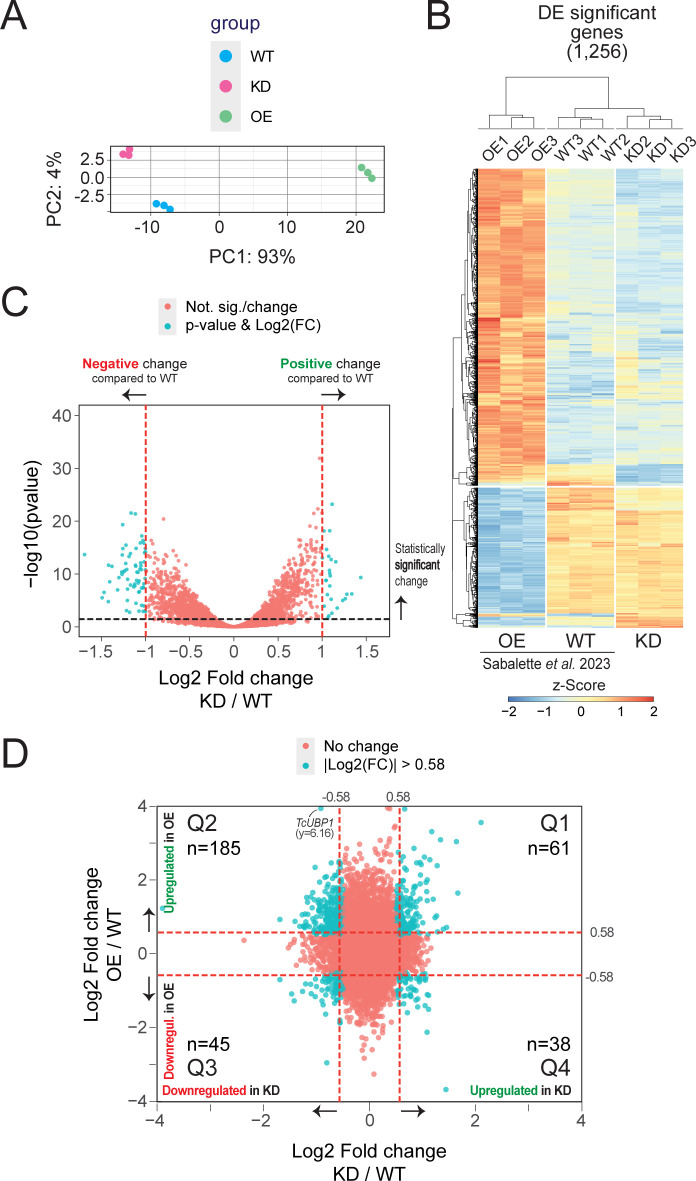
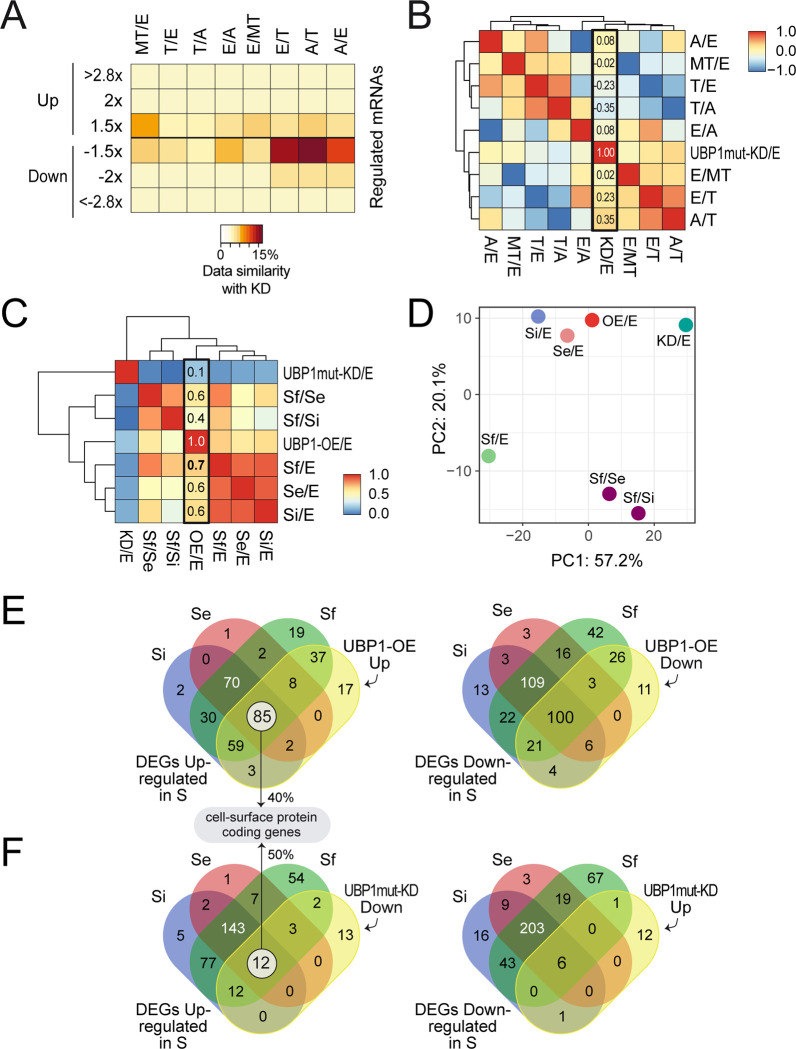
Results: We analyzed the RNA-Seq expression profiles of these parasites and identified 276 up- and 426 downregulated genes with respect to the wildtype control sample. RNA-Seq comparison across distinct developmental stages revealed that the transcriptomic profile of these TcUBP1mut-knockdown epimastigotes significantly differs not only from that of epimastigotes in the stationary phase but also from the gene expression landscape characteristic of infective forms. This is both contrary to and consistent with the results of our recent study involving TcUBP1-overexpressing cells.

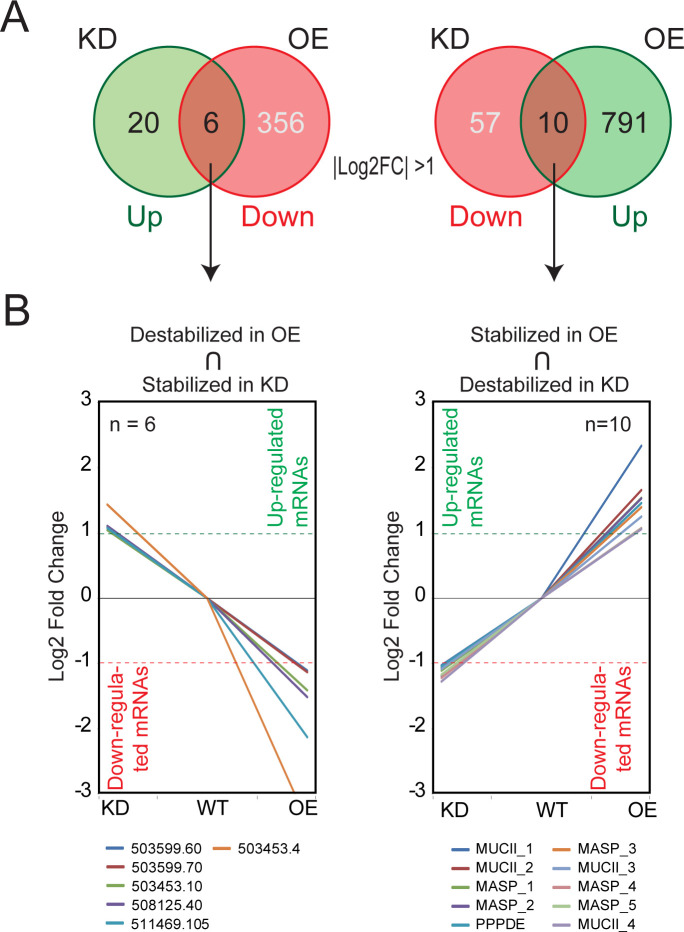
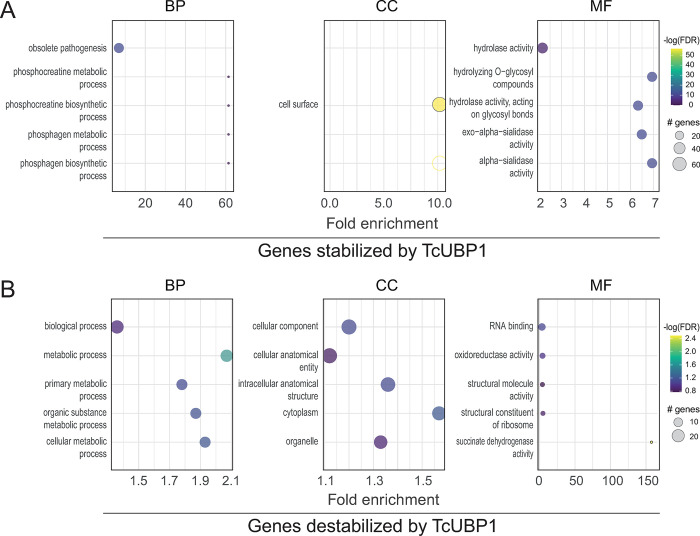
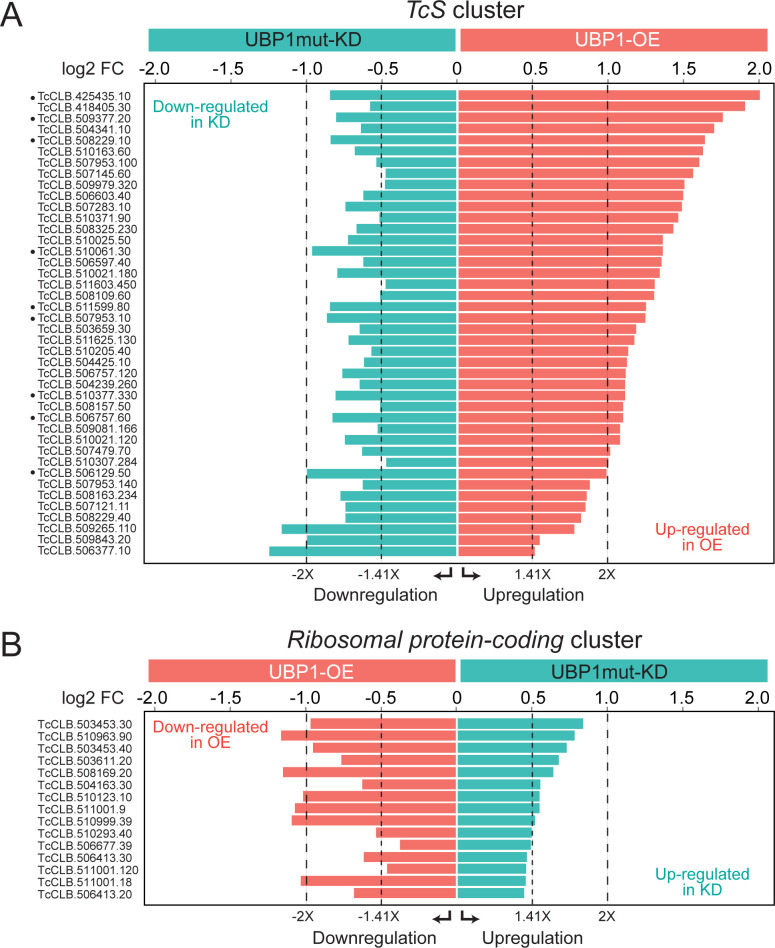
Conclusion: Together, our findings demonstrate that the genes exhibiting opposite changes under overexpression and knockdown conditions unveil key mRNA targets regulated by TcUBP1. These mostly encompass transcripts that encode for trypomastigote-specific surface glycoproteins and ribosomal proteins, supporting a role for TcUBP1 in determining the molecular characteristics of the infective stage.


Conflict of interest statement

The authors have declared that no competing interests exist.

Figures

Fig 1
Fig 1. Diminished expression of the N-terminal mutant protein in TcUBP1mut knockdown parasites.
A, T. cruzi controls parasites transfected with pROCK-Cas9-GFP. A representative image of a transfected epimastigote cell. Grayscale images of each channel are shown on the left, and a merged image showing expression of GFP (in green) and DAPI staining (in blue) for visualization of kinetoplast (K) and nuclear DNA (N) is shown on the right. B, Equal amounts of protein extracts from WT and KD epimastigotes were layered on each lane (see left panel, Coomassie staining gel). The blot was reacted with rabbit polyclonal anti-RRM antibodies. TcUBP1 and TcUBP1mut are indicated by arrows and relative quantification of the protein is indicated below each lane. C, Scheme of the chimera monocistronic RNA identified by sequencing in the UBP1mut population. Fragments of CDS for TcUBP2 (green) and TcUBP1 (tomato) are shown indicating the starting and ending positions. Scheme of TcUBP1, TcUBP2 and UBP1mut proteins and sequence alignment of the N-terminus of TcUBP1 and TcUBP1mut is shown. N, nucleus; K, kinetoplast DNA; SL, spliced leader sequence; AAAAA, poly(A) tail.
Fig 2
Fig 2. UBP1mut knockdown parasites have normal morphology and viability.
A, Representative grayscale images of each channel are shown on the left for wildtype (WT), pROCK-spCas9-GFP (Cas9-GFP) and UBP1mut (KD) CRISPR-Cas9 transfected epimastigotes. Merged images showing expression of TcUBP1 (anti-RRM signal, in red) and DAPI staining (in blue) for visualization of kinetoplast (K) and nuclear DNA (N) are shown on the right. B, the key is as for A) using a mouse polyclonal N-terminal-specific antibody (anti-NH2-TcUBP1 signal in red) for visualization of TcUBP1 expression. C, Parasite growth curves of UBP1mut-KD (continuous line), wildtype populations (WT) and epimastigotes transfected with spCas9-GFP as experimental control (pointed lines, with markers in crosses and circles, respectively). Values of x107 parasites/mL of culture medium are plotted according to the time at which a sample was taken (mean ± SD of three independent replicates). D, Differentiation from late-stationary phase cultured epimastigotes UBP1mut-KD (continuous lines) and those transfected with spCas9-GFP as controls (pointed lines). The percentage of the total population is plotted according to the time at which a sample was taken (mean ± SD of three independent replicates). Markers in circles refer to epimastigotes and crosses refer to metacyclic trypomastigotes.
Fig 3
Fig 3. UBP1mut knockdown parasites present normal infection and intracellular replication in mammalian cells.
A, Representative photographs of infected cells with wildtype metacyclic trypomastigotes (WT), derived from epimastigotes transfected with spCas9-GFP or UBP1mut-KD. DAPI staining (in blue), TcUBP1 expression (anti-RRM signal in red). The images were taken four days after the infection. B, Quantification of number of infected cells obtained after 12 h from infections carried out with metacyclic trypomastigotes derived from spCas9-GFP or UBP1mut-KD samples (in percentage). C, Quantification of intracellular amastigotes obtained after 12 h from infections carried out in B (in amastigotes/cell). The values are expressed as the means of three independent experiments with the corresponding standard deviation bars (Student’s t-test, p value > 0.05).
Fig 4
Fig 4. Hierarchical clustering of genes in OE, KD and WT samples defined by DESeq2.
A, PCA plot displaying all 9 samples along PC1 and PC2, which describe 93% and 4% of the variability, respectively, within the expression data set. PC analysis was applied to normalized (reads per kb of transcript per million mapped reads) and log-transformed count data. B, Heatmap and complete linkage clustering using all replicates per group, 1,230 significant genes with |log2 fold change | > 1 were clustered. Groups on the vertical represent clustered genes based on gene expression with an FDR-adjusted p value lower than 0.05, the horizontal line represents a single gene and the color of the line indicates the gene expression. The Z-score scale bar represents relative expression +/- SD from the mean. C, volcano plot showing the differential expression analysis of genes in UBP1mut-KD and WT parasites. Tomato and cyan dots show nonsignificant and significant DEGs, respectively. D, Four-quadrant scatter plot showing the log2 fold change values in UBP1-OE (y axis) versus UBP1mut-KD (x axis). Quadrants Q2 and Q4 exhibit consistent gene profiles, as discussed in the text. Tomato and cyan dots show nonsignificant and significant DEGs, respectively.
Fig 5
Fig 5. Transcripts whose abundance directly responds to TcUBP1 expression levels.
A, Venn diagrams showing the number of genes two times affected in each condition (OE and KD) with respect to the WT control (|log2 fold change| >1). In green, upregulated genes; in light red, downregulated genes; in orange, robust genes regulated in a coordinated way (mRNA abundance increased in one condition and decreased in the other). B, Left, spaghetti plots showing fold enrichment of expression relative to the control sample of those genes whose abundance increases in epimastigotes KD and decreases in parasites overexpressing UBP1 (OE). Right, vice versa. The complete gene IDs and names of the genes are shown in Table 1. The pointed line marks a difference of ± 2X.
Fig 6
Fig 6. GO enrichment analysis of genes oppositely regulated in UBP1-OE and KD parasites.
GO classification of DEGs using a criterion of at least 1.5-fold change (|log2 fold change| > 0.58); the graphs show up to 5 GO terms with most genes annotated. BP, CC and MF charts indicated GO terms clustered in the biological process, cellular component and molecular function terms, respectively. The size of the dots diameter indicates the number of genes; color depth indicates significance; abscissa indicates enrichment; and the ordinate indicates different pathways. A, 185 genes putatively augmented by TcUBP1: upregulated in OE and downregulated in KD samples. B, 38 genes putatively diminished by TcUBP1: upregulated in KD and downregulated in OE samples.
Fig 7
Fig 7. Violin plots displaying the expression distribution of the genes within 11 different functional categories in the OE or KD transcriptomes relative to the WT control (log2 fold change, FDR-adjusted p value < 10%).
Categories in the figure are indicated at the top of each panel. Student’s t-test, * p value < 0.05,** p value < 0.01,*** p value < 0.001.
Fig 8
Fig 8. Bar charts displaying enrichment levels of transcripts encoding TcS and ribosomal proteins oppositely regulated by TcUBP1.
Genes from Tables 3 and 4 were identified as significant using an FDR-adjusted p value < 5%, or for a few TcS genes < 10%, in both the OE and the KD samples with respect to the control WT population. A, TcS cluster (n = 42). B, Ribosomal protein-coding cluster (n = 15). The expression differences of ±1.41, and ±2 times are marked with different pointed lines.
Fig 9
Fig 9. Comparison of UBP1-OE and UBP1mut-KD transcriptomes with distinct RNA-Seq datasets of T.
cruzi. A, heatmap representation of the percentages of shared genes between UBP1mut-KD and different pairwise comparisons. The brown/orange color indicates greater overlap, whereas the yellow color indicates less overlap. B, heatmap representation of the Pearson correlation between KD samples with different T. cruzi stages. C, heatmap representation of the Pearson correlation between OE and KD samples with different epimastigote stationary points: Se (early stationary, day 17 vs. 7), Si (intermediate stationary, day 21 vs. 7), Sf (final stationary, day 28 vs. 7), Sf vs. Si and Sf vs. Se. The red/orange color indicates a high correlation, whereas the blue/yellow color indicates a low correlation. D, principal component (PC) analysis plot displaying the same samples as in A, along PC1 and PC2, which describe 57% and 20% of the variability, respectively. PC analysis was applied to 681 genes with log2 fold change data for all the pairwise comparisons. E, Venn diagrams of Se, Si, Sf and UBP1-OE upregulated (left) and downregulated (right) genes. F, Venn diagrams of DEGs upregulated in Se, Si and Sf with UBP1mut-KD downregulated genes (left) and vice versa (right).

Similar articles

Cited by

References

    1. Radío S, Fort RS, Garat B, Sotelo-Silveira J, Smircich P. UTRme: A Scoring-Based Tool to Annotate Untranslated Regions in Trypanosomatid Genomes. Front Genet. 2018;9: 671. doi: 10.3389/fgene.2018.00671 - DOI - PMC - PubMed
    1. Smircich P, Forteza D, El-Sayed NM, Garat B. Genomic analysis of sequence-dependent DNA curvature in Leishmania. PLoS One. 2013;8: e63068. doi: 10.1371/journal.pone.0063068 - DOI - PMC - PubMed
    1. Callejas-Hernández F, Gutierrez-Nogues Á, Rastrojo A, Gironès N, Fresno M. Analysis of mRNA processing at whole transcriptome level, transcriptomic profile and genome sequence refinement of Trypanosoma cruzi. Sci Rep. 2019;9: 17376. doi: 10.1038/s41598-019-53924-6 - DOI - PMC - PubMed
    1. Barbosa RL, da Cunha JPC, Menezes AT, Melo R de FP, Elias MC, Silber AM, et al.. Proteomic analysis of Trypanosoma cruzi spliceosome complex. J Proteomics. 2020;223: 103822. doi: 10.1016/j.jprot.2020.103822 - DOI - PubMed
    1. Smircich P, Eastman G, Bispo S, Duhagon MA, Guerra-Slompo EP, Garat B, et al.. Ribosome profiling reveals translation control as a key mechanism generating differential gene expression in Trypanosoma cruzi. BMC Genomics. 2015;16: 443. doi: 10.1186/s12864-015-1563-8 - DOI - PMC - PubMed

Substances