. 2024 May 17;20(5):e1012124.
doi: 10.1371/journal.pcbi.1012124. eCollection 2024 May.

Real-time forecasting of COVID-19-related hospital strain in France using a non-Markovian mechanistic model

Affiliations

Real-time forecasting of COVID-19-related hospital strain in France using a non-Markovian mechanistic model

Alexander Massey et al. PLoS Comput Biol. .

Abstract

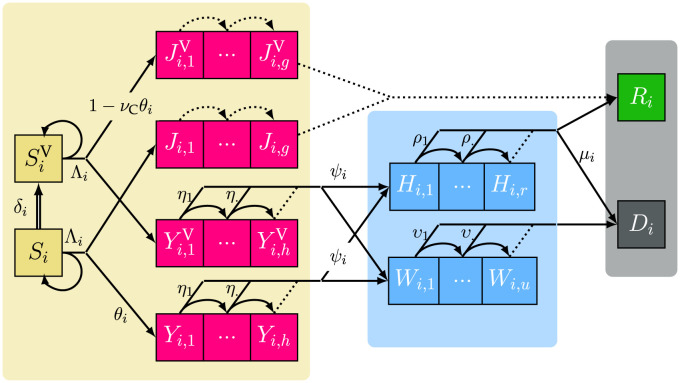
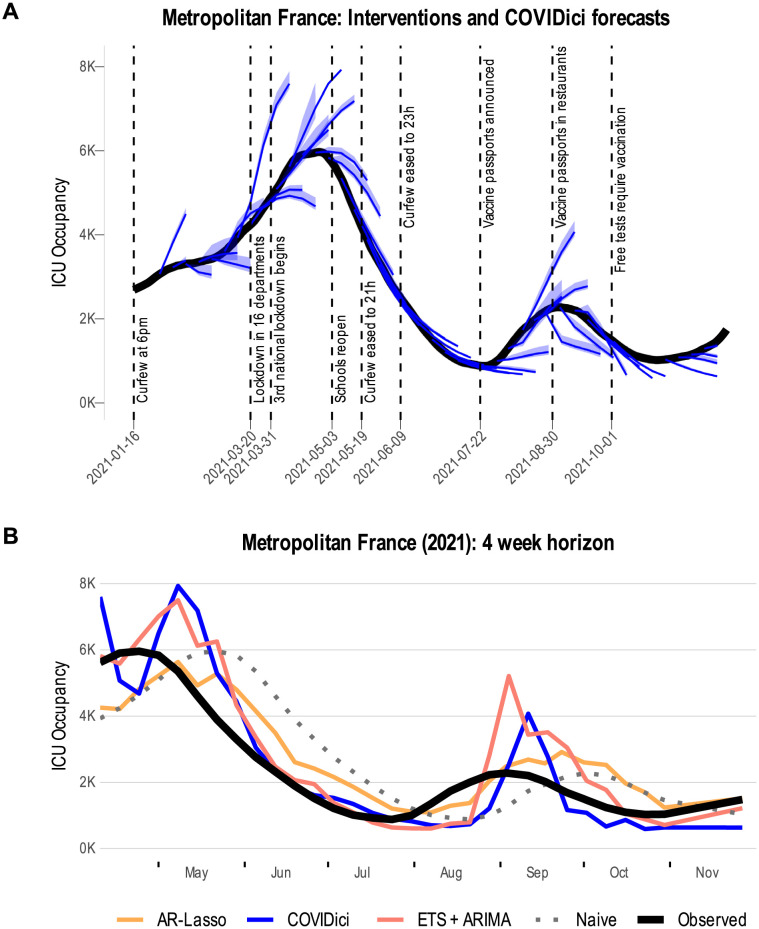
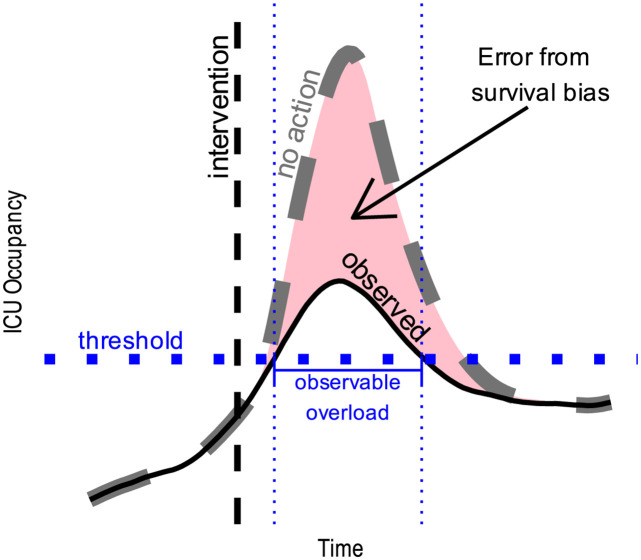
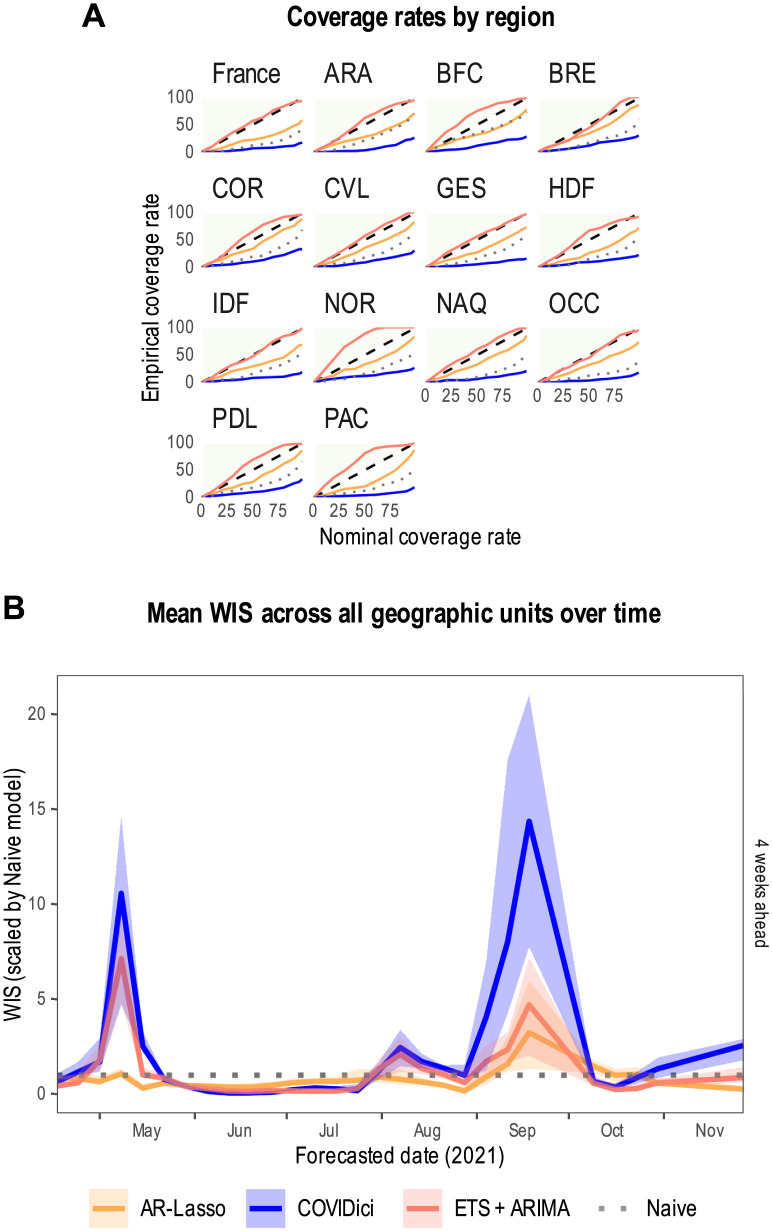
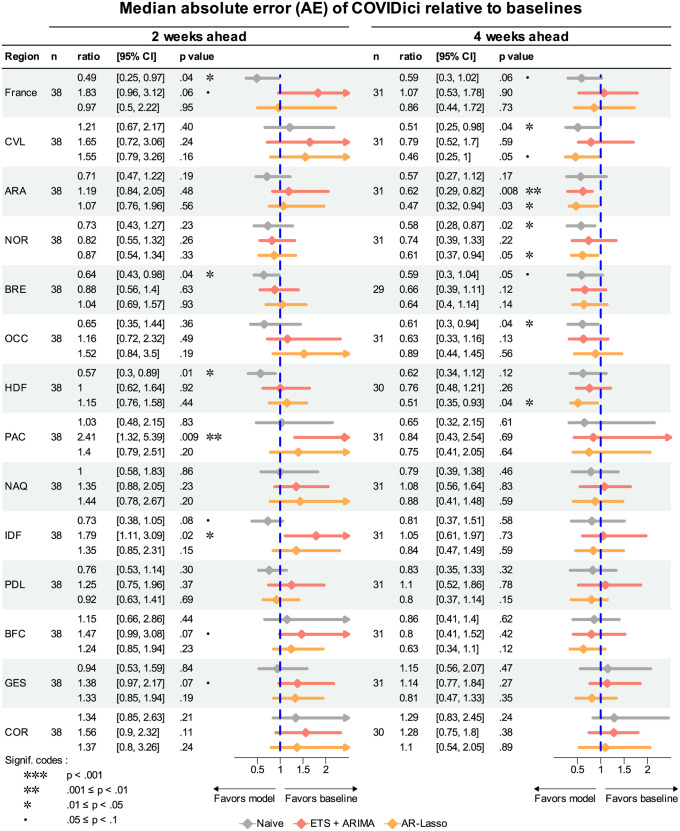
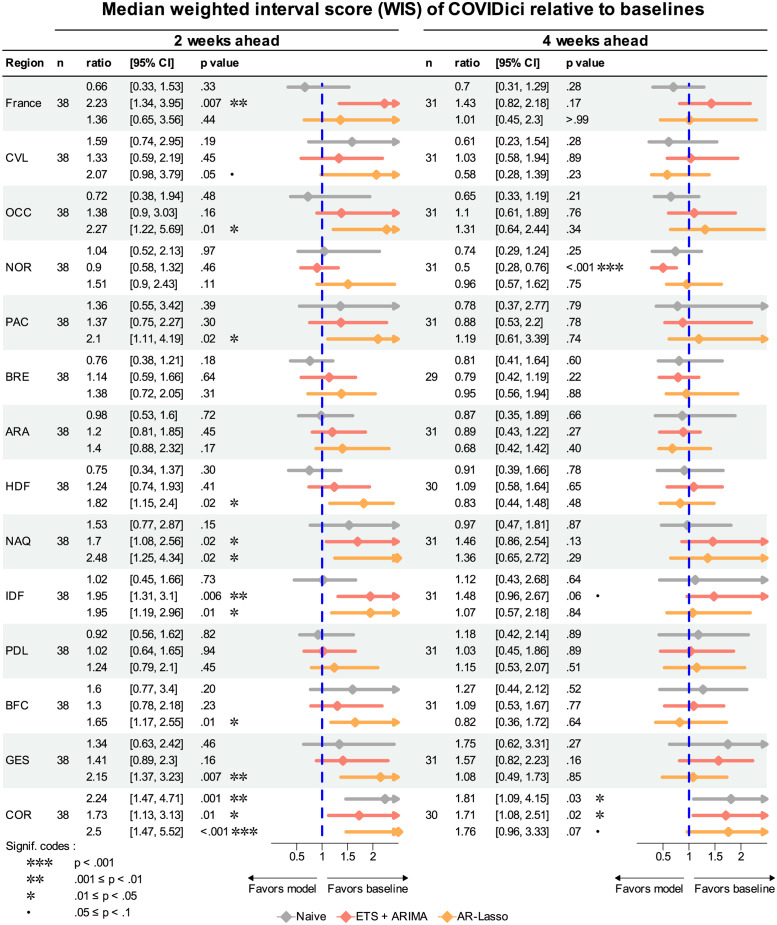
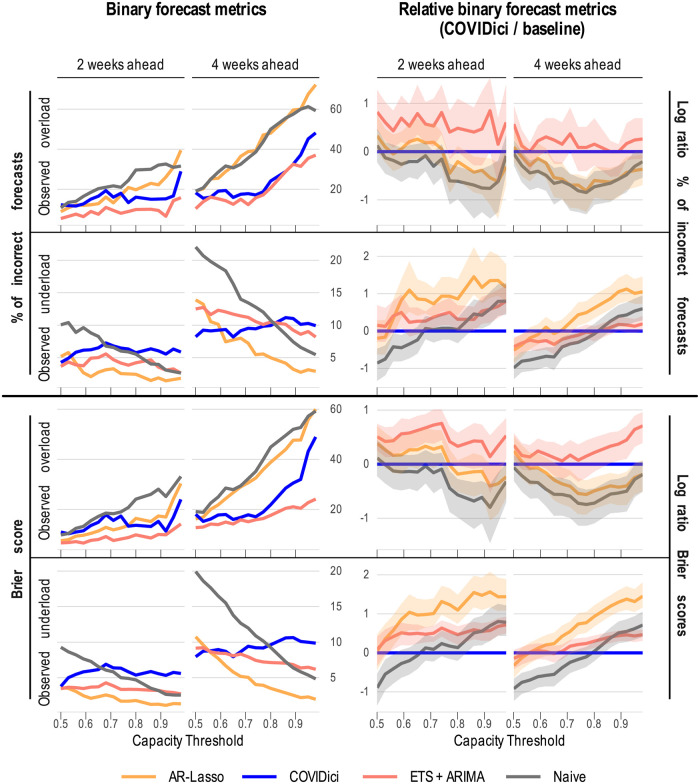
Projects such as the European Covid-19 Forecast Hub publish forecasts on the national level for new deaths, new cases, and hospital admissions, but not direct measurements of hospital strain like critical care bed occupancy at the sub-national level, which is of particular interest to health professionals for planning purposes. We present a sub-national French framework for forecasting hospital strain based on a non-Markovian compartmental model, its associated online visualisation tool and a retrospective evaluation of the real-time forecasts it provided from January to December 2021 by comparing to three baselines derived from standard statistical forecasting methods (a naive model, auto-regression, and an ensemble of exponential smoothing and ARIMA). In terms of median absolute error for forecasting critical care unit occupancy at the two-week horizon, our model only outperformed the naive baseline for 4 out of 14 geographical units and underperformed compared to the ensemble baseline for 5 of them at the 90% confidence level (n = 38). However, for the same level at the 4 week horizon, our model was never statistically outperformed for any unit despite outperforming the baselines 10 times spanning 7 out of 14 geographical units. This implies modest forecasting utility for longer horizons which may justify the application of non-Markovian compartmental models in the context of hospital-strain surveillance for future pandemics.


Conflict of interest statement

The authors have declared that no competing interests exist.

Figures

Fig 1
Fig 1. Structure of the underlying COVID-19 epidemic discrete time model with vaccination.
The three shaded areas represent the general population or community (left), the critically-ill hopitalised patients (center) and individuals removed by either recovery or death (right). The first subscript (i) of compartment densities (capital letters) indicates the age class, while the second denotes the time (in days) elapsed since the entry into the compartment—g, h, r, and u are thus the maximum number of days possible to remain in a compartment represented by contiguous boxes (see [21] for their computation). Individuals in S are susceptible, J are non-critically infectious, Y are infected and will eventually require hospitalisation, H are hospitalised in a critical care bed for a long stay, W are in non-ICU beds, R are recovered and D are deceased. SV, JV and YV are the vaccinated counterparts of S, J and Y. Λi is the daily force of infection (a probability). δi is the daily vaccination rate. μi, ψi, and θi are transition rates between compartments, the latter being reduced by the factor νC for vaccinated individuals. Arrows between boxes show the daily flow of individuals between compartments where dotted arrows occur with probability 1. For the sake of simplicity, only one age group is depicted here and only one of the two complementary probabilities is shown for each bifurcating transition.
Fig 2
Fig 2. Qualitative inspection of COVIDici forecasts.
A) Overlay of national forecasts of ICU occupancy produced by COVIDici with list of governmental interventions issued (national level only). B) All forecasters at the 4-week horizon plotted with the observed ICU occupancy for metropolitan France.
Fig 3
Fig 3. Artistic representation of the survivor bias that may occur after a restrictive governmental intervention.
The dashed curve is the counterfactual ICU occupancy that would have occurred if the intervention did not happen. The solid curve is the ICU occupancy that we observed because the intervention did occur.
Fig 4
Fig 4. Standard evaluation metrics for ICU occupancy.
A) Empirical coverage rate across all geographic units and forecast horizons (dashed line is optimal). Auvergne-Rhône-Alpes = ARA, Bourgogne-Franche-Comté = BFC, Bretagne = BRE, Centre-Val de Loire = CVL, Corse = COR, Grand Est = GES, Hauts-de-France = HDF, Île-de-France = IDF, Normandie = NOR, Nouvelle-Aquitaine = NAQ, Occitanie = OCC, Pays de la Loire = PDL, Provence-Alpes-Côte d’Azur = PAC. B) Mean weighted interval score (WIS) of all geographic units over time for the four-week forecast horizon scaled by the Naive model. Shaded areas represent 95% bias-corrected and accelerated (BCa) bootstrap confidence intervals with 10000 replicates per target date.
Fig 5
Fig 5. Median absolute error (AE) for COVIDici relative to other models.
Ratio = median AE for COVIDici / median AE for baseline model. 95% confidence interval (CI) is the bias-corrected and accelerated (BCa) bootstrap confidence interval generated by a nonparametric bootstrap with 10000 replicates. The p value is the smallest alpha such that 1 is not contained in the corresponding 1 − α CI. See Fig 4 for region code definitions.
Fig 6
Fig 6. Median weighted interval score of COVIDici relative to other models.
Ratio is the median weighted interval score (WIS) for COVIDici divided by median WIS using all other models as baselines. Each 95% confidence interval (CI) is based on the bias-corrected and accelerated (BCa) bootstrap confidence interval generated by nonparametric bootstrap with 10000 replicates. The p value is the smallest alpha such that 1 is not contained in the corresponding 1 − α CI. See Fig 4 for region code definitions.
Fig 7
Fig 7. Binary metrics for ICU occupancy overload by capacity threshold.
Metrics are conditioned separately for dates where ICU overload was observed or not observed respectively relative to arbitrary capacity thresholds. Thresholds are defined as a proportion of the peak ICU occupancy observed in a geographic unit. Shaded areas correspond to 95% bias-corrected and accelerated (BCa) confidence intervals based on 10000 replicates of a non-parametric bootstrap that assumes both spatial and temporal independence. Shaded areas completely below the blue line indicate that COVIDici statistically outperformed that model for that metric, threshold and forecast horizon.

Similar articles

  • How New Mexico Leveraged a COVID-19 Case Forecasting Model to Preemptively Address the Health Care Needs of the State: Quantitative Analysis.
    Castro LA, Shelley CD, Osthus D, Michaud I, Mitchell J, Manore CA, Del Valle SY. Castro LA, et al. JMIR Public Health Surveill. 2021 Jun 9;7(6):e27888. doi: 10.2196/27888. JMIR Public Health Surveill. 2021. PMID: 34003763 Free PMC article.
  • Predictive performance of multi-model ensemble forecasts of COVID-19 across European nations.
    Sherratt K, Gruson H, Grah R, Johnson H, Niehus R, Prasse B, Sandmann F, Deuschel J, Wolffram D, Abbott S, Ullrich A, Gibson G, Ray EL, Reich NG, Sheldon D, Wang Y, Wattanachit N, Wang L, Trnka J, Obozinski G, Sun T, Thanou D, Pottier L, Krymova E, Meinke JH, Barbarossa MV, Leithauser N, Mohring J, Schneider J, Wlazlo J, Fuhrmann J, Lange B, Rodiah I, Baccam P, Gurung H, Stage S, Suchoski B, Budzinski J, Walraven R, Villanueva I, Tucek V, Smid M, Zajicek M, Perez Alvarez C, Reina B, Bosse NI, Meakin SR, Castro L, Fairchild G, Michaud I, Osthus D, Alaimo Di Loro P, Maruotti A, Eclerova V, Kraus A, Kraus D, Pribylova L, Dimitris B, Li ML, Saksham S, Dehning J, Mohr S, Priesemann V, Redlarski G, Bejar B, Ardenghi G, Parolini N, Ziarelli G, Bock W, Heyder S, Hotz T, Singh DE, Guzman-Merino M, Aznarte JL, Morina D, Alonso S, Alvarez E, Lopez D, Prats C, Burgard JP, Rodloff A, Zimmermann T, Kuhlmann A, Zibert J, Pennoni F, Divino F, Catala M, Lovison G, Giudici P, Tarantino B, Bartolucci F, Jona Lasinio G, Mingione M, Farcomeni A, Srivastava A, Montero-Manso P, Adiga A, Hurt B, Lewis B, Marathe M, Porebski P, Venkatramanan S, Bartczuk RP, Dreger F, Gambin A, Gogolewski K, Gruziel-Slomka… See abstract for full author list ➔ Sherratt K, et al. Elife. 2023 Apr 21;12:e81916. doi: 10.7554/eLife.81916. Elife. 2023. PMID: 37083521 Free PMC article.
  • Forecasting COVID-19, influenza, and RSV hospitalizations over winter 2023-4 in England.
    Mellor J, Tang ML, Jones O, Ward T, Riley S, Deeny SR. Mellor J, et al. Int J Epidemiol. 2025 Apr 12;54(3):dyaf066. doi: 10.1093/ije/dyaf066. Int J Epidemiol. 2025. PMID: 40468743
  • Comparative assessment of methods for short-term forecasts of COVID-19 hospital admissions in England at the local level.
    Meakin S, Abbott S, Bosse N, Munday J, Gruson H, Hellewell J, Sherratt K; CMMID COVID-19 Working Group; Funk S. Meakin S, et al. BMC Med. 2022 Feb 21;20(1):86. doi: 10.1186/s12916-022-02271-x. BMC Med. 2022. PMID: 35184736 Free PMC article.
  • Challenges of COVID-19 Case Forecasting in the US, 2020-2021.
    Lopez VK, Cramer EY, Pagano R, Drake JM, O'Dea EB, Adee M, Ayer T, Chhatwal J, Dalgic OO, Ladd MA, Linas BP, Mueller PP, Xiao J, Bracher J, Castro Rivadeneira AJ, Gerding A, Gneiting T, Huang Y, Jayawardena D, Kanji AH, Le K, Mühlemann A, Niemi J, Ray EL, Stark A, Wang Y, Wattanachit N, Zorn MW, Pei S, Shaman J, Yamana TK, Tarasewicz SR, Wilson DJ, Baccam S, Gurung H, Stage S, Suchoski B, Gao L, Gu Z, Kim M, Li X, Wang G, Wang L, Wang Y, Yu S, Gardner L, Jindal S, Marshall M, Nixon K, Dent J, Hill AL, Kaminsky J, Lee EC, Lemaitre JC, Lessler J, Smith CP, Truelove S, Kinsey M, Mullany LC, Rainwater-Lovett K, Shin L, Tallaksen K, Wilson S, Karlen D, Castro L, Fairchild G, Michaud I, Osthus D, Bian J, Cao W, Gao Z, Lavista Ferres J, Li C, Liu TY, Xie X, Zhang S, Zheng S, Chinazzi M, Davis JT, Mu K, Pastore Y Piontti A, Vespignani A, Xiong X, Walraven R, Chen J, Gu Q, Wang L, Xu P, Zhang W, Zou D, Gibson GC, Sheldon D, Srivastava A, Adiga A, Hurt B, Kaur G, Lewis B, Marathe M, Peddireddy AS, Porebski P, Venkatramanan S, Wang L, Prasad PV, Walker JW, Webber AE, Slayton RB, Biggerstaff M, Reich NG, Johansson MA. Lopez VK, et al. PLoS Comput Biol. 2024 May 6;20(5):e1011200. doi: 10.1371/journal.pcbi.1011200. eCollection 2024 May. PLoS Comput Biol. 2024. PMID: 38709852 Free PMC article.

Cited by

References

    1. Becker AD, Grantz KH, Hegde ST, Bérubé S, Cummings DAT, Wesolowski A. Development and dissemination of infectious disease dynamic transmission models during the COVID-19 pandemic: what can we learn from other pathogens and how can we move forward? Lancet Digit Health. 2021;3(1):e41–e50. doi: 10.1016/S2589-7500(20)30268-5 - DOI - PMC - PubMed
    1. Brooks-Pollock E, Danon L, Jombart T, Pellis L. Modelling that shaped the early COVID-19 pandemic response in the UK. Philos Trans R Soc Lond B Biol Sci. 2021;376(1829):20210001. doi: 10.1098/rstb.2021.0001 - DOI - PMC - PubMed
    1. Cramer EY, Huang Y, Wang Y, Ray EL, Cornell M, Bracher J, et al.. The United States COVID-19 Forecast Hub dataset. Sci Data. 2022;9:462. doi: 10.1038/s41597-022-01517-w - DOI - PMC - PubMed
    1. Bracher J, Wolffram D, Deuschel J, Görgen K, Ketterer JL, Ullrich A, et al.. A pre-registered short-term forecasting study of COVID-19 in Germany and Poland during the second wave. Nat Commun. 2021;12:5173. doi: 10.1038/s41467-021-25207-0 - DOI - PMC - PubMed
    1. Sherratt K, Gruson H, Grah R, Johnson H, Niehus R, Prasse B, et al.. Predictive performance of multi-model ensemble forecasts of COVID-19 across European nations. eLife. 2023;12:e81916. doi: 10.7554/eLife.81916 - DOI - PMC - PubMed

MeSH terms