. 2024 Jun 1;41(6):msae097.
doi: 10.1093/molbev/msae097.

Connecting Species-Specific Extents of Genome Reduction in Mitochondria and Plastids

Affiliations

Connecting Species-Specific Extents of Genome Reduction in Mitochondria and Plastids

Konstantinos Giannakis et al. Mol Biol Evol. .

Abstract

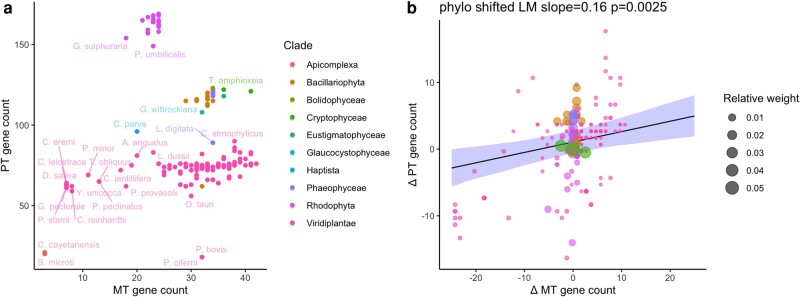
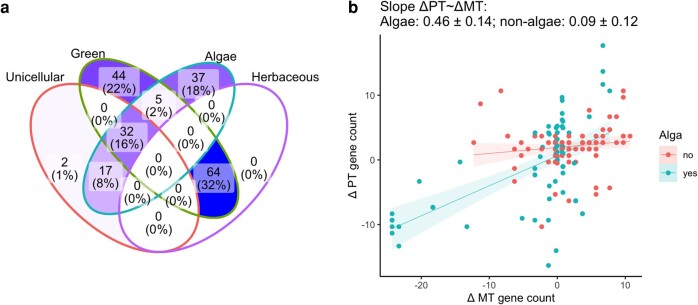
Mitochondria and plastids have both dramatically reduced their genomes since the endosymbiotic events that created them. The similarities and differences in the evolution of the two organelle genome types have been the target of discussion and investigation for decades. Ongoing work has suggested that similar mechanisms may modulate the reductive evolution of the two organelles in a given species, but quantitative data and statistical analyses exploring this picture remain limited outside of some specific cases like parasitism. Here, we use cross-eukaryote organelle genome data to explore evidence for coevolution of mitochondrial and plastid genome reduction. Controlling for differences between clades and pseudoreplication due to relatedness, we find that extents of mtDNA and ptDNA gene retention are related to each other across taxa, in a generally positive correlation that appears to differ quantitatively across eukaryotes, for example, between algal and nonalgal species. We find limited evidence for coevolution of specific mtDNA and ptDNA gene pairs, suggesting that the similarities between the two organelle types may be due mainly to independent responses to consistent evolutionary drivers.

Keywords: chloroplasts; genome evolution; mitochondria; organelle DNA; phylogenetic comparison.


Figures

Fig. 1.
Fig. 1.
MT and PT gene counts across eukaryotes. a) Raw protein-coding oDNA gene counts across species in our dataset, labeled by basal eukaryotic clade. Some species are labeled for illustration. b) oDNA differences from the mean value for the species’ clade (ΔMT and ΔPT). Size of points in (b) is an illustration of their weighting in PLM: the inverse of the sum of their associated row in the variance–covariance matrix, reflecting a species’ relatedness to other members of the dataset. Sets of closely related species provide less independent information and so have a lower weighting. A PLM fit suggests a significant (P = 0.0025) relationship between ΔMT and ΔPT, also found in a linear mixed model for raw oDNA counts (supplementary fig. S1, Supplementary Material online).
Fig. 2.
Fig. 2.
Species from different ecological categories in our dataset exploring the ΔMT–ΔPT relationship. a) Summary of different ecological classes of organism in the dataset. Numbers (and shading) give counts of species occupying each set of categories; percentages are the proportion of the total dataset. The two unicellular species that occupy no other sets are Apicomplexans. The herbaceous category is not applicable to algae or unicellular organisms. b) ΔMT–ΔPT for organisms labeled as algae and organisms not labeled as algae. Statistically robust differences in MT–PT behavior were not found for other arrangements of the features in (a).
Fig. 3.
Fig. 3.
Limited evidence for gene–gene relationships across organelle types. a) Hierarchical clustering of gene retention profiles in our dataset (supplementary fig. S2, Supplementary Material online) produces a tree of relationships between genes, so that genes with similar retention profiles across species are the most “related”. Closest relatives in this tree are generally genes from the same compartment (MT or PT). b) Oncotree analysis (Szabo and Boucher 2008) of dependencies in MT–PT evolution. This analysis infers relationships between features in progressive processes (here, gene loss from oDNA), producing a tree where nodes higher on a branch are inferred to be lost before nodes lower on that branch. The tree here mainly shows gene–gene relationships within an organelle type. Some MT genes (top, left of center) precede a collection of PT genes, but the majority of genes cluster exclusively by organelle type.

Similar articles

Cited by

References

    1. Ahyong S, Boyko CB, Bailly N, Bernot J, Bieler R, Brandão SN, Daly M, De Grave S, Gofas S, Hernandez F, et al. 2023. World Register of Marine Species (WoRMS). WoRMS Editorial Board. [accessed 2023 Sep]. https://www.marinespecies.org.
    1. Allen JF. Why chloroplasts and mitochondria retain their own genomes and genetic systems: colocation for redox regulation of gene expression. Proc Natl Acad Sci U S A. 2015:112(33):10231–10238. 10.1073/pnas.1500012112. - DOI - PMC - PubMed
    1. Allen JF, Martin WF. Why have organelles retained genomes? Cell Syst. 2016:2(2):70–72. 10.1016/j.cels.2016.02.007. - DOI - PubMed
    1. Barbrook AC, Howe CJ, Purton S. Why are plastid genomes retained in non-photosynthetic organisms? Trends Plant Sci. 2006:11(2):101–108. 10.1016/j.tplants.2005.12.004. - DOI - PubMed
    1. Bates D, Mächler M, Bolker B, Walker S. Fitting linear mixed-effects models using lme4. J Stat Softw. 2015:67(1):1–48. 10.18637/jss.v067.i01. - DOI

Substances