

Assessment of Gray Matter Microstructural Alterations in Alzheimer's Disease by Free Water Imaging
- PMID: 38759008
- PMCID: PMC11191448
- DOI: 10.3233/JAD-231416
Assessment of Gray Matter Microstructural Alterations in Alzheimer's Disease by Free Water Imaging
Abstract
Background: Cortical neurodegenerative processes may precede the emergence of disease symptoms in patients with Alzheimer's disease (AD) by many years. No study has evaluated the free water of patients with AD using gray matter-based spatial statistics.
Objective: The aim of this study was to explore cortical microstructural changes within the gray matter in AD by using free water imaging with gray matter-based spatial statistics.
Methods: Seventy-one participants underwent multi-shell diffusion magnetic resonance imaging, 11C-Pittsburgh compound B positron emission tomography, and neuropsychological evaluations. The patients were divided into two groups: healthy controls (n = 40) and the AD spectrum group (n = 31). Differences between the groups were analyzed using voxel-based morphometry, diffusion tensor imaging, and free water imaging with gray matter-based spatial statistics.
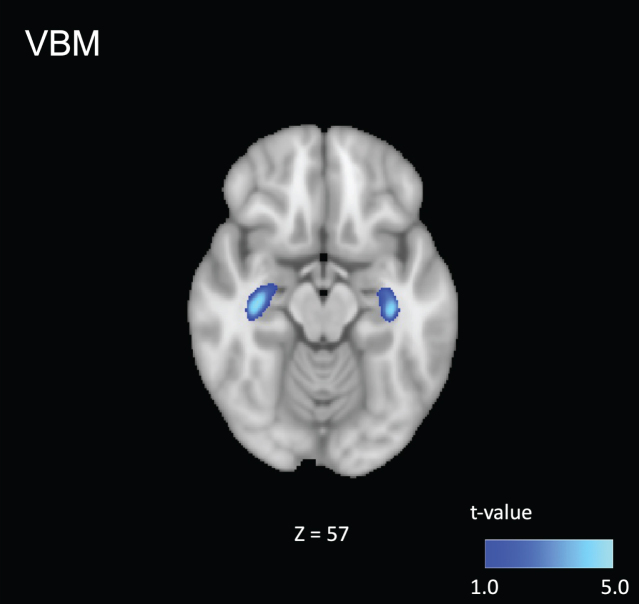
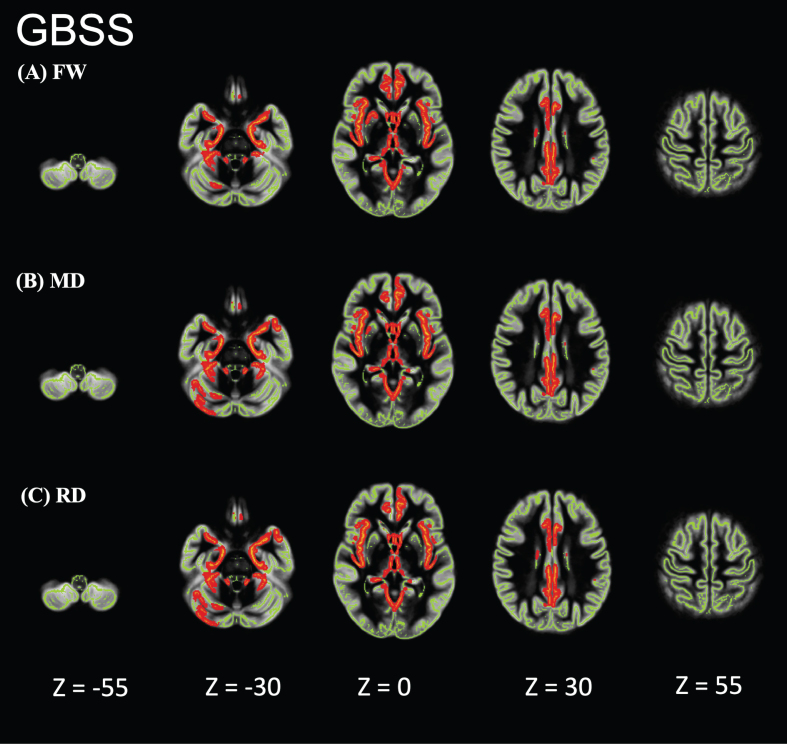
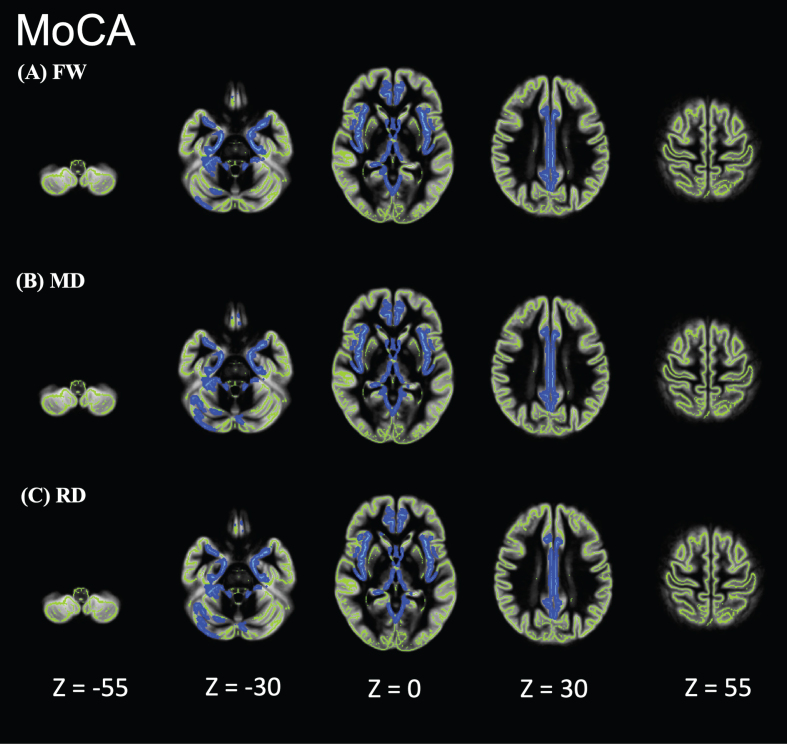
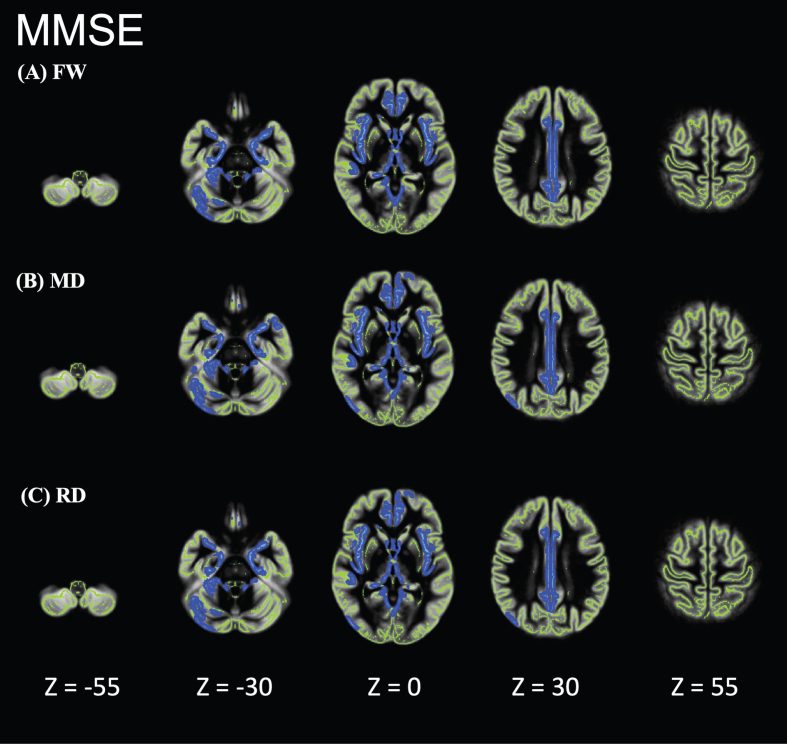
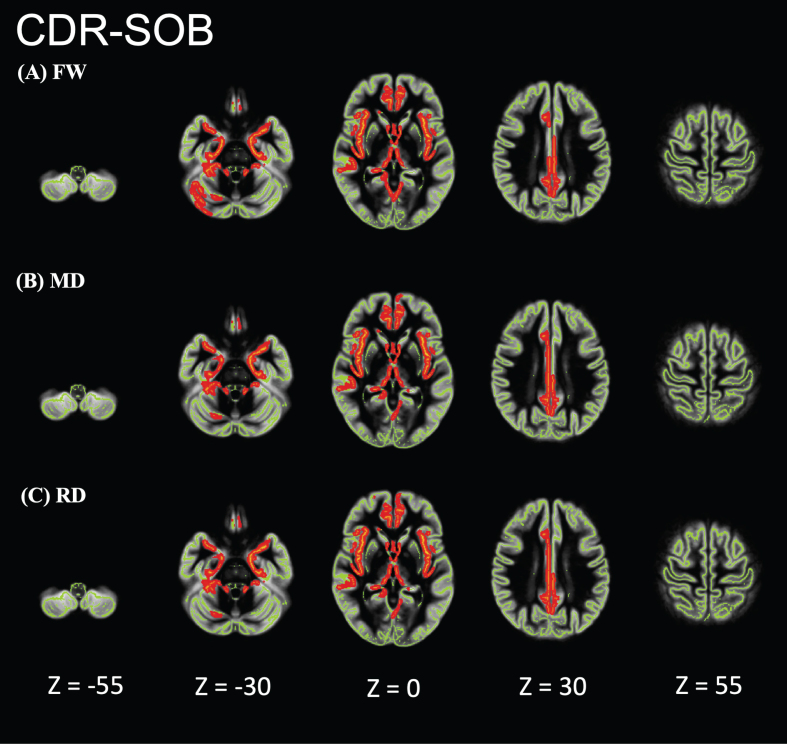
Results: Voxel-based morphometry analysis revealed gray matter volume loss in the hippocampus of patients with AD spectrum compared to that in controls. Furthermore, patients with AD spectrum exhibited significantly greater free water, mean diffusivity, and radial diffusivity in the limbic areas, precuneus, frontal lobe, temporal lobe, right putamen, and cerebellum than did the healthy controls. Overall, the effect sizes of free water were greater than those of mean diffusivity and radial diffusivity, and the larger effect sizes of free water were thought to be strongly correlated with AD pathology.
Conclusions: This study demonstrates the utility of applying voxel-based morphometry, gray matter-based spatial statistics, free water imaging and diffusion tensor imaging to assess AD pathology and detect changes in gray matter.
Keywords: 11C-Pittsburgh compound B PET; Alzheimer’s disease; diffusion tensor imaging; free water imaging; gray matter-based spatial statistics; voxel-based morphometry.
Conflict of interest statement
The authors have no conflict of interest to report.
Figures
Similar articles
-
Associations between white matter microstructure and amyloid burden in preclinical Alzheimer's disease: A multimodal imaging investigation.Neuroimage Clin. 2014 Feb 19;4:604-14. doi: 10.1016/j.nicl.2014.02.001. eCollection 2014. Neuroimage Clin. 2014. PMID: 24936411 Free PMC article.
-
The Neuropsychological Correlates of Brain Perfusion and Gray Matter Volume in Alzheimer's Disease.J Alzheimers Dis. 2020;78(4):1639-1652. doi: 10.3233/JAD-200676. J Alzheimers Dis. 2020. PMID: 33185599
-
Diffusion Imaging of Gray Matter Microstructure in Alzheimer's Disease.J Alzheimers Dis. 2024;101(2):437-439. doi: 10.3233/JAD-240673. J Alzheimers Dis. 2024. PMID: 39213077
-
The role of diffusion tensor imaging in detecting microstructural changes in prodromal Alzheimer's disease.CNS Neurosci Ther. 2014 Jan;20(1):3-9. doi: 10.1111/cns.12166. Epub 2013 Dec 12. CNS Neurosci Ther. 2014. PMID: 24330534 Free PMC article. Review.
-
Staging Alzheimer's disease progression with multimodality neuroimaging.Prog Neurobiol. 2011 Dec;95(4):535-46. doi: 10.1016/j.pneurobio.2011.06.004. Epub 2011 Jun 22. Prog Neurobiol. 2011. PMID: 21718750 Free PMC article. Review.
Cited by
-
Cortical Diffusivity, a Biomarker for Early Neuronal Damage, Is Associated with Amyloid-β Deposition: A Pilot Study.Cells. 2025 Jan 21;14(3):155. doi: 10.3390/cells14030155. Cells. 2025. PMID: 39936947 Free PMC article.
-
Imaging biomarkers of cortical neurodegeneration underlying cognitive impairment in Parkinson's disease.Eur J Nucl Med Mol Imaging. 2025 May;52(6):2002-2014. doi: 10.1007/s00259-025-07070-z. Epub 2025 Jan 31. Eur J Nucl Med Mol Imaging. 2025. PMID: 39888421 Free PMC article.
References
-
- de Toledo-Morrell L, Goncharova I, Dickerson B, Wilson RS, Bennett DA (2000) From healthy aging to early Alzheimer’s disease: In vivo detection of entorhinal cortex atrophy. Ann N Y Acad Sci 911, 240–253. - PubMed
-
- Pascoal TA, Mathotaarachchi S, Mohades S, Benedet AL, Chung C-O, Shin M, Wang S, Beaudry T, Kang MS, Soucy J-P, Labbe A, Gauthier S, Rosa-Neto P (2017) Amyloid-β and hyperphosphorylated tau synergy drives metabolic decline in preclinical Alzheimer’s disease. Mol Psychiatry 22, 306–311. - PMC - PubMed
-
- Villemagne VL, Burnham S, Bourgeat P, Brown B, Ellis KA, Salvado O, Szoeke C, Macaulay SL, Martins R, Maruff P, Ames D, Rowe CC, Masters CL, Australian Imaging Biomarkers and Lifestyle (AIBL) Research Group (2013) Amyloid β deposition, neurodegeneration, and cognitive decline in sporadic Alzheimer’s disease: A prospective cohort study. Lancet Neurol 12, 357–367. - PubMed
MeSH terms
Substances
LinkOut - more resources
Full Text Sources
Medical
