. 2024 May 16;84(10):1842-1854.e7.
doi: 10.1016/j.molcel.2024.04.013.

Genomic context sensitizes regulatory elements to genetic disruption

Affiliations

Genomic context sensitizes regulatory elements to genetic disruption

Raquel Ordoñez et al. Mol Cell. .

Abstract

Genomic context critically modulates regulatory function but is difficult to manipulate systematically. The murine insulin-like growth factor 2 (Igf2)/H19 locus is a paradigmatic model of enhancer selectivity, whereby CTCF occupancy at an imprinting control region directs downstream enhancers to activate either H19 or Igf2. We used synthetic regulatory genomics to repeatedly replace the native locus with 157-kb payloads, and we systematically dissected its architecture. Enhancer deletion and ectopic delivery revealed previously uncharacterized long-range regulatory dependencies at the native locus. Exchanging the H19 enhancer cluster with the Sox2 locus control region (LCR) showed that the H19 enhancers relied on their native surroundings while the Sox2 LCR functioned autonomously. Analysis of regulatory DNA actuation across cell types revealed that these enhancer clusters typify broader classes of context sensitivity genome wide. These results show that unexpected dependencies influence even well-studied loci, and our approach permits large-scale manipulation of complete loci to investigate the relationship between regulatory architecture and function.

Keywords: enhancer selectivity; gene regulation; genetic engineering; genome writing; genomic regulatory architecture; synthetic regulatory genomics.


Conflict of interest statement

Declaration of interests R.B., J.D.B., and M.T.M. are listed as inventors on a patent application describing Big-IN. Jef Boeke is a founder and director of CDI Labs, Inc.; a founder of and consultant to Opentrons LabWorks/Neochromosome, Inc.; and serves (or served) on the scientific advisory board of the following: CZ Biohub New York, LLC; Logomix, Inc.; Modern Meadow, Inc.; Rome Therapeutics, Inc.; Sangamo, Inc.; Tessera Therapeutics, Inc.; and the Wyss Institute.

Figures

Figure 1.
Figure 1.. Engineering the Igf2/H19 locus
(A) Igf2/H19 locus in mESC and differentiated mesendodermal cells. DNase-seq tracks show activation of the enhancer cluster upon differentiation. Triangles indicate CTCF recognition sequence orientation. (B) Barrier model where CTCF occupancy at the imprinting control region (ICR) directs activity of the endogenous enhancer cluster towards H19 or Igf2,. (C) Schematic of engineering and delivery strategy. Payloads were assembled in yeast, amplified in bacteria, and delivered to mESCs using Big-IN. Multiple independent clones were systematically verified for correct genome engineering and differentiated into mesendodermal cells for further phenotyping. (D) Schematic of Igf2/H19 locus engineering using Big-IN. CpG mutations (methylation-insensitive ICR [MI-ICR]) or CTCF deletions (ΔCTCF-ICR) permit genetic control of CTCF occupancy. B6 or engineered variants in H19 and Igf2 genes permit allele-specific expression analysis. (E) Expression analysis of the engineered Igf2/H19 locus in mesendodermal cells. Schemes on the left represent each delivered payload. At right, each point represents the expression of the engineered H19 or Igf2 gene in an independent clone, measured using allele-specific qRT-PCR. Bars indicate median. Expression was normalized to Gapdh and then scaled between 0 (ΔIgf2/H19 locus) and 1 (“Full-length” rescue payloads), normalizing H19 to the “Full-length” payload with constitutive CTCF occupancy, and Igf2 to the “Full-length” payload with abolished CTCF occupancy (dashed lines). Payloads with both constitutive CTCF occupancy (orange hexagon) or abolished CTCF occupancy (empty hexagon) at the ICR were assessed.
Figure 2.
Figure 2.. Identification of long-range regulatory elements at the Igf2/H19 locus
(A) The Igf2/H19 locus and extended downstream region showing DNase-seq and CTCF CUT&RUN in mESC and differentiated mesendodermal cells. Triangles indicate CTCF recognition sequence orientation. “Full-length” and “ΔH19Enh at Igf2/H19” are repeated from Figure 1E for reference. (B) Expression analysis in mesendodermal cells of Igf2/H19 payloads when delivered to the Igf2/H19 locus, to a genomic safe harbor locus (Hprt), or to Igf2/H19 locus in conjunction with distal candidate enhancers deletions. Each point represents the expression of the engineered H19 or Igf2 in an independent clone using allele-specific qRT-PCR with bars indicating the median. First two rows are from Figure 1E. Expression was normalized to Gapdh and then scaled between 0 (ΔIgf2/H19 locus) and 1 (“Full-length” rescue payloads), normalizing H19 to the “Full-length” payload with constitutive CTCF occupancy, and Igf2 to the “Full-length” payload with abolished CTCF occupancy, which are also represented as dashed lines. Payloads with both constitutive CTCF occupancy (orange hexagon) or abolished CTCF occupancy (empty hexagon) at the ICR were assessed. (C) Contribution of the H19 enhancers and genomic context to H19 and Igf2 expression. Median expression for H19 and Igf2 was measured for constitutive or abolished CTCF occupancy, respectively. Error bars represent interquartile range. Dashed horizontal lines indicate expected expression under an additive model (bottom) and measured expression (top). See also Figure S7.
Figure 3.
Figure 3.. Enhancer interchangeability at the Igf2/H19 and Sox2 loci
(A) Sox2 and locus control region (LCR) showing DNase-seq and CTCF CUT&RUN in mESC and mesendodermal cells. Triangles indicate CTCF recognition sequence orientation. (B-C) Points represent independently engineered clones and bars indicate the median (B) Expression analysis in differentiated mesendodermal cells harboring payloads including the wild-type Sox2 locus, the Sox2 locus with the LCR replaced by the H19 enhancer cluster, and the Igf2/H19 locus with the Igf2 gene and promoter replaced by the Sox2 gene and promoter. Each payload was delivered both to the Sox2 locus (left) and Igf2/H19 locus (right). Expression of the engineered Sox2 allele was normalized to the wild-type CAST allele and then scaled between 0 (ΔSox2 locus) to 1 (“Sox2 & Sox2 LCR”), which are also represented as dashed lines. (C) Igf2 and H19 expression analysis in mESC engineered with a “Full-length” Igf2/H19 rescue payload, or payloads wherein the H19 enhancer was replaced by the Sox2 LCR in either orientation. Expression was normalized to Gapdh and then scaled between 0 (ΔIgf2/H19 locus) and 1 (“Full-length”), normalizing H19 to the “Full-length” payload with constitutive CTCF occupancy, and Igf2 to the “Full-length” payload with abolished CTCF occupancy. Payloads with both constitutive CTCF occupancy (orange hexagon) or abolished CTCF occupancy (empty hexagon) at the ICR were assessed. The dashed lines indicate basal expression of “ΔH19Enh” in mESCs and expression of “Full-length” Igf2/H19 rescue payload in differentiated mesendodermal cells. See also Figure S12.
Figure 4.
Figure 4.. Cross-cell type accessibility patterns reflect locus function
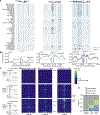
(A) Accessibility patterns at the Hprt, Sox2 and Igf2/H19 loci across 45 cell and tissue types, ordered by hierarchical clustering of genomic DHSs as in . Shading represents the Sox2 LCR and H19 enhancers. (B) Correlation of DHS accessibility across Hprt, Sox2 and Igf2/H19 loci. Each line represents the Pearson correlation coefficient (r) between the DHS located at the viewpoint with every other DHS in a 1-Mb window. Viewpoints are shaded in each plot. (C) Schematic representation of uncorrelated, independent and coordinated DHS clusters. Multiple regions of high Pearson r values indicate coordinated DHS activity potentially due to synchronized activation in specific tissues. Corr: Pearson correlation coefficient. (D) Heatmaps showing the Pearson correlation coefficient (r) between the DHS located at the viewpoint and the surrounding DHS within a 1-Mb window. Three different sets of viewpoints are represented: random DHSs, promoters of protein coding genes (±1 kb from TSS), and mESC super-enhancers (SE); each row portrays the region surrounding a different viewpoint. Rows are not shown to scale. DHS correlation patterns were grouped into uncorrelated, independent and coordinated based on the number of peaks exceeding r > 0.25. (E) Representation of DHSs correlation patterns for various genomic features. See also Figure S13.

Update of

References

    1. Thurman RE, Rynes E, Humbert R, Vierstra J, Maurano MT, Haugen E, Sheffield NC, Stergachis AB, Wang H, Vernot B, et al. (2012). The accessible chromatin landscape of the human genome. Nature 489, 75–82. 10.1038/nature11232. - DOI - PMC - PubMed
    1. Bergman DT, Jones TR, Liu V, Ray J, Jagoda E, Siraj L, Kang HY, Nasser J, Kane M, Rios A, et al. (2022). Compatibility rules of human enhancer and promoter sequences. Nature 607, 176–184. 10.1038/s41586-022-04877-w. - DOI - PMC - PubMed
    1. Martinez-Ara M, Comoglio F, van Arensbergen J, and van Steensel B (2022). Systematic analysis of intrinsic enhancer-promoter compatibility in the mouse genome. Mol Cell 82, 2519–2531.e6. 10.1016/j.molcel.2022.04.009. - DOI - PMC - PubMed
    1. Peterson KR, and Stamatoyannopoulos G (1993). Role of gene order in developmental control of human gamma- and beta-globin gene expression. Molecular and Cellular Biology 13, 4836–4843. - PMC - PubMed
    1. Zuin J, Roth G, Zhan Y, Cramard J, Redolfi J, Piskadlo E, Mach P, Kryzhanovska M, Tihanyi G, Kohler H, et al. (2022). Nonlinear control of transcription through enhancer-promoter interactions. Nature 604, 571–577. 10.1038/s41586-022-04570-y. - DOI - PMC - PubMed

MeSH terms