. 2024 May 16;84(10):1904-1916.e7.
doi: 10.1016/j.molcel.2024.04.012.

Arginine deprivation enriches lung cancer proteomes with cysteine by inducing arginine-to-cysteine substitutants

Affiliations

Arginine deprivation enriches lung cancer proteomes with cysteine by inducing arginine-to-cysteine substitutants

Chao Yang et al. Mol Cell. .

Abstract

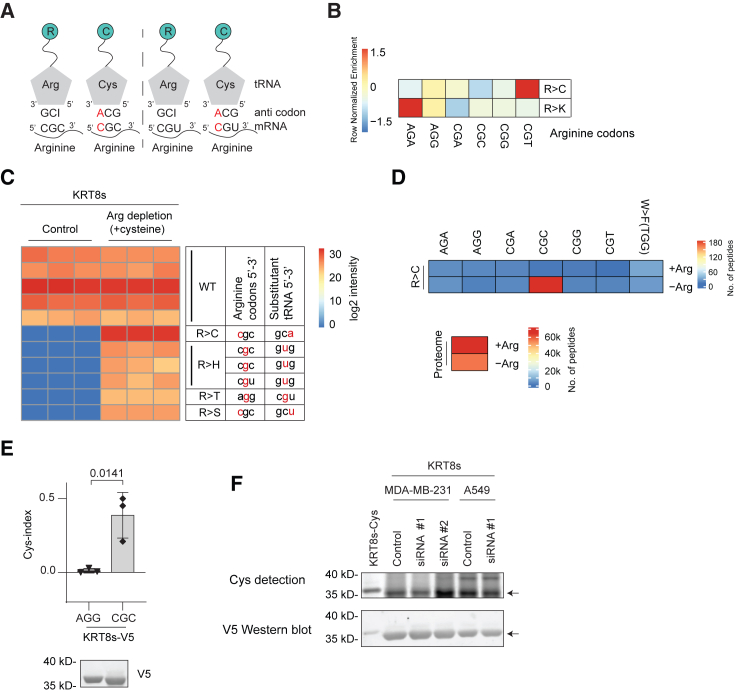
Many types of human cancers suppress the expression of argininosuccinate synthase 1 (ASS1), a rate-limiting enzyme for arginine production. Although dependency on exogenous arginine can be harnessed by arginine-deprivation therapies, the impact of ASS1 suppression on the quality of the tumor proteome is unknown. We therefore interrogated proteomes of cancer patients for arginine codon reassignments (substitutants) and surprisingly identified a strong enrichment for cysteine (R>C) in lung tumors specifically. Most R>C events did not coincide with genetically encoded R>C mutations but were likely products of tRNA misalignments. The expression of R>C substitutants was highly associated with oncogenic kelch-like epichlorohydrin (ECH)-associated protein 1 (KEAP1)-pathway mutations and suppressed by intact-KEAP1 in KEAP1-mutated cancer cells. Finally, functional interrogation indicated a key role for R>C substitutants in cell survival to cisplatin, suggesting that regulatory codon reassignments endow cancer cells with more resilience to stress. Thus, we present a mechanism for enriching lung cancer proteomes with cysteines that may affect therapeutic decisions.

Keywords: aberrant mRNA translation; amino acid shortage; arginine deprivation; chemotherapy; cysteine; ferroptosis; lung cancer; substitutants.


Conflict of interest statement

Declaration of interests The authors declare no competing interests.

Figures

None
Graphical abstract
Figure 1
Figure 1
Strong and specific enrichment of arginine-to-cysteine (R>C) substitutions in lung cancer (A) Heatmap depicting the cumulative number of arginine substitutions detected in proteomics datasets of nine human cancer types sourced from CPTAC. (B) Bar plot depicting log-fold enrichment in numbers of R>C substitutions in nine human cancer tissues. Vertical lines mark absolute levels of 1.5-fold differences. (C) Left: density plot depicting the number of samples of LSCC datasets (n = 207) where a particular arginine substitution is detected. R>C substitutions are depicted as a dark red line, while all other substitutions are depicted as black lines. The x axis denotes the number of samples, while the y axis denotes density. Right: the same analysis as left but for LUAD (n = 217) datasets. (D) A Venn diagram showing the overlap of the R>C substitutions found in the LSCC and LUAD datasets. (E) Bar plot depicting the frequency of R>C substitutions (R>C, gray) or the corresponding wild-type (WT) peptides associated with the detected R>C substitutions (R>C-WT, green) in LSCC and LUAD tumors only (first bar) or in every additional tumor across the 9 analyzed human cancer types. (F) As in (C) but for R>C substitutions (R>C, dark red) and WT peptides associated with R>C substitution peptides (R>C-WT, dark green). The LSCC and LUAD datasets are presented on the right and left, respectively.
Figure 2
Figure 2
Tumor enrichment of R>C substitutions in lung cancer (A) Box plot depicting the enrichment of R>C substitutants in adjacent normal tissues (ANT) and tumors in nine human cancer types. LSCC and LUAD tumors are plotted in dark red, other tumors are plotted in gray, and ANT is plotted in white. (B) Box plot depicting R>C enrichment (left), R>K enrichment (middle), and R>W enrichment (right) in ANT and tumors of the LSCC dataset.
Figure 3
Figure 3
R>C substitutions are substitutants induced by arginine depletion (A) A Venn diagram depicting the lack of overlap between the detected R>C substitutions in LSCC proteomes and the genetic mutations identified that lead to R>C mutants in LSCC genomes. The genetic mutations were sourced from the original analyzed study. (B) A scheme illustrating the biochemical assay we developed for detecting protein-incorporated cysteines. (C) Protein-incorporated cysteine assay was performed on cell populations expressing either KRT8s-V5 or KRT8s-Cys-V5. Cells were deprived of either arginine (Arg), tryptophan (Trp), and cystine (C2) for 3 days, as indicated. Anti-V5 immunoblot assessed reporter protein expression. (D) Quantification of protein-incorporated cysteine using Cys-index. The bar plot represents at least 3 independent experiments, and the p values were calculated by one-way ANOVA with Sidak’s multiple comparisons test. (E) Upper: a scheme depicting the reporter vectors used in this experiment. Lower: a representative protein-incorporated cysteine assay. (F) Cys-index of protein-incorporated cysteine experiments as presented in (E). The bar plot represents 2–6 independent experiments, and the p values were calculated by one-way ANOVA with Sidak’s multiple comparisons test.
Figure 4
Figure 4
R>C substitutants are produced by tRNA misalignments (A) A scheme illustrating the potential tRNA misalignment events leading to R>C substitutants. Inosine modification of tRNA-Arg can recognize both CGC and CGT codons. Human cells express only one type of tRNA-Cys (anticodon 5′-GCA-3′). The mismatch positions at both CGC and CGU codons are marked with red letters. (B) Heatmap depicting row-scaled enrichment of the percentile differences in the codon numbers over expected distribution. LSCC cancer proteomes were used for this analysis. (C) V5-IP/MS analysis of MDA-MB-231 cells containing a doxycycline-inducible KRT8s-V5 reporter vector. Heatmap indicates the intensities of peptides assigned to the reporter protein (WT) or R>X substitutants emerging following arginine depletion. R, arginine; C, cysteine; H, histidine; T threonine; and S, serine. The corresponding arginine-reporter codons of the detected substitutants are annotated. (D) Heatmap depicting the number of R>C substitutants detected specifically in MDA-MB-231 cells cultured with or without arginine (+Arg and −Arg, respectively) in the presence of cysteine. Only the peptides detected in three biological replicates (n = 3) of every condition were selected. (E) Cys-Index (upper panel) and immunoblot analyses (lower panel) of MDA-MB-231 cells expressing KRT8s-V5 reporters, where all their arginine codons were either mutated to AGG or CGC. Cells were treated with an arginine depletion medium supplemented with cysteine instead of C2. The bar plot represents 3 independent biological experiments, and the p value was calculated by one-way ANOVA with Sidak’s multiple comparisons test. (F) A protein-incorporated cysteine assay was performed on cells transfected with either control or siRNAs targeting RARS1. V5 immunoblot analysis was used to evaluate the levels of reporter proteins in the eluates. Immunoblot analysis validated the efficiency of RARS knockdowns (Figure S4G).
Figure 5
Figure 5
R>C substitutants in LSCC tumors are linked to ferroptosis protection and KEAP1 pathway mutations (A) Heatmap depicting average expression of ASS1 protein in adjacent normal tissue (ANT) and tumors across multiple cancer types. (B) Gene rank association plot depicting the correlation coefficients of protein expression levels with the number of R>C substitutants in the LSCC dataset. KEAP1 pathway regulatory genes, target genes, and control genes are highlighted. Vertical lines indicate an absolute cutoff used as 0.25. (C) A bar plot depicting the log10 adjusted p value of biological processes enriched for genes with a correlation coefficient >0.25 (from B). Ontology analysis was performed by EnrichR. (D) Same analysis as in (C) but for biological pathways. (E) Boxplot depicting the correlation coefficients of all ferroptosis genes (n = 40) protein expression with R>C enrichment in LSCC tumors. (F) Oxidative, metabolic, and oncogenic stresses activate NRF2, a transcription factor that controls iron metabolism genes (primarily Ferritin Light Chain [FTL], Ferritin Heavy Chain 1 [FTH1], and Heme Oxygenase 1 [HMOX1]) that induces protection from ferroptosis. KEAP1 and Cul3 genes form an E3 ligase complex restricting NRF2 levels and activity. Frequent mutations in KEAP1, Cul1, and NRF2 in lung cancer induce protection from ferroptosis. (G) Box plot depicting enrichment analysis of R>C substitutants with the expression of the hallmark ferroptosis genes—HMOX1, FTL, and FTH1. ACTB and IDO1 were used as controls. L denotes tumor samples with lower (<0) gene expression, while H denotes samples where higher (>0) gene expression in LSCC tumors. (H) Box plot depicts enrichment analysis of R>C or control R>W substitutants with mutations in either KEAP1, NRF2, and CUL3. Samples with PIK3CA and PTEN mutations were used as controls. “N” and “Y” mark the absence and presence of mutations, respectively. (I) Protein expression analysis of A549-KEAP1-WT vs. A549 control cells. (J) A representative protein-incorporated cysteine assay was performed with A549 control and KEAP1-WT overexpression cells. (K) Cys-Index analysis of (J). (L) Heat map depicting the number of R>C substitutants detected specifically in A549 and A549-KEAP1-WT cells cultured with or without arginine (Arg) in the presence of cysteine. Only the peptides detected in three biological replicates (n = 3) of every condition were selected. For reference, a heatmap of the total number of peptides detected in the normal proteome is plotted. (M) A bar plot depicting the relative intensity of R>C substitutants to normal proteome in A549 and A549-KEAP1 WT cells. (N) Cys-index analysis of A549 cells incubated with recombinant ADI protein at the indicated concentrations. Corresponding KEAP1 immunoblot is presented in Figure S5C. The bar plot represents 3–4 independent experiments, and the p values were calculated by one-way ANOVA with Sidak’s multiple comparisons test.
Figure 6
Figure 6
R>C substitutants enhance cellular resistance to chemotherapy (A) A scheme depicting the setup of the growth-competition assays. −R, Cy, and C2 depict arginine depletion and cysteine and C2 supplementation, respectively. (B) A dot plot depicting the percent difference in GFP/mCherry signal of MDA-MB-231 cells between 3 weeks and start. The dot plot represents 2–3 independent experiments, and the p values were calculated by one-way ANOVA with Sidak’s multiple comparisons test. (C) A dot plot depicting the percent difference in GFP/mCherry signal of A549 control and KEAP1-WT cells between 3 weeks and start. The dot plot represents 3 independent experiments, and the p values were calculated by one-way ANOVA with Sidak’s multiple comparisons test. (D) Cell survival experiment using MDA-MB-231 cells, as performed in Figure 6A. p values were calculated by one-way ANOVA with Sidak’s multiple comparisons test. (E) Cell survival experiment with A549 and A549-KEAP-WT cells. p values were calculated by one-way ANOVA with Sidak’s multiple comparisons test. (F) A scheme depicting growth-competition assays between cells overexpressing the indicated reporter vectors and control cells. (G) MDA-MB-231 cells containing either KRT8s(10K)-V5 (10K) or KRT8s(10C)-V5 (10C) reporters were treated as indicated and subjected to growth-competition assays as described above (Figure 6F). A reciprocal experiment is presented in Figure S6D. The dot plot represents 3 independent experiments, and the p values were calculated by one-way ANOVA with Sidak’s multiple comparisons test.
Figure 7
Figure 7
A model cell for arginine shortage benefits in lung cancer A model depicting the impact of arginine depletion on tumor proliferation, codon-dependent evolution, T cell activity, and resistance to chemotherapy by R>C.

References

    1. Lukey M.J., Katt W.P., Cerione R.A. Targeting amino acid metabolism for cancer therapy. Drug Discov. Today. 2017;22:796–804. doi: 10.1016/j.drudis.2016.12.003. - DOI - PMC - PubMed
    1. Ganjoo S., Gupta P., Corbali H.I., Nanez S., Riad T.S., Duong L.K., Barsoumian H.B., Masrorpour F., Jiang H., Welsh J.W., Cortez M.A. The role of tumor metabolism in modulating T-Cell activity and in optimizing immunotherapy. Front. Immunol. 2023;14 doi: 10.3389/fimmu.2023.1172931. - DOI - PMC - PubMed
    1. Siska P.J., Rathmell J.C. T cell metabolic fitness in antitumor immunity. Trends Immunol. 2015;36:257–264. doi: 10.1016/j.it.2015.02.007. - DOI - PMC - PubMed
    1. Nakaya M., Xiao Y., Zhou X., Chang J.H., Chang M., Cheng X., Blonska M., Lin X., Sun S.C. Inflammatory T cell responses rely on amino acid transporter ASCT2 facilitation of glutamine uptake and mTORC1 kinase activation. Immunity. 2014;40:692–705. doi: 10.1016/j.immuni.2014.04.007. - DOI - PMC - PubMed
    1. Lemos H., Huang L., Prendergast G.C., Mellor A.L. Immune control by amino acid catabolism during tumorigenesis and therapy. Nat. Rev. Cancer. 2019;19:162–175. doi: 10.1038/s41568-019-0106-z. - DOI - PubMed

MeSH terms

Substances