Review
. 2024 Jul:101:101273.
doi: 10.1016/j.preteyeres.2024.101273. Epub 2024 May 15.

Alzheimer's disease pathophysiology in the Retina

Affiliations
Review

Alzheimer's disease pathophysiology in the Retina

Bhakta Prasad Gaire et al. Prog Retin Eye Res. 2024 Jul.

Abstract

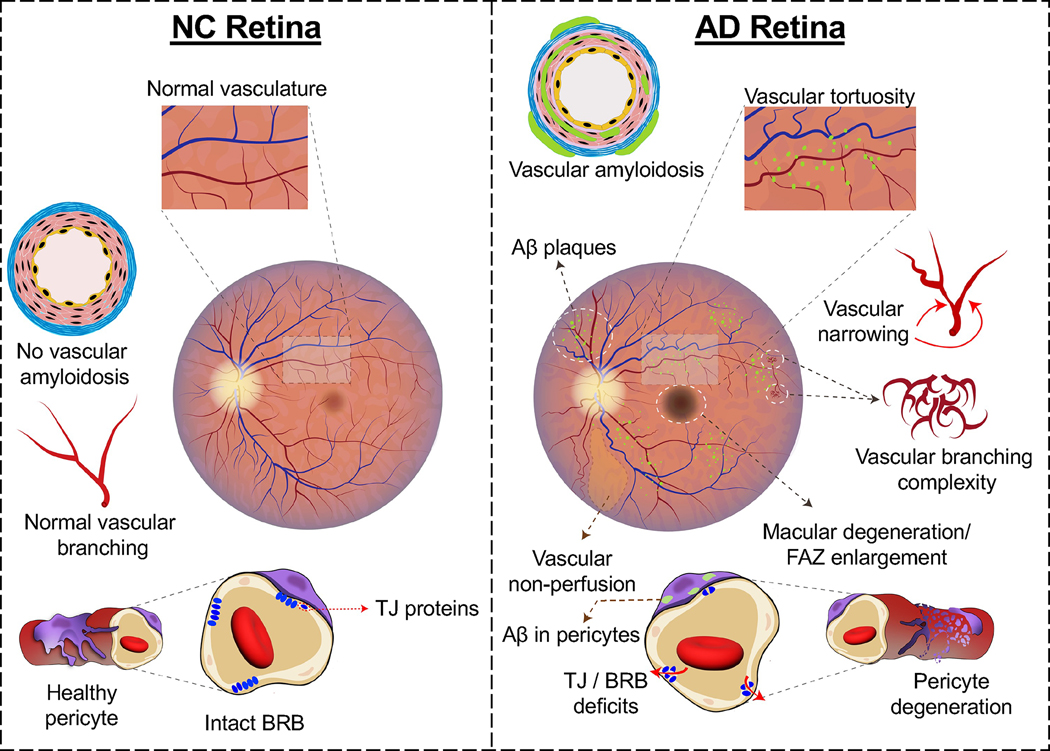
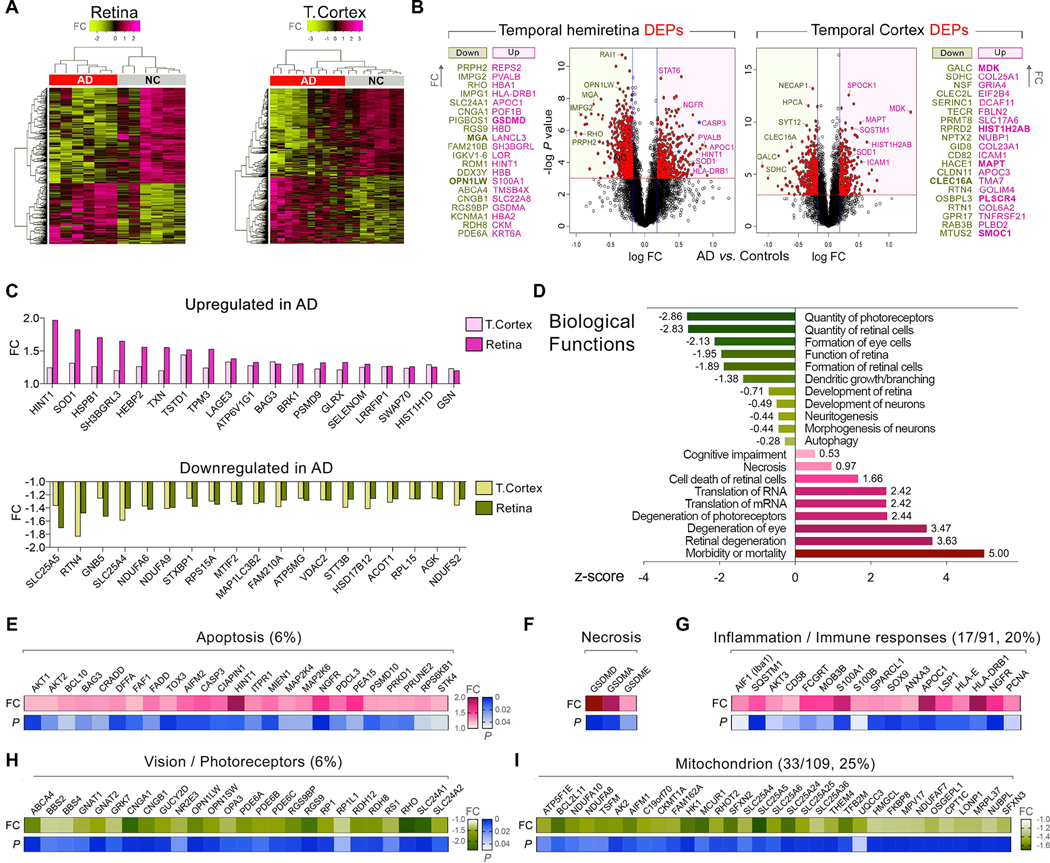
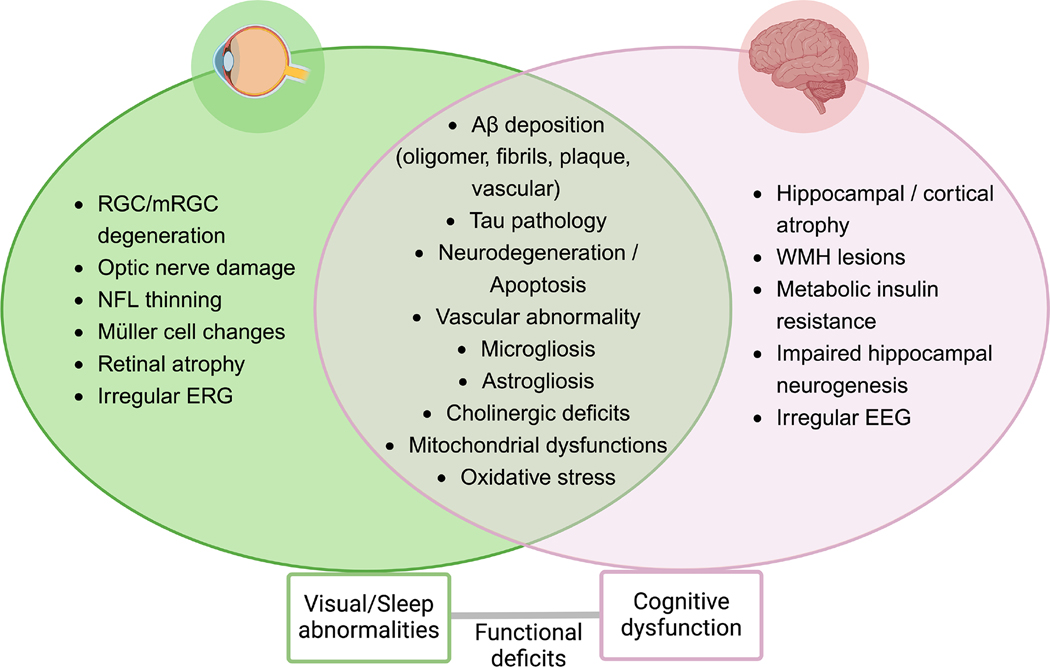
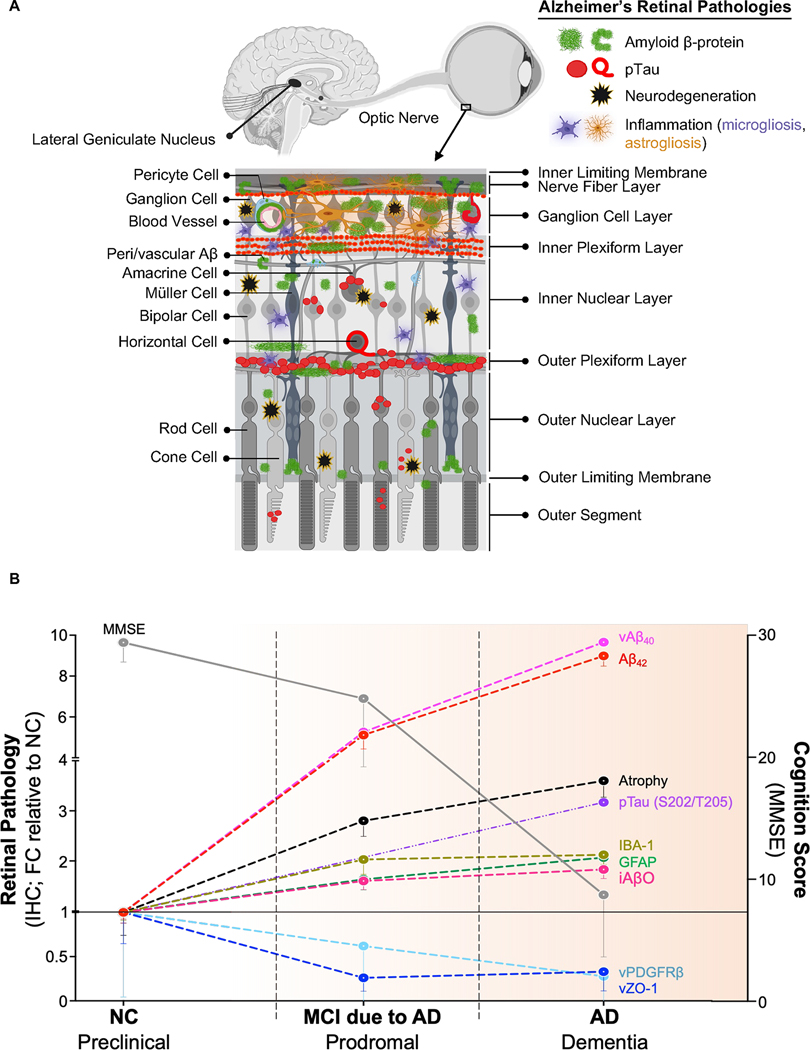
The retina is an emerging CNS target for potential noninvasive diagnosis and tracking of Alzheimer's disease (AD). Studies have identified the pathological hallmarks of AD, including amyloid β-protein (Aβ) deposits and abnormal tau protein isoforms, in the retinas of AD patients and animal models. Moreover, structural and functional vascular abnormalities such as reduced blood flow, vascular Aβ deposition, and blood-retinal barrier damage, along with inflammation and neurodegeneration, have been described in retinas of patients with mild cognitive impairment and AD dementia. Histological, biochemical, and clinical studies have demonstrated that the nature and severity of AD pathologies in the retina and brain correspond. Proteomics analysis revealed a similar pattern of dysregulated proteins and biological pathways in the retina and brain of AD patients, with enhanced inflammatory and neurodegenerative processes, impaired oxidative-phosphorylation, and mitochondrial dysfunction. Notably, investigational imaging technologies can now detect AD-specific amyloid deposits, as well as vasculopathy and neurodegeneration in the retina of living AD patients, suggesting alterations at different disease stages and links to brain pathology. Current and exploratory ophthalmic imaging modalities, such as optical coherence tomography (OCT), OCT-angiography, confocal scanning laser ophthalmoscopy, and hyperspectral imaging, may offer promise in the clinical assessment of AD. However, further research is needed to deepen our understanding of AD's impact on the retina and its progression. To advance this field, future studies require replication in larger and diverse cohorts with confirmed AD biomarkers and standardized retinal imaging techniques. This will validate potential retinal biomarkers for AD, aiding in early screening and monitoring.

Keywords: Alzheimer's disease; Inflammation; Neurodegenerative diseases; Retinal imaging; Retinal vascular pathology; Visual impairments.


Conflict of interest statement

Declaration of competing interest HH declares no competing financial interests related to the present article. He is an employee of Eisai Inc. The present article has been initiated and prepared as part of his academic position at Sorbonne University, Paris, France, and reflects entirely and exclusively his own opinion. He serves as Senior Associate Editor for the Journal Alzheimer's & Dementia and does not receive any fees or honoraria since May 2019. He is inventor of 11 patents and has received no royalties: AV declares no competing financial interests related to the present article. AV contribution to this work relates to his previous academic position at Sorbonne University, Paris, France. AV was an employee of Eisai Inc. (Nov 2019–June 2021). AV does not receive any fees or honoraria since November 2019. Before November 2019 he had he received lecture honoraria from Roche, MagQu LLC, and Servier. YK and MKH are co-founding members and consultants of NeuroVision Imaging, Inc., 1395 Garden Highway, Suite 250, Sacramento, CA 95833, USA. KLB is chair and SV is CEO, co-founders and shareholders of NeuroVision Imaging, Inc., 1395 Garden Highway, Suite 250, Sacramento, CA 95833, USA. All other authors declare no competing interests related to this article.

Figures

Fig. 1.
Fig. 1.. Landmark findings of retinal pathology in AD patients.
Timeline highlighting the key discoveries of retinal pathological, biochemical, and imaging biomarkers in Alzheimer’s disease (AD) patients since the first report of neuropathological plaques and tangles in the brain of an AD patient in 1906. Grey dotted rectangles highlight the key brain hallmarks, blue rectangles mark retinal vascular-related abnormalities, red rectangles highlight the identification of AD-hallmark pathologies in the retina of patients, and black rectangles define other AD-relevant pathologic biomarkers in the AD retina.
Fig. 2.
Fig. 2.. Aβ plaques identified in retinal flatmounts of AD patients.
(A) Schematic illustration of eye dissection, retinal isolation, and preparation of retinal flatmount and cross-section for histological and biochemical analyses. P. Pole (posterior pole), O.D. (optic disc), M (macula), and F (fovea). (B) Representative images of a retinal flatmount stained with curcumin and anti-human Aβ40 mAb (11A5-B10) in individuals with normal cognition (NC) and AD. No Aβ plaques were observed in NC retinas (left), while AD retinas exhibited evident Aβ plaques (middle). Higher magnification images (right) show extracellular Aβ40 plaques (white arrow) and intracellular Aβ40 (dotted line). (C) Representative images of Aβ plaques (4G8 mAb) in the inner retina, depicting classical plaque morphology with a central dense core and radiating fibrillar arms. (D) Representative maximum intensity projection images of retinal flatmounts stained with curcumin and anti-Aβ42 (12F4 mAb) in mild cognitively impaired (MCI) and AD patients. Abundant Aβ plaques were widespread in AD retinas. (E) Representative retinal flatmount images of AD patients depicting amyloid deposits stained with Congo red and toluidine blue (top-left), as well as amyloid fibrils’ birefringence (apple-green, bottom left) under polarized light. Scale bar: 25 μm. Congo red–positive amyloid plaques in AD patient retinas (right). Scale bar: 100 μm. Two intersecting blood vessels surrounded (along blood vessels and perivascular) by extensive Congo red–positive staining. (F) Representative images of NC and AD retinal flatmount depicting Aβ plaques stained with anti-Aβ42 mAb (12F4) and visualized with peroxidase-based labeling (DAB), highlighting the presence of Aβ plaques along a retinal blood vessel. (G) Representative images of retinal flatmounts and brain cortical tissues from AD patients stained with anti-Aβ antibody (6E10) and Longvida curcumin, depicting the colocalization of curcumin and 6E10 in cortical Aβ plaques. Scale bars: 10 μm. (H) Representative images of retinal flatmounts of AD patients and NC subjects and brain cortical tissues from AD patients stained with 12F4 and DAB labeling, displaying diverse morphology of Aβ aggregates. Scale bars: 20 μm, unless otherwise indicated. (I) IR area of 12F4+-Aβ42-containing plaques in the superior-temporal (ST) quadrant of retinal flatmounts in a subset of definite AD patients (N=8) and matched NC subjects (N=7). (J) Pearson’s (r) correlation analysis between retinal 12F4+-plaque burden and cerebral neuritic plaques (Gallyas silver stain) (N=8). Statistics: Data from individual subjects (circles) as well as group means ± SEMs are shown. Fold change is shown in red. **P < 0.01 by unpaired two-tailed Student’s t test. Panels A, E, G-J were modified from (Koronyo et al., 2017), Panels B-D were modified from (Koronyo-Hamaoui et al., 2011), and Panel F was modified from (La Morgia et al., 2016) with permission.
Fig. 3.
Fig. 3.. Aβ deposition and distribution in retinal cross-sections from MCI and AD patients.
(A) Schematic depiction of retinal cross-section preparation in predefined geometrical regions within the superior-temporal (ST), inferior-temporal (IT), inferior-nasal (IN), and superior-nasal (SN) quadrants. Retinal strips (red line, ~2 mm width) from each quadrant, extending from the optic disc (OD) to the ora serrata, were dissected for retinal cross-section preparation and further defined into subregions for histological analysis: proximal to OD – central (C) and distal from OD – mid-periphery (M) and far-periphery (F). Ten images (3C, 4M, 3F at 20x magnification), on average, are captured from each retinal section for quantitative analysis. (B-E) Representative fluorescent and non-fluorescent microscopic images demonstrating Aβ plaques in retinal cross-sections from confirmed AD patients. (B) Double-positive 4G8 mAbs (red) and curcumin (green) Aβ deposits were detected in the ONL and in the GCL, near and inside blood vessel (bv) walls. Left scale bar: 20 μm. Enlarged image, right scale bar: 5 μm. SSB: Sudan Black B. (C) A magnified, orthogonal view of a set of Z-stack images, from an AD retinal flatmount, demonstrated 6F/3D+ Aβ deposits (red; indicated by white arrowheads) in the RNFL, GCL, IPL, and INL. The green fluorescence is beta-3 tubulin immunoreactivity, demonstrating neuronal processes associated with retinal ganglion cell axons in the RNFL. (D) Representative retinal cross-section images showing 6E10+ Aβ plaques (non-fluorescent DAB) around amacrine cells (left) and horizontal cells (right) in the INL. Scale bars: 50 μm. (E) A retinal cross-section image from a representative MCI patient stained for total Aβ using JRF/Aβtot/17 (117–120) mAb and visualized with peroxidase-based DAB. In this MCI patient, a retinal Aβ plaque is observed in the INL. Scale bar: 20 μm. (F) Gallyas silver staining of a brain cross-section from an AD patient showing neuritic plaques in the frontal cortex (left image, scale bar: 20 μm). Retinas from NC individuals generally exhibited intact tissue (left image in retinal cross-section). Retinas from AD patients exhibited a classic Aβ plaque and compact deposits (red arrowheads): higher-magnification image in the inset (left). Retinal neuritic plaques (red arrowheads) were identified in the GCL of AD patients (middle). Neuritic components of senile plaques in GCL at higher magnification (right, top). Scale bar: 10 μm. Soma-positive silver stain aggregates and nuclear-dominant silver stain (red arrowheads) are observed in the GCL and INL (right, middle and bottom). Scale bar: 5 μm. (G-H) TEM analyses of retinal sections from AD patients. Retinas were pre-stained for Aβ42 with 12F4 mAbs and visualized with DAB. (G) Top left: TEM image showing ultrastructure of an Aβ42 plaque (pl), fibrils (fib), and protofibrils (pfib) near a blood vessel (bv) in vertical sections. Scale bar: 1 μm. Higher-magnification image (top right), indicating presence of 10- to 150-nm-wide Aβ42 fibrils as well as protofibrils and Aβ deposits (abd). Scale bar: 50 nm. Bottom left: Aβ plaque-like structure, marked by an asterisk and bordering red line, near basement membrane (bm) of a blood vessel (scale bar: 0.5 μm). Higher-magnification image (bottom right) showing Aβ plaque-like area, with structures resembling paranuclei containing annular oligomers (arrowhead; scale bar: 40 nm). (H) 3D-reconstruction of vertical and en face TEM images show a retinal Aβ42 plaque ultrastructure with fibril arms emanating from its dense core and Aβ-containing deposits in Müller cell (MC) end-feet close to the inner limiting membrane (ILM; red arrowheads). Scale bar: 1 μm. Panels A, E, and H were modified from (Koronyo et al., 2023), Panels B, F, and G were modified from (Koronyo et al., 2017), Panel C was modified from (Lee et al., 2020b), and Panel D was modified from (den Haan et al., 2018) with permission.
Fig. 4.
Fig. 4.. Parallels between retinal and brain Aβ pathology in MCI and AD patients.
(A) Representative retinal cross-section images from MCI and AD patients compared to NC controls immunolabeled with 12F4+-Aβ42 using peroxidase-based DAB and hematoxylin counterstaining. Scale bar: 20 μm. (B, left) Violin plots display IR area of retinal 12F4+-Aβ42 in age- and sex-matched patients with premortem clinical diagnoses of NC (N=17), MCI (N=10), or AD (N=18). (B, right) Aβ-plaque severity scores in a subset of corresponding brains from NC (N=6), MCI (N=10), and AD (N=17) subjects (by silver and Thioflavin-S or 4G8 mAbs). Red circles represent the autosomal-dominant AD patient with an A260V mutation in PSEN1. (C) Retinal Aβ1–42 levels determined by ELISA are shown in a cohort of NC controls (N=7) and AD patients (N=7). The red circle represents an autosomal-dominant AD patient with an A431E mutation in PSEN1. (D) Qualitative geometric hot spot regions for Aβ deposits found in retinal flatmounts of AD patients (S, superior; T, temporal; I, inferior; N, nasal; cumulative data from multiple experiments). (E) A typical Aβ42 immunoreactivity pattern (yellow) is observed in the inner retina (IR) and the outer retina (OR) in cross-sections from an AD patient. (F) Pie charts display Aβ42 distribution across the IR and OR, as well as the C, M, and F subregions of the ST and IT retina: raw data and normalized (NORM) per retinal thickness (density); higher burden in darker red. (G) Mid-sagittal brain illustration shows color-grading magnitude of Pearson’s (r) correlation values between retinal Aβ42 burden and brain pathology in the hippocampus (Hipp), superior (S.) frontal gyrus and temporal (temp) gyrus, S. parietal lobule, entorhinal cortex (EC), primary visual (PV), and visual association (VA) cortices. Pearson’s (r) correlations between (H) retinal Aβ42 area and Aβ plaques in the brain (gray; average of 7 brain regions) or in EC (orange), (I) retinal Aβ42 area and Braak stage, and (J) retinal Aβ42 area (green) or brain Aβ burden (gray) and the Mini-Mental State Examination (MMSE)-cognitive scores. Statistics: Data from individual subjects (circles) as well as group means ± SEMs are shown. Median, lower, and upper quartiles are indicated on each violin plot. Fold changes are shown in gray. *P < 0.05, **P < 0.01, ***P < 0.001, ****P < 0.0001, by one-way ANOVA and Tukey’s post hoc multiple comparison test, or by two-tailed unpaired Student’s t test. Panels A-C, E-J were modified from (Koronyo et al., 2023), and Panel D was modified from (Koronyo et al., 2017) with permission.
Fig. 5.
Fig. 5.. Identification of intracellular Aβ oligomers in postmortem brain and retina of MCI and AD patients.
Representative images of postmortem (A) brain and (B) retinal cross-sections show the existence of intracellular Aβ oligomers (iAβO) detected by the single-chain Fv fragment (scFv)A13 (red) conformation-sensitive and sequence-specific antibody. The scFvA13 selectively recognized AD-relevant Aβ oligomers inside cortical pyramidal and retinal neurons (Beta-III Tubulin, green) in AD patients, with a minimal signal in NC controls. Insert image: iAβO+-RGC. (C) IR area of scFvA13+iAβO in the ST/IT retina in MCI (N=8) and AD patients (N=10) versus NC controls (N=13). The red circle depicts the autosomal-dominant AD patient with the PSEN1-A260V mutation. (D) Pearson’s (r) correlations between retinal iAβO in the ST/IT regions (gray circles for total area, and pink circles for far-peripheral subregions) and MMSE cognitive scores. Statistics: Data points are presented with group means ± SEMs are shown. Fold changes are shown in gray. *P < 0.05, **P < 0.01, by one-way ANOVA with Tukey’s post hoc multiple comparison test. All panels are adopted from (Koronyo et al., 2023) with permission.
Fig. 6.
Fig. 6.. Tau isoforms and hyperspectral signatures of pTau and Aβ42 identified in retinal cross-sections from AD patients.
Representative images of retinal cross-sections from AD patients following (A) immunostaining with AT8 mAb against hyperphosphorylated-(p)Tau (Ser202, Thr205) and peroxidase DAB labeling, followed by hematoxylin counterstaining, reveal intracellular pTau accumulation in the INL (arrow) and neuronal processes of the IPL. Scale bar: 10 μm; (B) Gallyas silver staining, indicating the presence of neurofibrillary tangles (NFTs)-like structures, especially in the GCL (blue arrows); and (C) immunofluorescence staining with AT100 mAb against pTau (Thr212, Ser214), showing intracellular signals (white) in the INL. (D) Representative retinal cross-section images stained with pTau (Ser202, Thr205) and visualized with peroxidase DAB labeling, followed by hematoxylin counterstaining, depict the sequential pattern of primary retinal tauopathy (PReT) among the non-AD and AD retina: PReT stage 0, no p-tau pathology in the retina; PReT stage 1, initial pTau accumulation in the OPL; PReT stage 2, additional pTau presence in neurons of the INL; PReT stage 3, further accumulation of pTau in the OPL and INL, as well as in the IPL. (E) Representative images of superior peripheral retinal cross-sections from individuals with the following brain pathology: Braak stage 0, Braak stage I–III, and AD, stained for various tau isoforms, including the 3 and 4-repeats (3R, 4R) tau and five pTau epitopes, followed by DAB labelling (brown), and hematoxylin counterstaining for nuclei (violet). Scale bar: 50 μm. (F) Immunofluorescence staining showing positive signals for pS396-Tau (red), 12F4-Aβ42 (green), GFAP+ astrocytes (white), and DAPI nuclei (blue) in a retinal cross-section of an AD patient. (G) Distinct optical signatures of Aβ42 (green line) and pS396-Tau (red line) identified by hyperspectral imaging in the human AD retina. Representative images of AD retinal cross-sections showing (H) an unstained section (gray), (I) deep-learning (DL) predicted image (brown) based on the identified pTau optical signature, and (J) ‘ground truth’ immunostaining for pS396-Tau and peroxidase DAB labeling (brown). DL prediction (I) accurately indicated on unstained tissues the true pTau patterns, and demonstrated pS396-Tau signals that appear as intracellular and synaptic aggregates in the RNFL, IPL, and OPL. High magnification images (in I and J) show retinal NFT-like structures. Scale bar: 50 μm for large images, and 10 μm for bordered inserts. Panel A was modified from (Schon et al., 2012), Panel B was modified from (Koronyo et al., 2017), Panel D was modified from (Walkiewicz et al., 2024), Panel E was modified from (Hart de Ruyter et al., 2023), and Panels F-H were modified from (Du et al., 2022) with permission.
Fig. 7.
Fig. 7.. Retinal gliosis and Aβ phagocytosis by microglia in MCI and AD patients.
(A) Representative immunofluorescence images of retinal flatmount punches from AD patients and NC controls stained for Aβ (6F/3D; red) and IBA1+ microglia (green). Also displayed are representative images of retinal cross-sections immunostained for Aβ (6F/3D; red), β-III Tubulin (TUBB, green), and nuclei (DAPI, blue). Aβ immunofluorescence was evident within TUBB-positive RGCs and in extracellular spaces. Aβ immunoreactivity in RGC (asterisk); in neuropil and extracellular spaces (arrowheads); and colocalization with IBA1 microglia or TUBB neurons are shown. Scale bars: 20 μm. (B) Representative images of retinal cross-sections depicting increased astrogliosis (GFAP, red) in AD retina. Scale bar: 20 μm. Quantification of retinal: (C) IBA1+ IR area (N=73/10 fields/patients), (D) GFAP+ IR area (N=44/6 fields/patients), (E) number of Aβ plaques per field of view (FOV) (N=45/5 fields/patients), and (F) number of Aβ-positive RGCs, in AD patients (N=15) versus NC controls (N=10). (G, H) Representative fluorescence images showing (G) IBA1+ microgliosis (red), (H) retinal S100β+ (red)- or GFAP+ (green), macrogliosis for reactive astrocytes and Müller glia in retinal cross-sections from NC, MCI, and AD patients. Retinal GFAP+ macrogliosis is detected surrounding sites of 12F4+-Aβ42 deposits (red), especially in the ganglion cell layer (GCL), in patients with MCI or AD versus NC. White arrows indicate Aβ colocalized within GFAP+ macroglia. Scale bar: 20 μm. (I) Retinal IBA1- IR areas in NC (N=15), MCI (N=9), and AD (N=15). (J) Bar graph displays means and standard deviations of retinal IBA1+ microgliosis by sex in NC (N=9F/6M), MCI (N=6F/3M), and AD (N=5F/10M). (K, L) Quantitative IHC analyses of (K) retinal S100β in NC (N=5) and MCI/AD (N=15), as well as (L) retinal GFAP IR areas in NC (N=16), MCI (N=8), and AD (N=17). (M) Fluorescence image shows retinal IBA1+ microgliosis (red) colocalized at sites of 12F4+-Aβ42 deposits (white) with GFAP+ macrogliosis (green) and DAPI nuclei (blue). Scale bar: 20 μm. Retinal IBA1+ microglia often internalize Aβ42 (enlarged images). (N, O) Pearson’s (r) correlation analyses between retinal IBA1+ immunoreactive area and (N) retinal Aβ42 load, and (O) the MMSE cognitive scores. (P) Percent of 6F/3D-Aβ+ colocalized within IBA1+ microglia, showing a comparison between IBA1+ cells positive for Aβ (green) versus IBA1+ cells negative for Aβ (black), across different retinal layers in AD patients (N=5) and NC controls (N=7). (Q) Percent of 12F4-Aβ42+ colocalized within IBA1+ microglia out of the total IBA1+ microglia in retinal tissues from patients with MCI (N=5) and AD (N=6), as well as NC controls (N=5). The red circle in panels I and L indicate an ADAD patient with the PSEN1-A260V mutation. Fold increases and percent reductions between the groups are indicated on the graphs. Statistics: Data from individual subjects (circles) as well as group means ± SEMs are shown. Median and lower and upper quartiles are indicated on each violin plot. Fold changes are shown in gray. *P < 0.05, **P < 0.01, ***P < 0.001, ****P < 0.0001, by one-way or two-way ANOVA and Tukey’s post hoc multiple comparison test, or by two-tailed unpaired Student’s t test. F=female, M=male. Panels A and P were modified from (Xu et al., 2022), Panels B-E were modified from (Grimaldi et al., 2019), Panel F was modified from (Lee et al., 2020b), and Panels G-O and Q were modified from (Koronyo et al., 2023) with permission.
Fig. 8.
Fig. 8.. Retinal inflammation in transgenic murine models of AD.
Data from transgenic mouse models of AD, including the APPSWE/PS1ΔE9 mice (referred to as ADtg, AD+, or APPSWE/PS1ΔE9) and the APPSWE/PS1L166P (APP/PS1) mice are shown. (A) A representative Western blot gel showing the levels of phosphorylated (p)NF-κB p65 and NF-κB p65 subunit (NF-κB p65) in retinal lysates from APPSWE/PS1ΔE9 mice compared to age- and sex-matched wild type (WT) littermates at 4-, 8-, and 12- months of age (upper panel). The densitometric analyses of Western blot protein bands of pNF-κB p65, normalized to β-actin, is shown (lower panel) (N=8 for each age and genotype). (B) A representative image from a retinal flatmount of an APPSWE/PS1L166P mouse, immunofluorescently stained for Galectin-3+ microglia (red), Tmem119+ microglia (green), and lectin for blood vessels (blue). Scale bars: 10 μm. (C) A representative image from a retinal flatmount of an APPSWE/PS1L166P mouse, immunofluorescently stained for Clec7a+ microglia (red), Tmem119+ microglia (green), and lectin for blood vessels (blue). Scale bars: 10 μm. (D-E) IR area of (D) Galectin-3+ microglia in 4-month-old APP/PS1 mice and (E) Clec7a+microglia in 8-month-old APP/PS1 mice (N=6 each group). (F-G) Aged, 20–22-month-old, APPSWE/PS1ΔE9 (ADtg) mice underwent weekly subcutaneous (s.c.) immunization with glatiramer acetate (GA) or were injected with PBS as controls, for a duration of 8 weeks. (F, left) Protein homogenates from retinas isolated from the OS (left) and OD (right) eyes, and the respective left (L) and right (R) brain hemispheres, were quantified for levels of Aβ1–40 and Aβ1–42 by ELISA, and global proteome changes were assessed by mass spectrometry (MS). (F, right) Pearson’s (r) correlation analysis demonstrates a tight correlation between levels of Aβ1–42 in the brain and the retina (average of both eyes and left-brain hemispheres). Stronger correlation was found among the GA-treated ADtg mice (N=14). (G) Heat map displaying relative fold changes of differentially expressed proteins identified by the MS analysis, indicating molecular parallels between the retina and the brain in AD-related models following GA immunization. Highlighted are inflammatory markers (glutamine synthetase—GS, intercellular adhesion molecule 1—ICAM1, h-2 class I histocompatibility antigen—HA11) and AD-related amyloid-associated markers (amyloid-β A4 protein—APP/Aβ, clusterin—CLU, lysosomal-associated membrane protein 1 and 2—LAMP1/2) that were significantly up- or down-regulated in brain and retinal tissues of ADtg versus WT mice or of GA-immunized versus PBS-control ADtg mice (N=4–6 mice per group). (H-L) The effects of monocyte blood enrichment and transient angiotensin-converting enzyme (ACE) overexpression in monocytes (ACE10 model) on AD-like progression was studied. At 2 months of age, the APPSWE/PS1ΔE9 (AD+) mice underwent a partial bone marrow (BM) transplantation following irradiation with head shielding. Recipient AD+ mice received an intravenous (i.v.) injection of 5 million GFP-labelled BM cells from donor mice with either monocytes that are WT for ACE expression (GFP+BMWT), monocytes with ACE overexpression (GFP+BMACE10), or monocytes from AD+ mice (GFPBMAD+). (H-J) A Micron III® rodent retinal microscope was used to visualize in vivo monocyte infiltration into the retinas of AD+ chimeric mice. Representative in vivo retinal fluorescence imaging of infiltrating GFP+ BM cells in living AD+ chimeric mice: (H) control AD+ mouse that received GFPBMAD+ transplantation, (I) AD+ mouse that received GFP+BMWT transplantation (I’, enlarged image showing GFP+ BM cells in the retina), (J) AD+ mouse that received GFP+BMACE10 transplantation. Arrows indicate GFP+BM cells. (K) A representative microscope image of a retinal flatmount extracted from a GFP+BMACE10-AD+ chimeric mouse whose retina had been previously imaged in vivo. The flatmount retina was ex vivo immunostained for GFP (BM-derived cells, green), myelomonocytes (CD45, red), Aβ (4G8, cyan), and nuclei (DAPI, blue). BM-derived GFP+ACE10 monocytes migrate to the retina and surround retinal 4G8+-Aβ plaques. (L) Representative fluorescence image of coronal brain section from a GFP+BMWT-AD+ chimeric mouse showing infiltrating GFP+/CD45hi monocytes (arrows) migrating to the 6E10+-Aβ plaque site. Statistics: Data from individual subjects (circles) as well as group means ± SEMs are shown. Fold changes are shown in red. *P < 0.05, **P < 0.01, by two-way ANOVA with Sidak’s post-hoc multiple comparison test or unpaired two-tailed Student’s t test. Panel A was modified from (Shi et al., 2020a), Panels B-E were modified from (Shi et al., 2022), Panels F-G were modified from (Doustar et al., 2020), and Panels H-L were modified from (Koronyo-Hamaoui et al., 2020) with permission.
Fig. 9.
Fig. 9.. Histopathological findings of retinal atrophy in MCI and AD patients.
(A-B) Representative images of retinal cross-sections from human donors with normal cognition (control) and AD dementia stained with hematoxylin (blue, nuclei) and eosin (pink, tissue), illustrating reduced thickness of the (A) IPL, and (B) GCL, INL, and ONL (red) in AD patients. Retinal analysis was conducted in pre-defined geometric regions, including the superior-nasal and superior-temporal within sectors of ascending distances from the optic nerve. A low magnification view of the retina is shown in the top images with the corresponding magnified retinal region marked in the green box. (C) Mean GCL thickness across geometrical sectors in AD (red, N=8) versus control (blue, N=11) retinas. Error bars denote standard deviation. (D) Representative retinal cross-section images immunostained for 12F4+-Aβ42 (green) and nuclei (DAPI, blue), demonstrated that along with retinal Aβ42 accumulation there is a reduction in tissue thickness in an AD retina (132 μm) versus a NC retina (176 μm). Thickness was measured from the ILM to OLM (purple dashed lines). (E) Retinal thickness in the superior- and inferior-temporal retina in predefined subregions, central (C), mid-periphery (M), and far-periphery (F), from patients with AD (N=11), MCI (N=6), or NC (N=8–9). (F-G) Severity scores analysis of (F) brain AD (N=16), MCI (N=9), or NC (N=6) and (G) retinal atrophy in the same cohorts of human donors with AD (N=11), MCI (N=6), or NC (N=8–9). (H-J) Pearson’s (r) correlation analysis of (H) retinal thickness against retinal Aβ42, (I) retinal thickness against brain Aβ plaques, and (J) retinal atrophy against MMSE cognitive score. Statistics: Data from individual subjects (circles) as well as group means ± SEMs, unless otherwise indicated, are shown. Median, lower, and upper quartiles are indicated on each violin plot. Fold changes are shown in gray. *P < 0.05, **P < 0.01, ****P < 0.0001, by one-way or two-way ANOVA and Tukey’s post hoc multiple comparison test. Panels A-C were modified from (Asanad et al., 2019), and Panels D-J were modified from (Koronyo et al., 2023).
Fig. 10.
Fig. 10.. Degeneration of retinal cell types in MCI and AD patients.
(A) Representative images of Nissl neuronal staining in retinal cross-sections from a definite AD patient and an age- and sex-matched NC subject. Altered retinal neuronal staining is observed in AD patients, including changes in cytoplasmic staining patterns (chromatolysis) in the GCL, INL, and ONL, likely associated with neuronal loss. Scale bar: 20 μm. (B-C) Nissl neuronal count and total area in a subset of AD patients (N=9) and age- and sex-matched NC controls (N=8). Percent reduction in AD versus NC is indicated in red. (D) Representative retinal cross-sections labeled against the early apoptotic marker – macroglia (GFAP, green), cleaved caspase-3 (CCasp3; red), and nuclei (DAPI, blue), from NC (N=5), MCI (N=5), or AD subjects (N=7). The zoomed-in image illustrates the presence of CCasp3+ cells within the GCL and INL. Scale bar: 20 μm. (E) Quantitative CCasp3-immunoreactive area in the ST/IT retina. (F) Representative actigraphic profiles are shown for an individual with NC and an AD patient; the latter showing a severe disruption in their rest–activity circadian rhythm. (G) Morphological analysis of melanopsin retinal ganglion cells (mRGCs) in retinal flatmounts from a NC control and AD patient (upper panel). A 3‐dimensional reconstruction of mRGCs created by z-stack images and analysis of cell processes using the filament trace module in Imaris (Bitplane); 3 mRGCs (green, purple, and yellow) and their dendritic processes are visualized (lower panel). Scale bars: 25 μm (NC) and 24 μm (AD). (H) Immunostaining for mRGCs in retinal cross-sections from a NC control (upper image) and AD patient (lower image). Note the homogeneous staining of the cell body and dendrite (black arrow) in the NC and the patchy staining of melanopsin in the cell body (black arrow) in the AD retina. A single dendrite can be seen with a focal attenuation (white arrow) and varicosity (black arrowhead). Scale bar: 10 μm (I) Dendrite diameter analysis of 18 cells from 3 NC and 16 cells from 4 AD patients (top). The mRGC density (cell number per area) in NC (N=13) and AD patients (N=14) (bottom). (J-K) Representative images of retinal flatmounts from AD patients demonstrating: (J) intracellular Aβ deposition (6E10, red) within mRGC (green; white arrowhead) and an extracellular retinal Aβ deposit (red, white arrow) in the vicinity of mRGCs’ neurites. Scale bar: 20 μm; and (K) mRGC neurite (melanopsin, red) from an AD retina showing colocalization with Aβ (6E10, green; white arrowheads). Scale bar: 20 μm. (L-P) Retinal pericyte apoptosis in MCI and AD patients compared with NC controls. (L) Representative images of retinal cross-sections immunolabeled for TUNEL+ apoptotic cells (green), vascular PDGFRβ+ pericytes (red), and nuclei (DAPI, blue). Zoomed-in insets show multiple TUNEL+ pericytes in the AD retina. Scale bar: 10 μm. (M) Percent of TUNEL+ pericytes within 10–15 pericytes counted from each retinal cross-section of MCI (N=6) and AD patients (N=6) versus NC controls (N=6). (N) Percent cleaved caspase-3+ pericyte within 10–15 pericytes counted from each human donor: AD (N=6), MCI (N=6), and NC (N=6). The dashed line represents the 100% reference point. (O) Pearson’s (r) correlation between percent cleaved caspase-3+ pericytes and retinal 11A50-B10+40 IR area in a subset of human donors (NC-gray, MCI-blue, AD-red circles) (N=11). (P) Representative TEM image of retinal vertical section from an AD human donor. Retina was pre-stained with anti-Aβ42 mAb (12F4) and peroxidase-based DAB. TEM analysis reveals the location and ultrastructure of retinal vascular-associated Aβ deposits (demarcated by yellow shapes). Retinal Aβ42 deposits within pericytes (P, green), detected in the cytoplasm and adjacent to mitochondria. Scale bar: 0.5 μm. Endothelial cell (EC, pink) and blood vessel lumen (L, gray) are shown. Statistics: Data from individual subjects (circles) as well as group means ± SD (B, C, I) and means ± SEMs (E, M, N) are shown. Fold changes or percent reductions are also indicated. *P < 0.05, **P < 0.01, ***P < 0.001, ****P < 0.0001, by one-way or two-way ANOVA and Tukey’s post hoc multiple comparison test, or by two-tailed unpaired Student’s t test. Panels A-C were modified from (Koronyo et al., 2017), Panels D-E were modified from (Koronyo et al., 2023), Panels F-K were modified from (La Morgia et al., 2016), and Panels L-P were modified from (Shi et al., 2020b) with permission.
Fig. 11.
Fig. 11.. Vascular Aβ40 and Aβ42 deposits and PDGFRβ deficiency in retinas from MCI and AD patients.
(A1–5) Representative images of retinal flatmounts from NC and AD subjects stained with 12F4+-Aβ42 and peroxidase-based labeling. The NC retina appears clear of Aβ deposits in blood vessels compared to AD (black arrowheads). Retinal Aβ deposits are apparent inside blood vessels (bv, 2 and 3), as well as peri- and para-vascularly (4 and 5) in AD patients. (A6) Gallyas silver staining in a retinal cross-section from an AD patient reveals Aβ deposits near and surrounding a blood vessel (bv). Scale bars: 20 μm. (B) Representative images of AD brains and retinal cross-sections immunostained against Aβ40 (JRF/cAβ40/28) with DAB labeling and hematoxylin counterstaining in cohorts of AD, MCI, and NC human subjects. Red arrows indicate vascular Aβ40 staining in the tunica media, adventitia, or intima; right bottom image is an enlargement of the area indicated by the arrow from the lower middle image. Scale bars: 20 μm, unless otherwise indicated. (C) Schematic illustration of modified retinal microvascular network isolation and immunofluorescence staining. After isolation from donor eyes, 7-mm-wide strips were prepared from the temporal hemiretina spanning from the ora serrata to the optic disk. Following fixation, washing, and elastase digestion, the microvascular network is mounted onto slides without dehydration. Immunofluorescence staining was applied on isolated retinal vascular network. (D) Representative immunofluorescence images of isolated retinal microvasculature stained for Aβ42 (12F4, red), blood vessels (lectin, green), and nuclei (DAPI, blue) in age- and sex-matched human donors with NC and AD. Arrows indicate Aβ42 deposits (red arrows) in capillaries of an AD retina, a zoomed-in image (right) shows co-localization of Aβ42 within the retinal vascular walls (yellow spots), and retinal pericytes (green arrow). Scale bar: 10 μm. (E) Representative immunofluorescence images of retinal cross-sections from AD patients stained for Aβ40 (11A50–B10, red) within vertical (V; left) and longitudinal (L; right) blood vessels (lectin, green). Dashed geometric white shapes indicate pre-defined areas for quantitative analysis. Scale bars: 10 μm. (F) Mapping of vascular Aβ40 in four retinal quadrants, pre-defined C/M/F, and inner/outer retinal subregions. The intensity of the magenta color represents the density of retinal Aβ40 burden in each pre-defined geographic region. (G-H) Quantitative analyses of percent retinal (G) vascular Aβ40 IR area in NC control (N=10) and MCI/AD groups (N=16) and (H) vascular Aβ42 IR area in NC control (N=9) and MCI/AD groups (N=14). Dotted lines display the suggested threshold separating between the NC control and MCI/AD groups. Males in filled circles and females in clear circles. (I) Microscopic image of longitudinal vessel from MCI retina showing vascular Aβ42 deposition (green), often colocalized with PDGFRβ+ pericytes (red, white arrows). Scale bars: 10 μm. (J) Quantitative analysis of percent retinal PDGFRβ IR area in V vessels from the four quadrants of the retina (ST, IT, IN, NS) in NC (N=10), MCI (N=7) and AD (N=21) retinas. (K-L) Pearson’s (r) correlation between percent retinal PDGFRβ IR area in sum of V and L blood vessels against (K) retinal vascular Aβ40 in NC (N=9), MCI (N=5), and AD (N=10) retinas and (L) brain cerebral amyloid angiopathy (CAA) scores in the MCI (N=3) and AD (N=11) retinas. Statistics: Data from individual subjects (circles) as well as group means ± SEMs are shown. Fold changes and percent reductions are shown in red. ***P < 0.001, ****P < 0.0001, by one-way ANOVA with Sidak’s post-hoc multiple comparison test or unpaired 2-tailed Student’s t test. Panel A was modified from (Koronyo et al., 2017), and Panels B-L were modified from (Shi et al., 2020b) with permission.
Fig. 12.
Fig. 12.. Arterial Aβ40 deposition and tight junction deficits in retinas from MCI and AD patients associate with CAA severity.
(A) Representative immunofluorescent images of retinal cross-sections from an AD patient stained for α-smooth muscle actin (α-SMA, green), collagen IV (ColIV, blue), vascular 11A50-B10+-Aβ40 (red), and nuclei (DAPI, cyan), alongside imaging of the differential interference contrast (DIC) channel. Retinal Aβ40 deposition is often observed within arteriole walls. Scale bars: 20 μm. (B) Quantitative analysis of retinal vascular Aβ40 immunoreactive area in retinal blood vessel types—capillaries, arterioles, and venules—stratified by diagnostic groups: NC (N=15), MCI (N=8), and AD (N=15). (C) Quantitative analysis of retinal vascular Aβ40 immunoreactive area stratified by blood vessel type within the diagnostic group in the same cohort. (D) Pearson’s (r) correlations between retinal arterial Aβ40 versus brain CAA scores (N=25). (E) Representative images of retinal cross-sections immunostained for endothelial tight junction protein, claudin-5 (red), ColIV (green), and DAPI (blue) in NC, MCI, and AD subjects with different degrees of CAA severity scores. Scale bars: 20 μm. (F) Percent retinal endothelial claudin-5 IR area separately in capillaries and large blood vessels from all experimental groups stratified by CAA severity scores (N=35). (G) Pearson’s (r) correlation between claudin-5 in retinal capillaries (red) and large blood vessels (gray) and CAA severity scores (N=35). (H) Representative images of isolated retinal microvascular networks immunostained for endothelial tight junction zonula occludens protein-1 (ZO-1, red) and lectin for blood vessels (green) or ZO-1 (red) and 11A50-B10+40 (green) and DAPI (blue), in an AD patient and in age- and sex-matched NC control. Scale bars: 20 μm. Right panels are zoomed-in images from regions surrounded by dashed lines showing increased capillary Aβ40 deposits with reduced ZO-1 expression in the AD retina. (I) Percent retinal endothelial ZO-1 IR area in capillaries of NC (N=22), MCI (N=10), and AD (N=21) retinas. (J) Pearson’s (r) correlation between retinal Aβ40 and ZO-1 in capillaries (N=30). Statistics: Data from individual subjects (circles) as well as group means ± SEMs are shown. Fold changes and percent reductions are shown in red. *P < 0.05, **P < 0.01, ***P < 0.001, ****P < 0.0001, by one-way ANOVA, or two-way analysis of variance with Tukey’s post hoc multiple comparison. All panels were modified from (Shi et al., 2023) with permission.
Fig. 13.
Fig. 13.. Retinal vascular abnormalities in transgenic murine models of AD.
(A, left) Illustration of mouse retinal flatmount isolation. (A, middle-right) Representative images of periodic acid-Schiff (PAS)-stained, hematoxylin-counterstained isolated retinal microvasculature from 12-months (M)-old transgenic APPSWE/PS1ΔE9 (ADtg) mice and matched non-tg WT littermates. Acellular degenerated retinal capillaries are indicated by red arrows. Scale bars: 20 μm. (B) Number of degenerated retinal capillaries (Degen Caps) in WT (N=8) and ADtg (N=8) mice by age groups of 4-, 8-, and 12- months. (C) Representative fluorescence image of the isolated retinal microvasculature immunostained for Aβ (4G8, red), blood vessels (lectin, green), and nuclei (DAPI, blue) in an 8-month-old ADtg mouse. Aβ signals were observed in retinal vessel walls and vascular cells. (D) Vascular 4G8+ Aβ IR area in WT (N=6) versus ADtg (N=6) mice. (E) A representative image of isolated retinal microvasculature network from an 8-month-old ADtg mouse immunostained for Aβ40 (11A50-B10, magenta), blood vessels (lectin, green), and nuclei (DAPI, blue). Scale bar: 20 μm. (F) Representative fluorescent images of a retinal cross-section immunolabelled for blood vessels (CD31, blue), fibrillar Aβ with thioflavin-S (Thio-S, green), and Aβ40 (11A50-B10, red) in an 8-month-old ADtg mouse. Images show both vertical (left) and longitudinal (right) blood vessels. (G) Representative fluorescence images of isolated retinal microvasculature immunostained for pericytes (PDGFRβ, red), blood vessels (lectin, green), and nuclei (DAPI, blue) in ADtg and WT littermate mice. Scale bars: 20 μm. (H) Quantitative analysis of the ratio between PDGFRβ IR area and lectin IR area in each microscopic field of isolated retinal microvasculature from ADtg (N=6) versus WT (N=6) littermate controls. (I) Pearson’s (r) correlation between degenerated retinal capillary count and PDGFRβ IR area (N=12). (J, left) Representative Western blot (WB) gel of claudin-1 levels and β-actin control in retinal protein lysates from ADtg mice and WT littermate controls. (J, right) Densitometric analyses of WB protein bands of retinal claudin-1 normalized to β-actin control in 8- and 12-month-old ADtg (N=8) versus WT (N=8) mice. (K) Pearson’s (r) correlation between degenerated retinal capillary count and the densitometric analysis of retinal claudin-1 levels as assessed by WB. (L-M) Illustration of the procedure and live noninvasive retinal vascular imaging following i.v. injection of fluorescein dye in 12-month-old ADtg and WT mice. (L) A Micron-III® rodent retinal microscope was used to visualize retinal blood vessels. (M) In vivo fluorescein imaging in a WT mouse shows intact retinal microvasculature, whereas retinal imaging in an ADtg mouse shows retinal microvasculature leakage. Inset image shows the magnified view of fluorescein leakage. (N) Representative images of retinal flatmounts obtained from a 7-month-old WT and ADtg mice that received i.v. tail injections of FITC-dextran (green) and Texas Red-dextran (red). Quantitative analysis of (O) FITC- or (P) Texas Red-fluorescence area in each microscopic field of retinal flatmounts from WT (N=5) versus ADtg (N=5) mice. Statistics: Data from individual mouse (circles) as well as group means ± SEMs are shown. Fold changes and percent reductions are shown in red. *P < 0.05, **P < 0.01, ***P < 0.001, ****P < 0.0001, by two-way ANOVA with Sidak’s post-hoc multiple comparison test or unpaired two-tailed Student’s t test. All panels were modified from (Shi et al., 2020a) with permission.
Fig. 14.
Fig. 14.. Schematic summary of retinal vascular abnormalities in MCI and AD patients.
Illustration depicting a myriad of vascular abnormalities in the retina of MCI and AD patients, as described by a growing number of histological and in-vivo imaging studies. Retinal vascular changes observed in the AD retina include vascular amyloidosis, predominantly accumulation of Aβ40 in retinal peri-vascular space and within arterial walls, tortuosity, dimeter reduction (thinning), abnormal vascular branching complexity, enlarged foveal avascular zone (FAZ), vascular non-perfusion or decreased blood flow, pericyte degeneration, and BRB disruption with loss of tight junction (TJ) proteins. Such changes in retinal vasculature may ultimately lead to functional impairments observed in AD patients. Green signals and dots indicate Aβ deposits in the AD retina.
Fig. 15.
Fig. 15.. Retinal amyloid imaging in living MCI and AD patients and correlations to hippocampal atrophy and cognitive impairment.
(A) An ophthalmic imaging illustration and a representative retinal curcumin-fluorescence amyloid image in a living AD patient, following an oral Longvida® curcumin administration. Subjects’ retinas were imaged with a modified scanning-laser ophthalmoscope (SLO) prior to (day 0, baseline image) and after curcumin intake, as previously reported (Koronyo et al., 2017). Curcumin-bound amyloid deposits in AD retina are presented as yellow dots. (B, top) Color-coded spot overlay images in NC and AD retinas. Red spots are above the threshold and considered curcumin-positive amyloid deposits, green spots exceed 1:1 reference but not the threshold, and blue spots fall below the reference. (B, bottom) Heatmap images with red spot centroids. (C) Threshold defining increased curcumin fluorescent signal in the retina and the calculation of retinal amyloid index (RAI) scores in an AD patient. The blue line is a 1:1 reference, and the green line represents the threshold level, determined at 500 counts and above; the red spots are above the threshold. (D) RAI scores in AD patients (N=6) versus age-matched NC individuals (N=5). (E) Schematic of clinical study timeline, including neuropsychiatric evaluation, brain magnetic resonance imaging (MRI), and Retia SLO retinal amyloid imaging. (F) Representative post-processed image of the retinal superior-temporal (ST) quadrant from a subject with amnestic MCI (aMCI). Yellow spots indicate curcumin-bound amyloid deposits. (G) Predefined division of retinal ST quadrant used for quantification of retinal amyloid deposit count and area. The topographical segmentation into distal mid‐periphery (DMP), proximal mid‐periphery (PMP), and posterior pole (PP), is demonstrated. ODD – optic disc diameter. (H) Retinal PMP amyloid count and area, and (I) total intracranial volume and hippocampal volume, when patients are stratified by Montreal cognitive assessment (MOCA) score threshold of 26 (N=18 for MOCA > 26 and 16 for MOCA ≤ 26). (J) Retinal PMP amyloid count in MCI and AD patients (N=25) compared to NC controls (N=8). (K) Pearson’s (r) correlation analysis between retinal PMP amyloid count and hippocampal volume, revealed the relationship between increased retinal amyloid burden and hippocampal volume loss (N=26). (L) A representative curcumin fluorescent fundus image in an AD patient with a MOCA score ≤ 26, showing multiple retinal amyloid deposits (yellow dots) within the three topographical ST subregions. Magnified image is shown. (M) Retinal vascular analysis is shown for the region of interest, with the red circle indicating the center of the optic nerve-head, and the smallest yellow circle shows the optic nerve-head area. The two larger circles indicate the region of interest for the peripapillary vascular analysis, which were 1.5 and 4 times the diameter of the optic disc. The branching angle and tortuosity of retinal arteries (red) and veins (blue) within the region of interest were calculated. (N) A combined retinal PMP amyloid and venous vessel tortuosity index (VTI) in patients stratified by cognitive status [normal (N=11) versus impaired (N=18)]. (O-P) Pearson’s (r) correlation analyses between combined PMP amyloid-venous VTI index and (O) verbal memory (N=27) or (P) cognitive-related quality-of-life SF-MCS-36 Z-scores (N=21). Statistics: Data from individual subjects (circles) as well as group means ± SEMs (D) and means ± SD (H-J, N) are shown. Fold change is shown in red. *P < 0.05, **P < 0.01, by two‐tailed unpaired Student t‐test. Panels A-D were modified from (Koronyo et al., 2017), Panels E-L were modified from (Dumitrascu et al., 2020), and Panels M-P were modified from (Dumitrascu et al., 2021) with permission.
Fig. 16.
Fig. 16.. Color and contrast vision impairments in young and old ADtg mice observed in the visual-stimuli X-maze test.
The visual-stimuli (4-arm) X-maze (ViS4M) behavioral apparatus was used to quantitatively evaluate color and contrast vision and cognitive function in transgenic APPSWE/PS1ΔE9 (AD+) mice versus WT littermates. (A) Color mode for ViS4M text is shown. (B) The spectral distribution of the LED sources for each X-maze arm, corresponds to the wavelength-sensitive mouse M- and S-type opsins. (C) Characteristics of the light stimuli, wavelength, and full width at half maximum (FWHM), for each maze arm in the color mode. (D) Illustration of the spontaneous mouse alternation pathways in the ViS4M test. (E) Percent alternations in the red high (RH)- and the equal (E)-light intensity conditions in old AD+ and WT mice. (F) Noninvasive in vivo retinal imaging of curcumin-positive amyloid deposits in the same AD+ mouse at the age of 8.5- and 13-month-old. Orange arrows show pre-existing plaques at the 8.5-month-old mice that persisted at 13 months of age, and green arrows identify newly formed plaques at 13 months of age. (G) Percent alternations in E-light condition of the color mode in 8.5-, 13-, and 18-month-old AD+ versus WT mice. (H) Heatmap-coded chord diagrams from the most frequent (orange) to the least frequent (black) bidirectional transitions, showing marked differences in arm transition patterns between AD+ and WT mice. (I) Percent time spent in each colored arm under the E-light condition in 13-month-old AD+ and WT mice. (J) Chord diagrams depicting the most frequent transitions under the E-light condition in WT (up) and AD+ (down) mice at 3 different age groups. (K) Visual X maze in the contrast mode: the arms include either black (B), grey (G), white (W), or clear (C) objects, against the white floor and black walls. The dimension of the object (e.g., black) in the arm is shown. (L) Percent alternations under the contrast mode in 8.5-, 13-, and 18-month-old WT versus AD+ mice. (M-N) Percent entries in the arm containing (M) the black object and (N) the clear object in 8.5-month-old WT vs AD+ mice. (O) Rainbow heatmap illustrating the percentage of bidirectional transitions between arms with grey and black objects, white and clear objects, white and black objects, and grey and clear objects (shown in top panel). The color gradient bar shows the range of percent transitions (from lowest in red to highest in purple). Mouse cohorts: 8.5-month-old WT (N=13–16) and AD+ (N=11–12); 13-month-old WT (N=11–15) and AD+ (N=11–15); and 18-month-old WT (N=19) and AD+ (N=9). Statistics: Data from individual mouse (circles) as well as group means ± SEMs are shown. *P < 0.05, **P < 0.01, ***P < 0.001, ****P < 0.0001, by two-way ANOVA followed by post-hoc Fisher’s least significant difference test. Panels were modified from (Vit et al., 2021a) and (Vit et al., 2021b) with permission.
Fig. 17.
Fig. 17.. Proteome landscape of the AD retina and brain.
(A) Heatmaps display the proteomics profiling with detectable protein hierarchies as identified by mass spectrometry analysis on protein homogenates from temporal hemiretinas (N=6 AD, N=6 NC) and temporal (T.) cortices (N=10 AD, N=8 NC) of AD patients versus NC controls. The differentially expressed proteins (DEPs) and fold changes (FC) are presented for upregulated (pink) and downregulated (green) DEPs. (B) Volcano plots of top 20 up- or downregulated DEPs organized by FC (lowest P values highlighted in bold) in retinas and T. cortices from AD versus NC subjects (DEPs marked by red circles). (C) Common retinal and cortical upregulated and downregulated DEPs in AD patients versus NC controls. (D) Ingenuity pathway analysis of top upregulated and downregulated biological functions in AD versus NC retinas based on Z-scores. (E-I) DAVID biological classification analysis displays major upregulated and downregulated pathways, presenting the top upregulated DEPs (pink) related to apoptosis, necrosis, and inflammation/immune responses, as well as the top downregulated DEPs (green) associated with photoreceptor degeneration and mitochondrial dysfunction in AD versus NC retinas. Lower blue bars represent the magnitude of P values. Percentages indicate the fraction of each category of total upregulated or downregulated DEPs. All panels were adapted from (Koronyo et al., 2023) with permission.
Fig. 18.
Fig. 18.. Parallel AD pathological processes in the brain and retina.
Various pathological hallmarks of AD observed in the brain of AD patients have also been identified in the retina. The key characteristic features of AD that the retina shares with the brain include, Aβ deposition (e.g., oligomers, proto-fibrils and fibrils, neuritic plaques, and perivascular and vascular Aβ40 and Aβ42 accumulations), abnormal tau isoforms (e.g., pTau, 3R and 4R tau isoforms), neurodegeneration and apoptotic cell death, vascular abnormalities, inflammatory processes (microgliosis and astrogliosis), cholinergic dysfunction, mitochondrial dysfunctions, and oxidative stress. The mRGC/RGC degeneration, optic nerve damage, RNFL thinning, Müller glia changes, retinal atrophy, and irregular ERG were reported in AD retina, whereas hippocampal and cortical atrophy, white matter hyperintensities (WMH) lesions, metabolic insulin resistance, impaired hippocampal neurogenesis, and irregular EEG were reported in the AD brain. These pathophysiological processes in the retina can contribute to visual and sleep abnormalities, and those in the brain lead to cognitive and behavioral deficits that were described in AD patients. Sharing the diverse and key pathological hallmarks of AD with the brain, the easily accessible retina may serve as a prime site for visualizing and monitoring AD.
Fig. 19.
Fig. 19.. Retinal pathological processes and predicted changes during AD continuum.
(A) Schematic depiction of the pathological changes identified in different cell layers of the retina from MCI and AD patients. Aβ deposition occurs throughout the retinal layers, as well as in the retinal blood vessels, pericytes, and Müller glia endfeet. Aβ deposits are predominantly in the inner retina as compared to the outer retina. pTau accumulation is often observed in the OPL, along with the IPL, INL, GCL, and RNFL. Retinal neurodegeneration is detected across all retinal layers with marked ganglion cell loss, and inflammatory processes, including reactive astrocytes and activated microglia, being abundant in the inner retina (RNFL, GCL, IPL, and INL). As disease progresses, activated microglia are also found in the OPL. (B) Graphical illustration of the predicted changes (continues dotted lines) in retinal histopathological markers during AD progression. Experimental histopathological data of the mean fold change (FC) values quantified in retinal tissues from MCI and AD patients versus NC controls. Retinal pathologies included the Aβ42 deposition, IBA-1 microgliosis, GFAP gliosis, intraneuronal Aβ oligomers (iAβO), and atrophy (Koronyo et al., 2023), vascular (v)Aβ40, vPDGFRβ, (Shi et al., 2020b) and vZO-1 (Shi et al., 2023), as well as pTau (S202/T205) (Hart de Ruyter et al., 2023), plotted against the reported MMSE scores (Koronyo et al., 2023). The FC values of pTau (S202/T205) was calculated by dividing the mean surface percentage of pTau (S202/205) in the AD retina by the average mean surface percentage of pTau (S202/205) in controls with Braak scores of 0 or I-III. pTau (S202/205) IR area was analyzed in the mid- and far- peripheral retinal regions and does not include MCI patients. All other biomarkers represent retinal changes from central, mid-, and far-peripheral ST and IT subregions, in the three diagnostic groups. The black line represents the threshold FC value of 1 relative to NC controls.

References

    1. Abbasi J, 2017. A Retinal Scan for Alzheimer Disease. JAMA 318, ss1314. - PubMed
    1. Adlard PA, Li QX, McLean C, Masters CL, Bush AI, Fodero-Tavoletti M, Villemagne V, Barnham KJ, 2014. beta-amyloid in biological samples: not all Abeta detection methods are created equal. Front Aging Neurosci 6, 203. - PMC - PubMed
    1. Akiyama H, Barger S, Barnum S, Bradt B, Bauer J, Cole GM, Cooper NR, Eikelenboom P, Emmerling M, Fiebich BL, Finch CE, Frautschy S, Griffin WS, Hampel H, Hull M, Landreth G, Lue L, Mrak R, Mackenzie IR, McGeer PL, O’Banion MK, Pachter J, Pasinetti G, Plata-Salaman C, Rogers J, Rydel R, Shen Y, Streit W, Strohmeyer R, Tooyoma I, Van Muiswinkel FL, Veerhuis R, Walker D, Webster S, Wegrzyniak B, Wenk G, Wyss-Coray T, 2000. Inflammation and Alzheimer’s disease. Neurobiol Aging 21, 383–421. - PMC - PubMed
    1. Al-Mujaini AS, Al-Mujaini MS, Sabt BI, 2021. Retinal nerve fiber layer thickness in multiple sclerosis with and without optic neuritis: a four-year follow-up study from Oman. BMC Ophthalmol 21, 391. - PMC - PubMed
    1. Alber J, Arthur E, Goldfarb D, Drake J, Boxerman JL, Silver B, Ott BR, Johnson LN, Snyder PJ, 2021. The relationship between cerebral and retinal microbleeds in cerebral amyloid angiopathy (CAA): A pilot study. J Neurol Sci 423, 117383. - PubMed

MeSH terms

Substances