Review
. 2024 Jun 12;124(11):7106-7164.
doi: 10.1021/acs.chemrev.3c00776. Epub 2024 May 17.

Fluorescent Probes for Disease Diagnosis

Affiliations
Review

Fluorescent Probes for Disease Diagnosis

Xin Wang et al. Chem Rev. .

Abstract

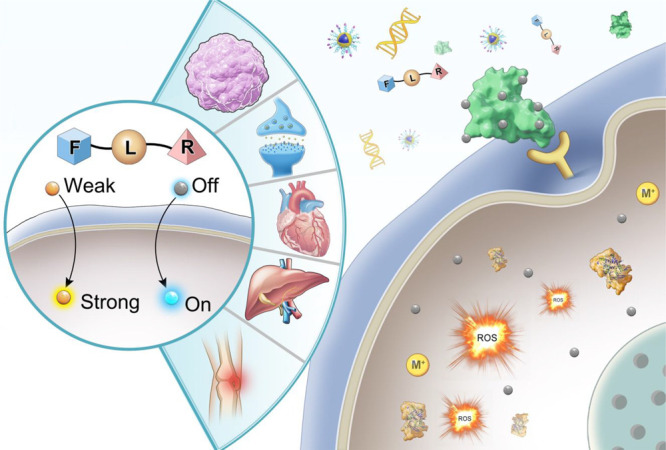
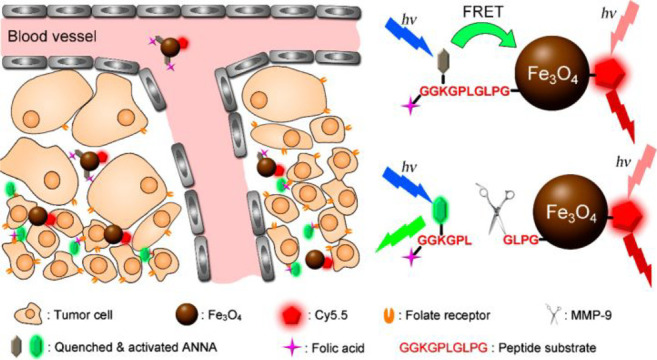
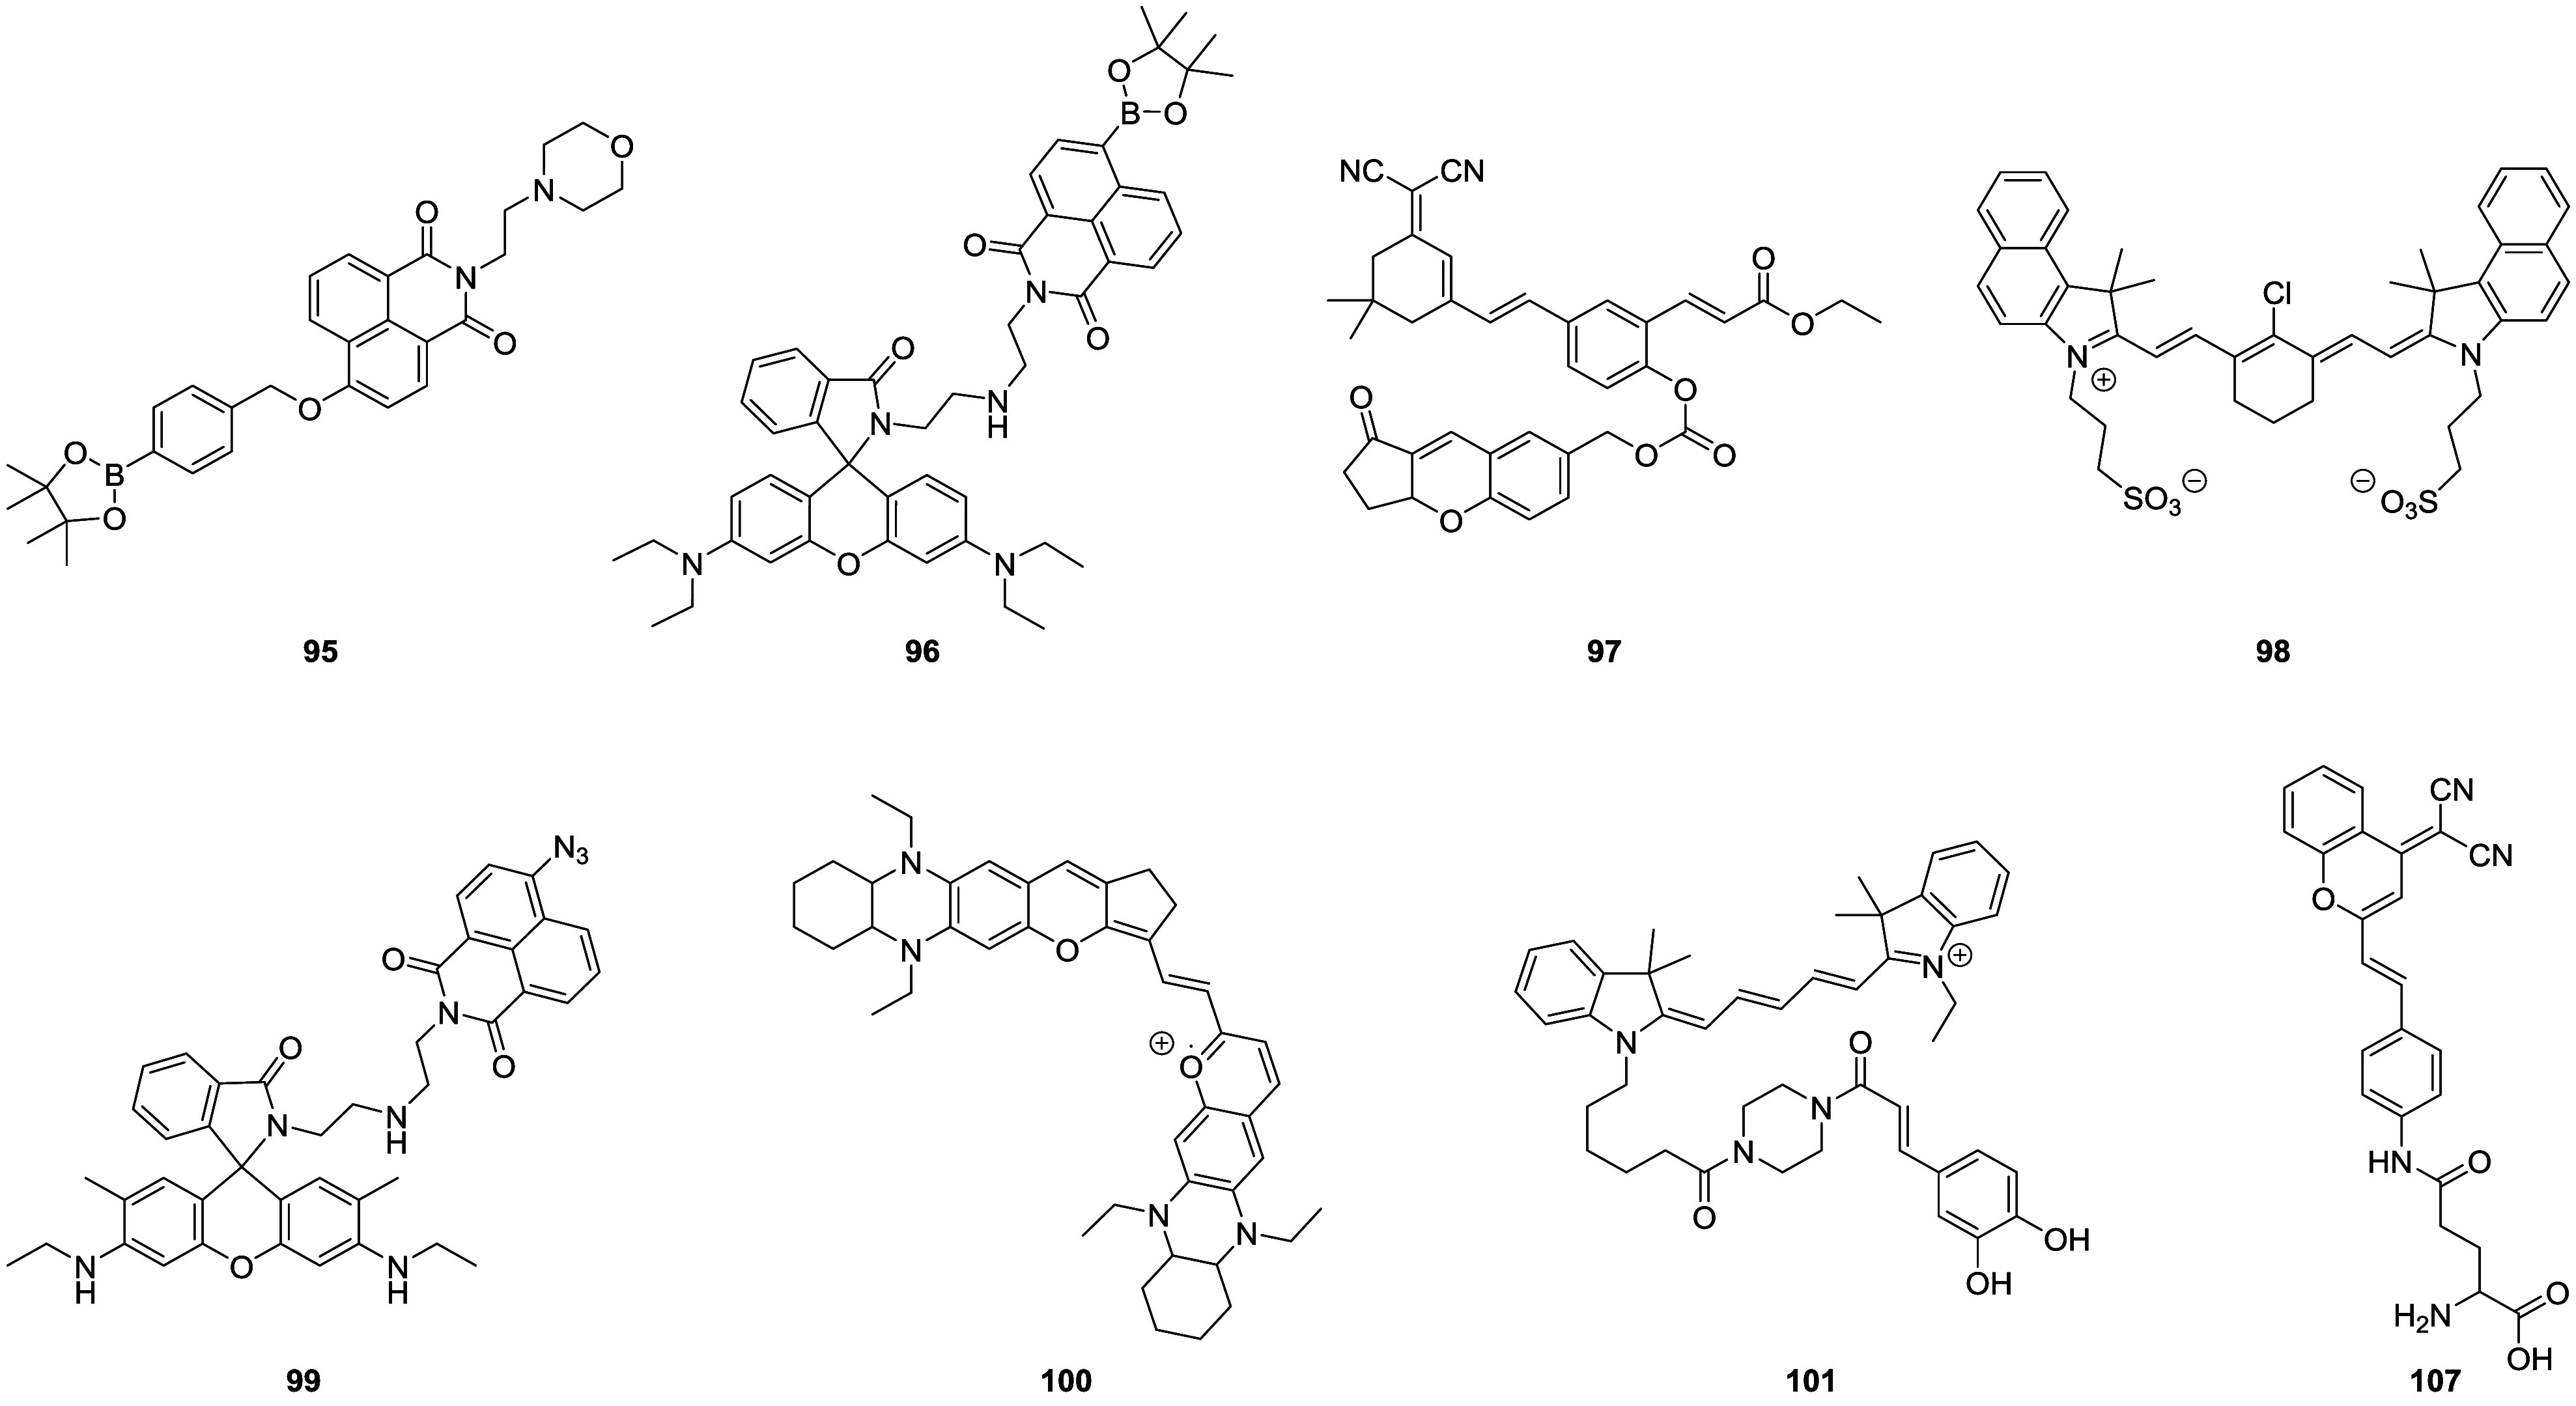
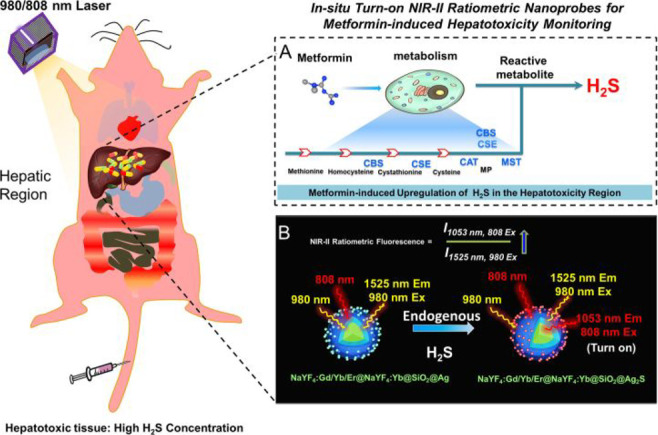
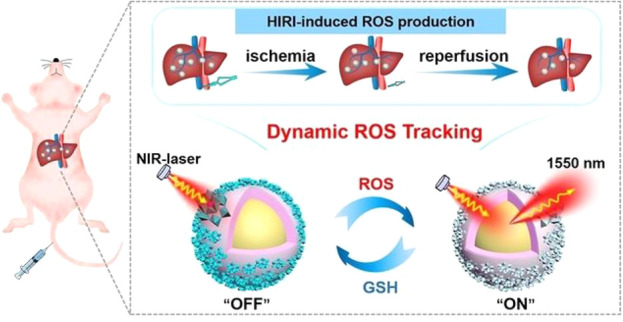
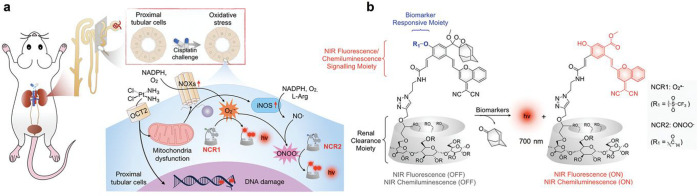
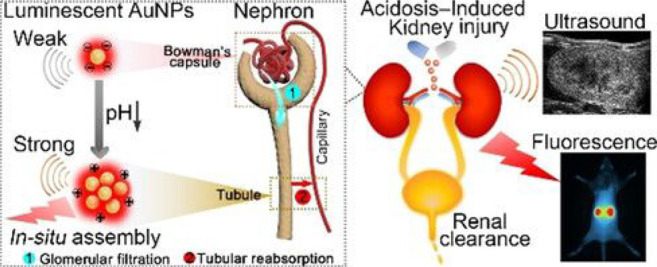
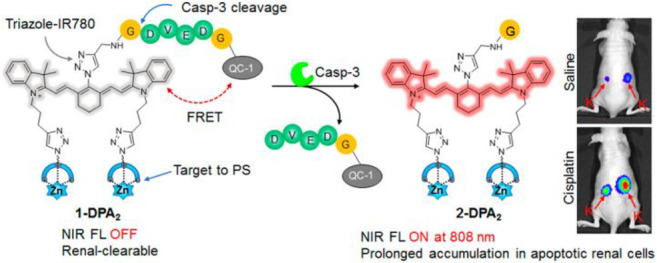
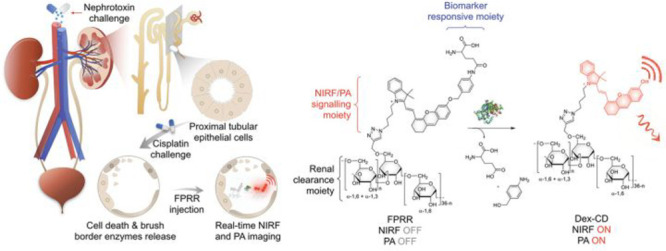
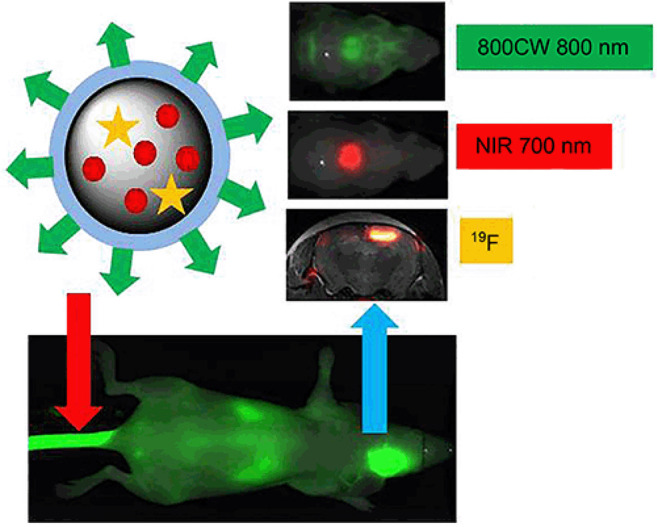
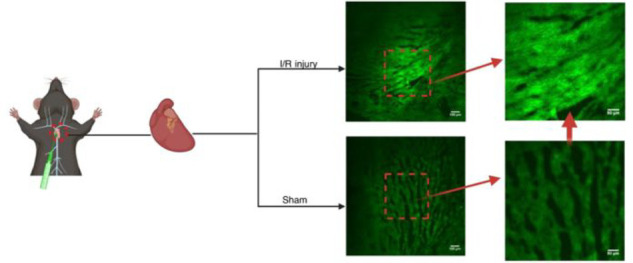
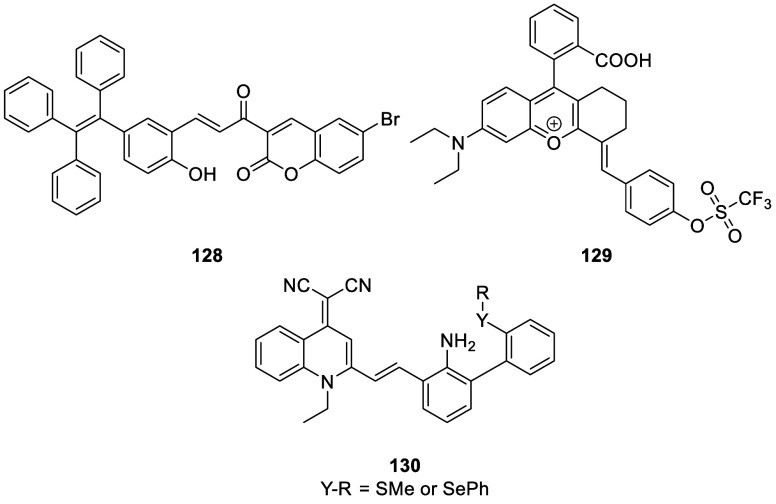
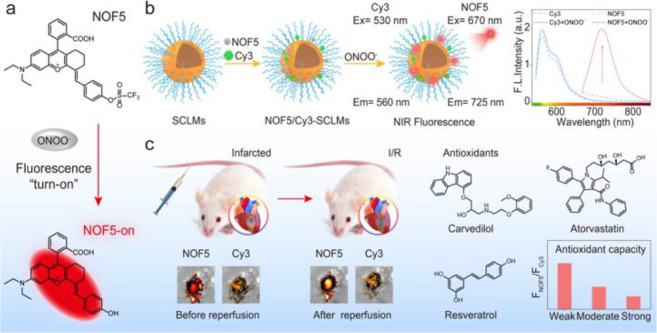
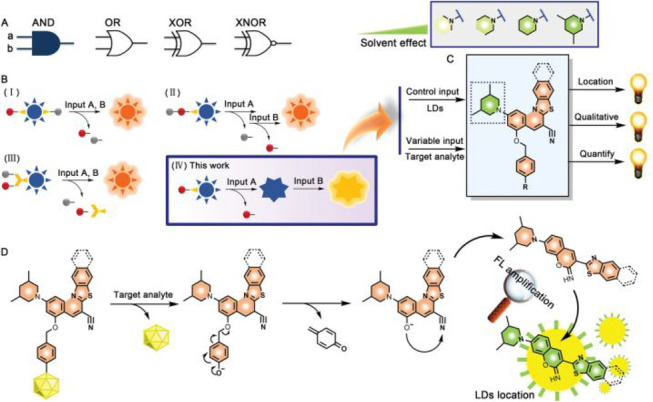
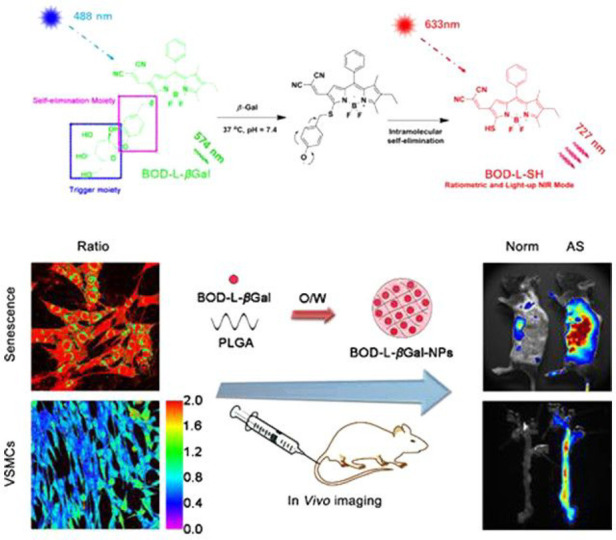
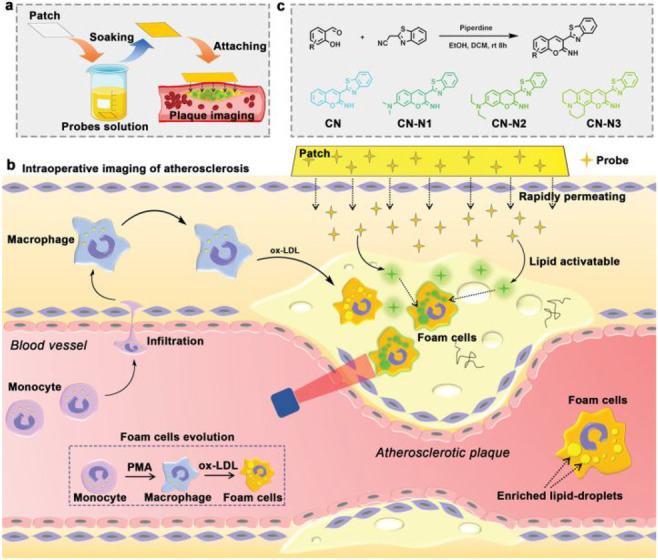
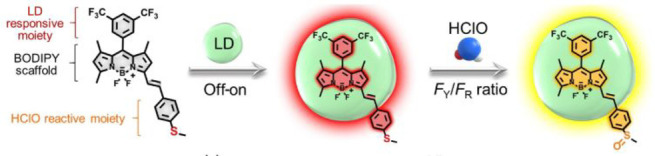
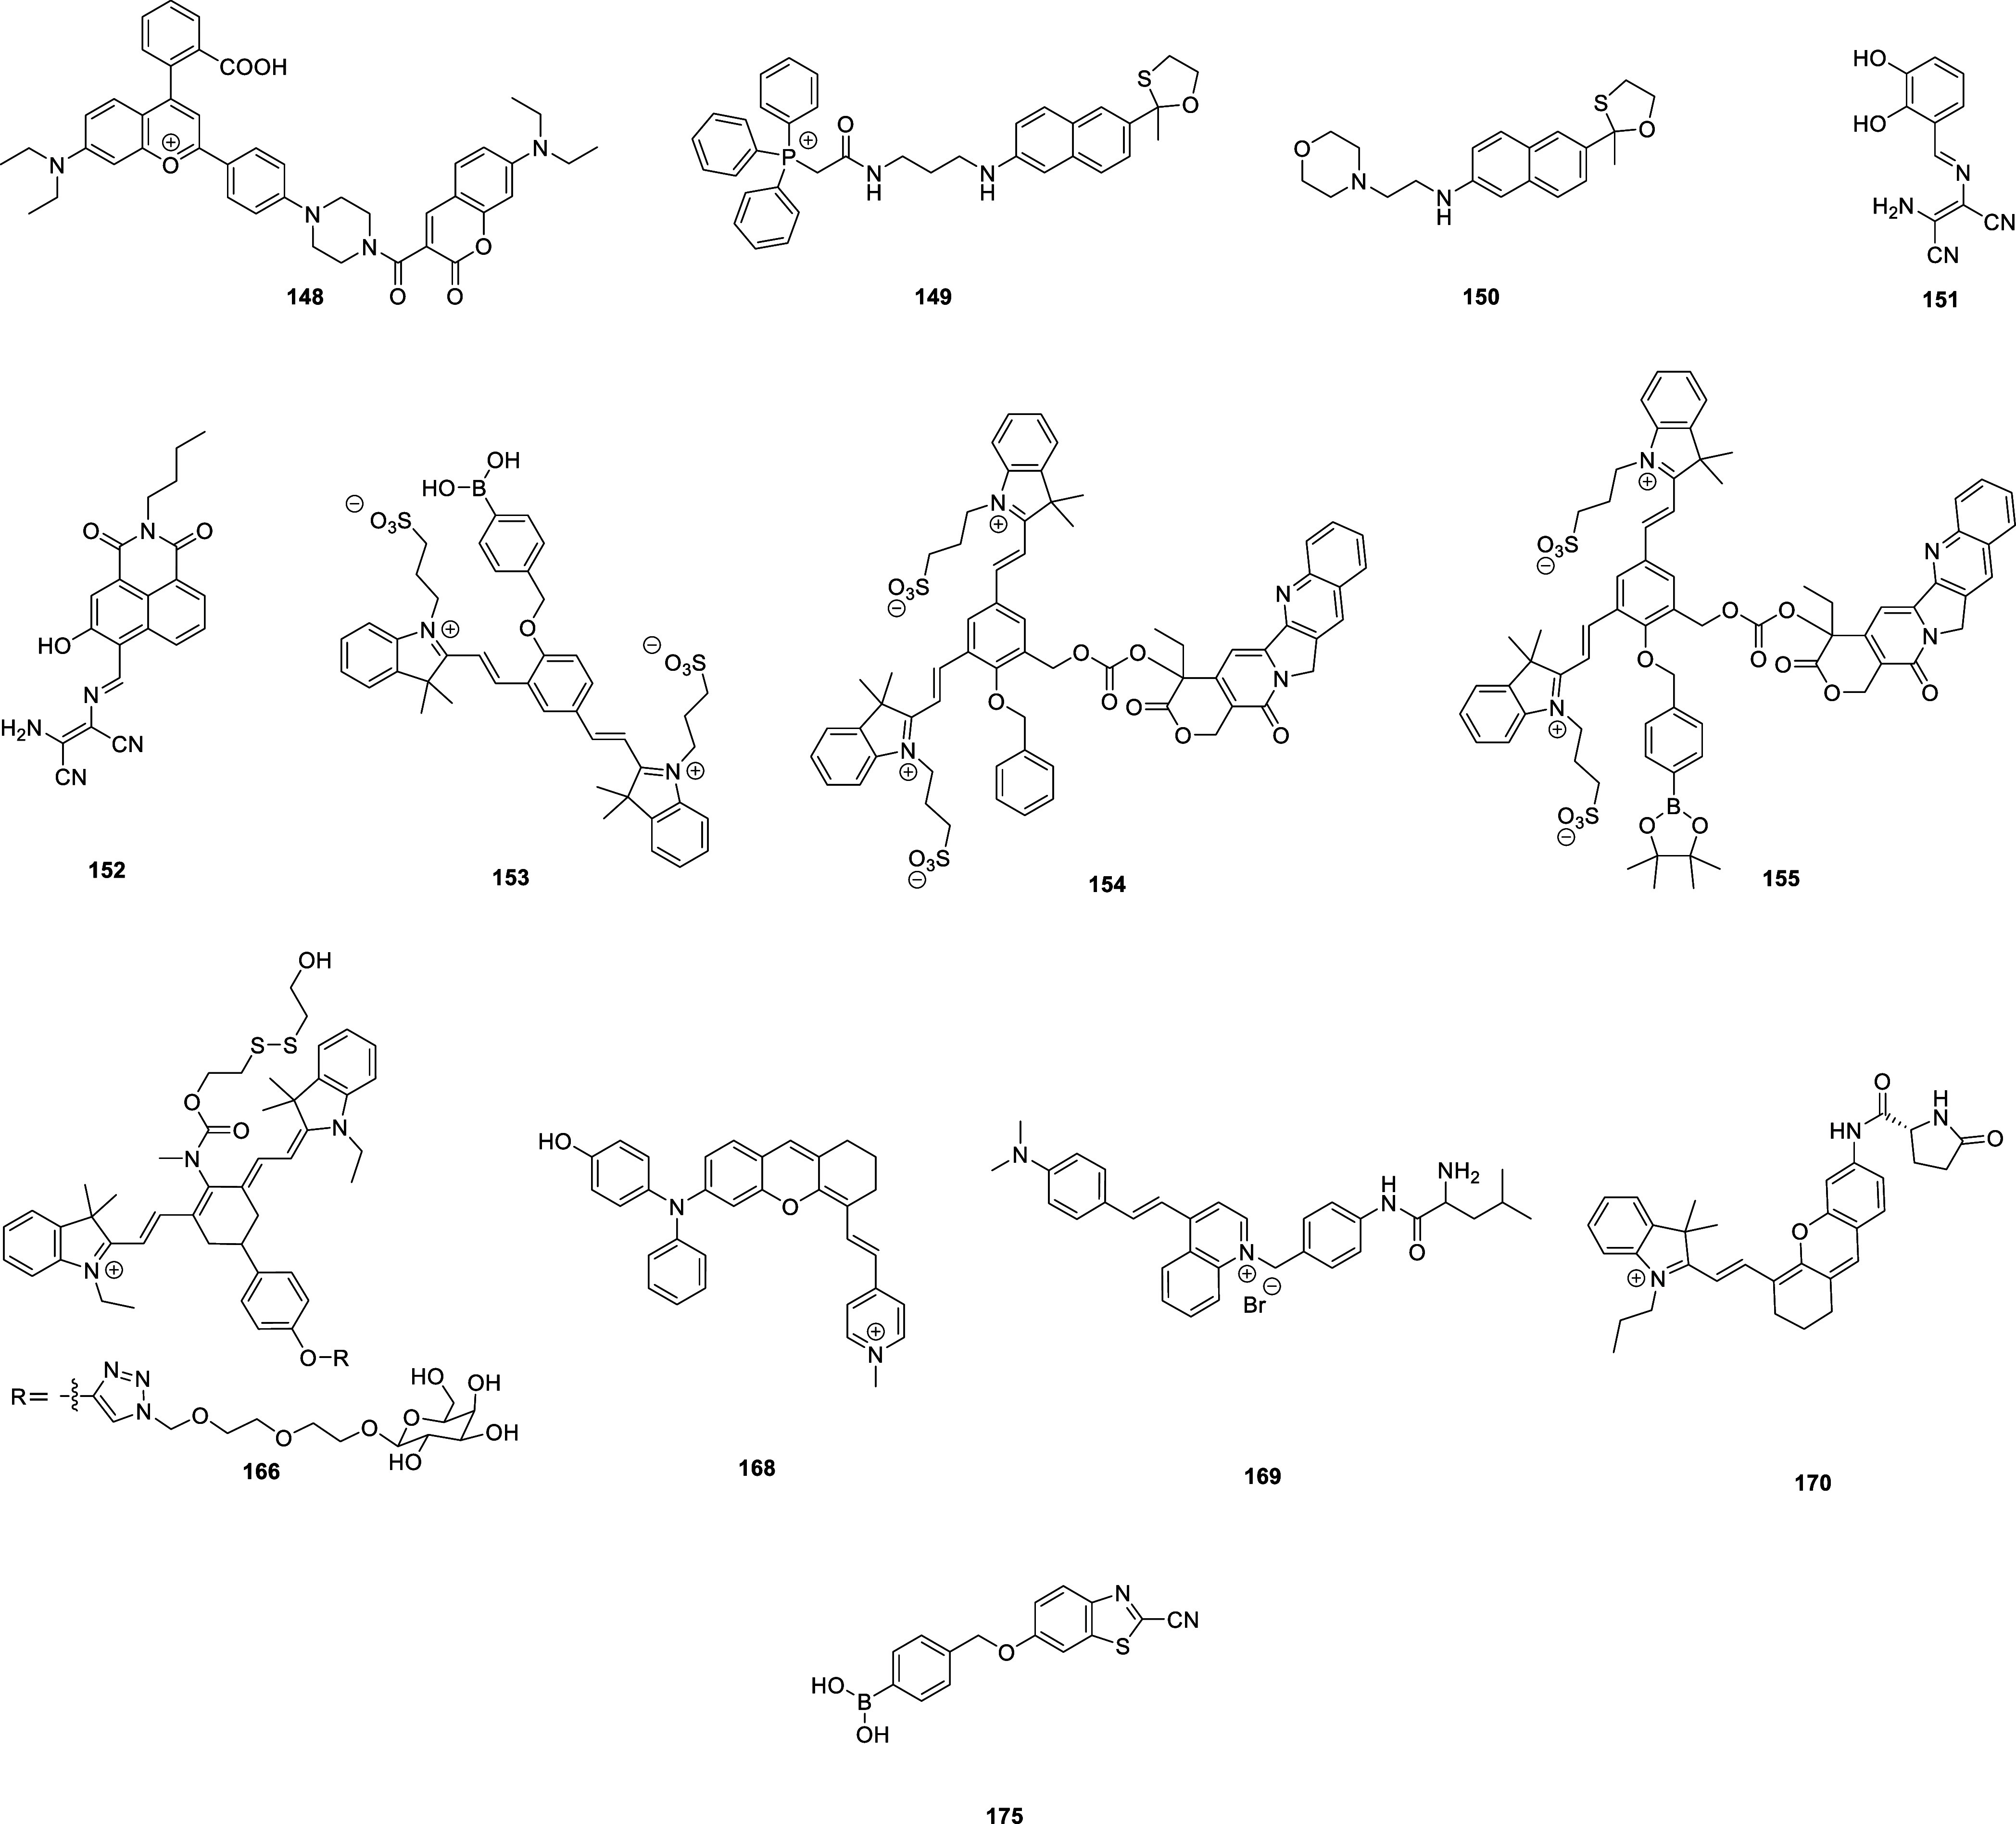
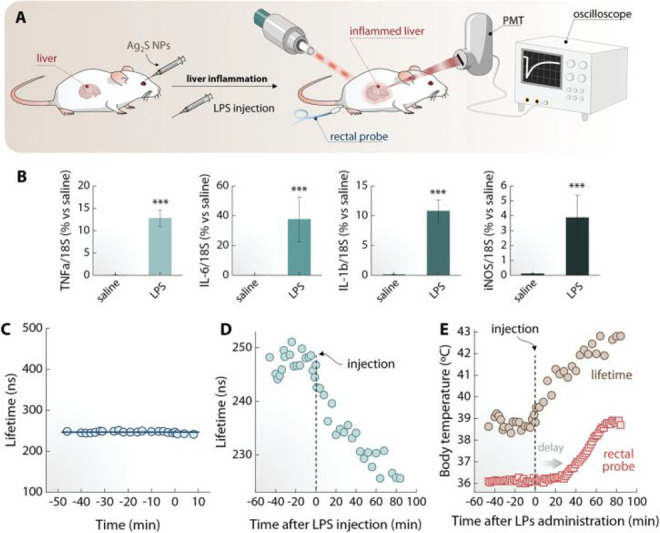
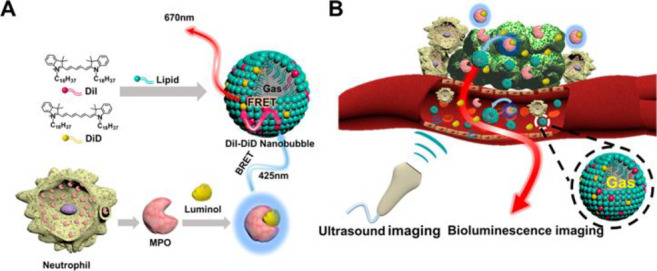
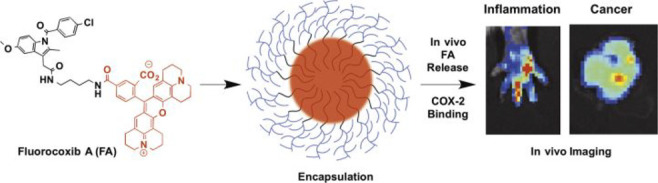
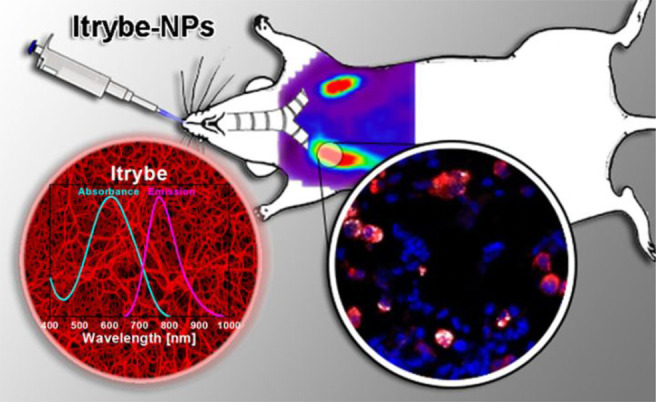
The identification and detection of disease-related biomarkers is essential for early clinical diagnosis, evaluating disease progression, and for the development of therapeutics. Possessing the advantages of high sensitivity and selectivity, fluorescent probes have become effective tools for monitoring disease-related active molecules at the cellular level and in vivo. In this review, we describe current fluorescent probes designed for the detection and quantification of key bioactive molecules associated with common diseases, such as organ damage, inflammation, cancers, cardiovascular diseases, and brain disorders. We emphasize the strategies behind the design of fluorescent probes capable of disease biomarker detection and diagnosis and cover some aspects of combined diagnostic/therapeutic strategies based on regulating disease-related molecules. This review concludes with a discussion of the challenges and outlook for fluorescent probes, highlighting future avenues of research that should enable these probes to achieve accurate detection and identification of disease-related biomarkers for biomedical research and clinical applications.


Conflict of interest statement

The authors declare no competing financial interest.

Figures

Figure 1
Figure 1
General structural features and design strategy of the fluorescent probes.
Figure 2
Figure 2
Selected fluorescent probes for Alzheimer’s disease.
Figure 3
Figure 3
In vivo fluorescence imaging of AD mice of different ages (3, 8, and 12 month) by tail injection of probe 5, showing increased ONOO concentrations in the brain with age. Reproduced with permission from ref (47). Copyright 2022 John Wiley & Sons.
Figure 4
Figure 4
Selected fluorescent probes for epilepsy.
Figure 5
Figure 5
Mapping of Cys fluxes at 5, 15, 30, 45, and 60 min in live mice with probe 8 after intraperitoneal injection of various Cys-affecting agents. Reproduced with permission from ref (53). Copyright 2020 American Chemical Society.
Figure 6
Figure 6
(a) Oxidation of CY1 (12) to CY2/CY3 by Cu2+ in acidic and alkaline solutions. (b) Use of CY1 as a copper ion detection probe in urine from WD patients, showing a change from blue to green (alkaline) or pink (acidic) on detection of Cu2+. Reproduced with permission from ref (59). Copyright 2018 American Chemical Society.
Figure 7
Figure 7
Schirhagl et al.’s probe 13 for sequential detection of Cu2+, PPi, and ALP.
Figure 8
Figure 8
Selected fluorescent probes for depression.
Figure 9
Figure 9
In situ TP fluorescence imaging with probe 15 in the brains of stress (A, 14 consecutive days of chronic-restraint stress) and control (B) mice. (C) Sketch of three different TP fluorescence imaging areas. (D) Relative fluorescence intensities of mice in A and B. Fluorescence emission window: 480–650 nm. Scale bar = 50 μm. Reproduced with permission from ref (66). Copyright 2019 American Chemical Society.
Figure 10
Figure 10
In situ TP imaging of hydroxyl radical by probe 19 in mice. Control: the mice without CUMS. CUMS: the mice susceptive to CUMS. Desferal: The susceptible mice injected with desferrioxamine. Mannitol: The susceptible mice injected with mannitol. The fluorescence images were obtained with an 800 nm light source. The 3D images (second row) were generated from a stack of cross sections (xy sections, 400 μm) with an axial (z) increment of 2 μm. Fluorescence emission windows: 400–650 nm. Scale bar = 50 μm. Reproduced with permission from ref (70). Copyright 2019 John Wiley & Sons.
Figure 11
Figure 11
Selected fluorescent probes for Parkinson’s disease.
Figure 12
Figure 12
(A) Confocal fluorescence imaging of probe 28 in the substantia nigra region of the control and PD mouse brains. Brain slices were incubated with NUU-1 (50 μM), 0.5% ethanol, and 0.1% Triton in PBS (pH = 7.4) for 2 h and then further incubated with GSH (1 mM) for additional 2 h. (B) Average fluorescence intensities for panels (1–6). Reproduced with permission from ref (81). Copyright 2021 American Chemical Society.
Figure 13
Figure 13
Schematic application of 29 for detecting ONOO in PD models. Reproduced with permission from ref (82). Copyright 2020 American Chemical Society.
Figure 14
Figure 14
Use of probe 30: (a) merged imaging DIC channel and green channel with PMT range: 470–520 nm. (b) Merged imaging DIC channel and red channel with PMT range: 620–670 nm, insert was zoom in imaging in zebrafish body. (c) Merged imaging of green and red channel. (d) Ratiometric image generated from (b/a). (e) DIC of wild-type (WT) Drosophila brain. (f) The ratio of red/green channel for WT and (g) DIC of PD Drosophila brain. (h) Red/green channel ratio for PD. Reproduced with permission from ref (83). Copyright 2018 Elsevier BV.
Figure 15
Figure 15
Selected fluorescent probes for stroke.
Figure 16
Figure 16
In vivo imaging using probe 38 of autophagy in the brain during middle cerebral artery occlusion (MCAO) at different times when subjected to different treatments: Sham group (mice not undergoing MCAO), MCAO group (mice undergoing MCAO), vehicle group (injection of saline to mice tail veins), and APO group (intraperitoneally injection with apocynin in mice). Reproduced with permission from ref (93). Copyright 2022 American Chemical Society.
Figure 17
Figure 17
(a) Design of dual-targeting probe 44. (b) Schematic diagram of probe 44 as the dual targeting system to cross the BBB and target the glioblastoma via LRP mediated endocytosis, enabling MR and UCL imaging of intracranial glioblastoma. Reproduced with permission from ref (100). Copyright 2014 American Chemical Society.
Figure 18
Figure 18
Schematic Illustration of the synthesis of multifunctional probe 45 and NIR fluorescence image and MR image. Reproduced with permission from ref (101). Copyright 2015 American Chemical Society.
Figure 19
Figure 19
(a) Schematic illustration of the construction and function of probe 47, including their mechanism of crossing the BBB and targeting glioma cells and (b) their synthesis process. Reproduced with permission from ref (103). Copyright 2021 Springer Nature.
Figure 20
Figure 20
In vivo and ex vivo imaging of glioma-bearing mice after tail intravenous injection of probe 48. (A) Whole body distribution of probe 48 as a function of time after injection. (B) Three-dimensional reconstruction of probe 48 distribution in the brain 20 min after injection. (C) Ex vivo imaging of the brain 90 min after the injection of probe 48. Reproduced with permission from ref (106). Copyright 2015 American Chemical Society.
Figure 21
Figure 21
Fluorescent imaging of tumor in rat brains 8 h after tail vein injection of PEG-QDs or NGR-PEG-QDs (probe 52). Reproduced with permission from ref (110). Copyright 2016 Elsevier.
Figure 22
Figure 22
(a) Schematic illustration of the synthesis of water-soluble dye-sensitized core–shell NaNdF4@NaLuF4/IR-808@DSPE-PEG5000 NPs (probe 54) and their energy transfer mechanism. (b) Application of these core–shell NPs in NIR-II fluorescence imaging of orthotopic glioblastoma under ultrasound-mediated opening of the BBB, and rare-earth staining of brain tissue after delivery into the brain. Reproduced with permission from ref (112). Copyright 2019 Elsevier.
Figure 23
Figure 23
Schematic diagram of the assembly and mode of action of YHM nanotherapeutics. Reproduced with permission from ref (113). Copyright 2022 Springer Nature.
Figure 24
Figure 24
Selected fluorescent probes for breast cancer.
Figure 25
Figure 25
Flow cytometric analysis (a) and mammosphere forming efficiencies (b) of fluorescent nanodiamonds positive (FND+) and fluorescent nanodiamonds negative (FND) cells. Reproduced with permission from ref (129). Copyright 2015 John Wiley & Sons.
Figure 26
Figure 26
Selected fluorescent probes for liver, lung, and ovarian cancer.
Figure 27
Figure 27
Graphene oxide fluorescent DNA material (probe 71) for the diagnosis and treatment of liver cancer. Reproduced with permission from ref (139). Copyright 2021 Wiley-VCH.
Figure 28
Figure 28
(a) Structure of UPSe (probe 74) and UPSi (probe 75). (b) Normalized fluorescence intensity as a function of pH for UPSe and UPSi nanoprobes. (c) Fluorescent images of UPSe–Cy5.5 nanoprobe solution in different pH buffers. (d) Transmission electron micrographs of UPSe nanoprobes. (e) Stability experiment of UPSe nanoprobes. Reproduced with permission from ref (144). Copyright 2014 Springer Nature.
Figure 29
Figure 29
(a) Crystal structure of Tb-ZMOF (probe 78). (b) Perspective view of the α- and β-cages in Tb-ZMOF (dots = Tb3+; lines = carboxylate). (c) Tiling representation of the rho topology of Tb-ZMOF. Reproduced with permission from ref (149). Copyright 2015 American Chemical Society.
Figure 30
Figure 30
Selected fluorescent probes for cervical and other selected forms of cancer.
Figure 31
Figure 31
Response mechanisms of probes 79 and 80 to thiols and SO2. These give several different products as indicated using small letters to identify them. Reproduced with permission from ref (151). Copyright 2006 American Chemical Society.
Figure 32
Figure 32
(a) Structure of the MMP-2-sensitive probe 93. (b) HPLC traces of peptide substrates before and after MMP-2 cleavage. Reproduced with permission from ref (166). Copyright 2001 Springer Nature.
Figure 33
Figure 33
Mechanism of action of ANNA nanoprobes (probe 94) in tumor cells. Reproduced with permission from ref (167). Copyright 2018 American Chemical Society.
Figure 34
Figure 34
Selected fluorescent probes for liver injury.
Figure 35
Figure 35
Schematic illustration of the visualization of H2S metformin-induced hepatotoxicity using probe 102. Reproduced with permission from ref (175). Copyright 2021 American Chemical Society.
Figure 36
Figure 36
NIR-II Imaging of ROS in HIRI by probes 103. Reproduced with permission from ref (176). Copyright 2022 John Wiley & Sons.
Figure 37
Figure 37
Design, synthesis, and mechanisms of probe 104 for NIRF imaging and urinalysis of HIRI. Reproduced with permission from ref (177). Copyright 2022 John Wiley & Sons.
Figure 38
Figure 38
Ratiometric ONOO detection based on probe 105 and 106. (a) Mechanism of action. (b,c) UV/vis spectra of probes containing chromophores E-CC (105) (b) and H-CC (106) (c) and upconversion emission spectra of UCNPs before and after modification under excitation at 980 nm. Reproduced with permission from ref (178). Copyright 2019 John Wiley & Sons.
Figure 39
Figure 39
Molecular structure and O2•–-activated phosphorescence of IrOTf (probe 108). Reproduced with permission from ref (183). Copyright 2022 John Wiley & Sons.
Figure 40
Figure 40
(A) Schematic depictions of the metabolic pathways of different dye-KTP conjugates in vivo, and noninvasive kidney monitoring in the NIR-II window. (B) Design of ROS-responsive probe 109 for the detection of renal dysfunction. Reproduced with permission from ref (184). Copyright 2021 John Wiley & Sons.
Figure 41
Figure 41
(a) The overall mechanism of action for the two probes, 110 and 111. (b) The chemical structures of 110 and 111 for the detection of O2•– and ONOO in AKI. R = H or CHO. Reproduced with permission from ref (185). Copyright 2020 John Wiley & Sons.
Figure 42
Figure 42
An optical probe 112 with turn-on chemiluminescence and NIR fluorescence for detecting O2•– and NAG. Reproduced with permission from ref (186). Copyright 2019 John Wiley & Sons.
Figure 43
Figure 43
Probe 113 with pH-induced charge reversal and aggregation properties for synergetic fluorescence and ultrasound diagnosis of early kidney injury, enabled by reabsorption and in situ aggregation in tubular cells of injured kidneys. Reproduced with permission from ref (188). Copyright 2021 John Wiley & Sons.
Figure 44
Figure 44
Caspase-3-mediated hydrolysis of probe 114 into fluorescent product 2-DPA2. Reproduced with permission from ref (189). Copyright 2021 American Chemical Society.
Figure 45
Figure 45
Schematic illustration and molecular mechanism of probe 115 for real-time NIRF and PA imaging of AKI. Reproduced with permission from ref (190). Copyright 2020 John Wiley & Sons.
Figure 46
Figure 46
(A) Synthesis of probe 116. (B) Characterization of probe 116 by native PAGE gel electrophoresis. (C) Schematic illustration of fluorescence imaging of Kim-1 using probe 116. Reproduced with permission from ref (191). Copyright 2022 John Wiley & Sons.
Figure 47
Figure 47
Probe 117 for real-time NIR-II fluorescence imaging of kidney dysfunction. Reproduced with permission from ref (192). Copyright 2019 John Wiley & Sons.
Figure 48
Figure 48
(A) Design and photophysical processes of self-assembled ultrasmall probe 118. (B) Use of probe 118 for bimodal imaging the progress of renal fibrosis in mice. Reproduced with permission from ref (193). Copyright 2022 John Wiley & Sons.
Figure 49
Figure 49
NIR-II brush macromolecular fluorophores. Reproduced with permission from ref (194). Copyright 2021 John Wiley & Sons.
Figure 50
Figure 50
Probe 120 for the mitochondrial imaging of hypochlorous acid in traumatic brain injury.
Figure 51
Figure 51
Probe 121 for visualizing TBI regions ONOO-triggered fluorescence response. Reproduced with permission from ref (199). Copyright 2020 John Wiley & Sons.
Figure 52
Figure 52
Probe 122 for noninvasive assessment of TBI. Reproduced with permission from ref (200). Copyright 2016 John Wiley & Sons.
Figure 53
Figure 53
(A) Schematic of ECM-targeting probe 123 and overview of experimental design. (B) VivoTag 750 surface imaging of major organs. (C) Bulk quantification of percent injected dose of nanomaterial per gram of tissue (% ID/g) based on FAM fluorescence (n = 3, mean ± SEM; ****, p ≤ 0.0001, two-way ANOVA, and Tukey’s multiple comparisons post hoc test within each organ group). Reproduced with permission from ref (201). Copyright 2017 American Chemical Society.
Figure 54
Figure 54
Schematic illustration of the use of probe 124 for SAH detection and classification. (A) Structure of probe 124 and its reaction to blood. (B) Use of probe 124 in mouse model. (C) SAH classification based on the intensity of the fluorescence observed in the brain. Reproduced with permission from ref (202). Copyright 2021 John Wiley & Sons.
Figure 55
Figure 55
Schematic diagram of bimodal (NIR + 19F MRI) probe 125 (NIR700 + PFCE) targeted toward dead cells with an 800CW ligand. Reproduced with permission from ref (203). Copyright 2016 Springer Nature.
Figure 56
Figure 56
Ex vivo imaging of superoxide production during myocardial I/R. Reproduced with permission from ref (206). Copyright 2023 Springer Nature.
Figure 57
Figure 57
Selected fluorescent probes for MI/RI.
Figure 58
Figure 58
(a) Fluorescence turn-on mechanism of 129 (NOF5). (b) Construction of the ratiometric sensor using Cy3 as an internal reference. (c) The fluorescence ratio FNOF5/FCy3 in the heart could be used to monitor the level of ONOO in the heart in real time and evaluate the antioxidant capacity of drugs in situ. Reproduced with permission from ref (209). Copyright 2022 American Chemical Society.
Figure 59
Figure 59
Intracellular visualization of HOBr using probe 130 during MI/RI. Reproduced with permission from ref (210). Copyright 2019 Royal Society of Chemistry.
Figure 60
Figure 60
Selected fluorescent probes for atherosclerosis.
Figure 61
Figure 61
Arginase 1 downregulates ONOO Reproduced with permission from ref (214). Copyright 2021 American Chemical Society.
Figure 62
Figure 62
Design of the ONOO/LD sequence-activated fluorescence probe 132. (A,B) Design strategies employed in previous work (A) and for probe 132 (B). (C) Mechanism of probe 132. (D) Intraoperative Imaging of probe 132. Reproduced with permission from ref (215). Copyright 2023 American Chemical Society.
Figure 63
Figure 63
“AND” molecular logic gate probe 133. (A) Molecular logic gates. (B,C) “AND” molecular logic gate design principles. (D) Fluorescence activation mechanism of probe 133. Reproduced with permission from ref (217). Copyright 2023 John Wiley & Sons.
Figure 64
Figure 64
β-Gal sensing mechanism of probe 134. Reproduced with permission from ref (218). Copyright 2020 American Chemical Society.
Figure 65
Figure 65
Lipid-activatable fluorescent probe 135 for intraoperative imaging of atherosclerotic plaques using in situ patches. Reproduced with permission from ref (220). Copyright 2022 John Wiley & Sons.
Figure 66
Figure 66
Schematic illustration of iSHERLOCK probe 137 for “off–on” and ratiometric detection of LDs and HClO. FY and FR represent the fluorescent intensities (FI) in the yellow and red channels, respectively. Reproduced with permission from ref (222). Copyright 2022 John Wiley & Sons.
Figure 67
Figure 67
Structures of GSH/H2O2-responsive BSA-Cy-Mito nanoprobes based on fluorescent probes 138 and 139 for in vivo PA imaging of redox state to assess atherosclerotic plaque vulnerability. Reproduced with permission from ref (223). Copyright 2019 American Chemical Society.
Figure 68
Figure 68
Synthesis of probe 140 and its application in fluorescence detection and two-photon fluorescence imaging of atherosclerotic mice. Reproduced with permission from ref (224). Copyright 2023 John Wiley & Sons.
Figure 69
Figure 69
Synthesis of nanoprobe 141 and its application for detection and imaging of phosphorylation and glucose levels in early atherosclerosis models. Reproduced with permission from ref (225). Copyright 2023 John Wiley & Sons.
Figure 70
Figure 70
(a) Structure and turn-on mechanism of the fluoroescent probe 142. (b) One-step self-assembly of RSPNs. Reproduced with permission from ref (226). Copyright 2021 American Chemical Society.
Figure 71
Figure 71
Selected probes for cardiovascular disease.
Figure 72
Figure 72
Cardiovascular disease therapy accompanied by sequential generation of NO and GSH monitored by probe 143 in human umbilical vein endothelial cells. Reproduced with permission from ref (227). Copyright 2021 American Chemical Society.
Figure 73
Figure 73
(a) Molecular design and preparation of probes 145. (b) Absorption spectra of probes 145 in DMSO. Reproduced with permission from ref (229). Copyright 2022 John Wiley & Sons.
Figure 74
Figure 74
Schematic illustration of probe 146 for ONOO imaging. Reproduced with permission from ref (230). Copyright 2018 American Chemical Society.
Figure 75
Figure 75
Schematic Illustration of 147 for NO Imaging. Reproduced with permission from ref (231). Copyright 2020 American Chemical Society.
Figure 76
Figure 76
Selected fluorescent probes for inflammatory disease and RA of mice. Probe 152 is particularly effective for evaluating the early therapeutic effects of antiarthritic drugs on HOCl levels in RA mouse models.
Figure 77
Figure 77
(a) Schematic illustration of probe 156 applied for specific in vivo inflammation imaging. (b) Time-dependent in vivo fluorescence images of inflammation-bearing mice before and after iv injection of probe 156. The white circles indicate the MRSA-infected region. Reproduced with permission from ref (237). Copyright 2016 John Wiley & Sons.
Figure 78
Figure 78
Design and functional principles of nanoprobe 157 for reversible ratiometric photoacoustic imaging of the •OH/H2S the redox cycle. Reproduced with permission from ref (238). Copyright 2022 John Wiley & Sons.
Figure 79
Figure 79
Preparation and use of nanoprobe 158 and its application for sensing H2O2 in interstitial cystitis. Reproduced with permission from ref (239). Copyright 2021 Springer Nature.
Figure 80
Figure 80
Schematic illustration of multifunctional probe 159 for diagnosis and therapy of acute liver inflammatory diseases. Reproduced with permission from ref (240). Copyright 2021 John Wiley & Sons.
Figure 81
Figure 81
Orally administered nanosensor probe 160 dissociates into ultrasmall platinum nanoclusters in IBD-related inflammatory microenvironments for renal clearance and noninvasive urinary readout. Reproduced with permission from ref (241). Copyright 2022 American Chemical Society.
Figure 82
Figure 82
(a) Preparation and assembly of probe 161, and its response to NO and acidity with DTP-BBTD as an internal reference. (b) Activation of the fluorescence signal at 940 nm and the PA signal at 720 nm of probe 161 in IBD mice by endogenous NO. Reproduced with permission from ref (242). Copyright 2023 Elsevier BV.
Figure 83
Figure 83
Prednisolone (Pred) is bridged to a two-photon fluorophore (TP) developed using a ROS sensitive bond to form a diagnosis-therapeutic compound TPP, which is then loaded by the amphipathic polymer PMPC–PMEMA (PMM) through self-assembling into the core–shell structured micelles (probe 162). With a particle size of 57.5 nm, probe 162 can realize the accumulation in the inflammatory site via the oedematous tissue and the accurate release of anti-inflammatory drug Pred through the serial response to the local overexpressed ROS. Reproduced with permission from ref (243). Copyright 2020 American Chemical Society.
Figure 84
Figure 84
(A) Preparation of BH-EGCG@MM and BH-EGCG&NAC@MM. (B) Response mechanism of BH-EGCG toward ROS. (C) Multifunctional activity of BH-EGCG&NAC@MM, including diagnosis of ConA-induced autoimmune hepatitis and CAR-induced hind paw edema via NIR fluorescent imaging and optoacoustic imaging, and efficient therapy of ConA-induced acute autoimmune hepatitis and CAR-induced hind paw edema via inhibiting NF-κB pathway and suppressing NLRP3 inflammasome formation. Reproduced with permission from ref (244). Copyright 2022 Elsevier BV.
Figure 85
Figure 85
(a) Preparation of probe 164. (b) Working principle of probe 164 for generating emission in the presence of H2O2. (c) Structure of fluorophores BTD540, BBTD700, and F127. Reproduced with permission from ref (245). Copyright 2020 John Wiley & Sons.
Figure 86
Figure 86
(A) pH- and H2O2-responsive polymeric materials control the fluorescent intensity and spectral profile IR-780 dye molecules. Particles disassemble under acidic and/or oxidative stress conditions as the modified polymers return to their native water-soluble state, which releases large amounts of dyes, relieves self-quenching, and triggers fluorescence activation. (B) The nanoprobes remain “off” in blood and healthy tissue and are turned “on” by extracellular acidosis and oxidative stress in damaged/pathogenic tissue. Reproduced with permission from ref (246). Copyright 2017 Elsevier BV.
Figure 87
Figure 87
(A) Schematic representation of the experimental procedure for monitoring liver temperature during LPS-induced inflammation using Ag2S nanoparticles (167). (B) Gene expression of proinflammatory markers (TNF-a, IL-6, IL-1b, and iNOS) in hepatic tissue after LPS injection (*** Pv < v0.001 vs saline). (C) Time evolution of the fluorescence lifetime before LPS injection. (D) Time evolution of the fluorescence lifetime after LPS injection. (E) Time evolution of liver temperature after LPS injection (brown circles) and rectal temperature (red squares). Reproduced with permission from ref (248). Copyright 2022 John Wiley & Sons.
Figure 88
Figure 88
Schematic illustration of luminol + probe 171 for dual-modal imaging of MPO activity. Reproduced with permission from ref (253). Copyright 2019 American Chemical Society.
Figure 89
Figure 89
ROS-responsive micellar nanoparticle which solubilize FcA for COX-2 visualization in vivo. Reproduced with permission from ref (254). Copyright 2016 Elsevier BV.
Figure 90
Figure 90
In vivo and ex vivo fluorescence reflectance imaging of an ovalbumin-based allergic airway inflammation using intranasal application of probe 174 for imaging alveolar M2 macrophages. Reproduced with permission from ref (256). Copyright 2015 American Chemical Society.
Figure 91
Figure 91
Design strategy behind probe 175 for simultaneous detection of H2O2 and caspase 8 activity through release of HCBT and d-cysteine and in situ formation of firefly luciferin. Reproduced with permission from ref (257). Copyright 2013 American Chemical Society.
Figure 92
Figure 92
(a) Schematic of the NE-mediated NIR-II AIE dots for brain inflammation imaging. (b) NIR-II fluorescence images with different cell number (1000 nm LP, 50 ms). (c) Average fluorescence signals at cell number of 5 × 10⁵. (d) Subcutaneous fluorescence images with different cell number. (e) Average fluorescence signals of the data from (d). Reproduced with permission from ref (258). Copyright 2020 John Wiley & Sons.

Similar articles

Cited by

References

    1. Xu W.; Zeng Z.; Jiang J. H.; Chang Y. T.; Yuan L. Discerning the Chemistry in Individual Organelles with Small-Molecule Fluorescent Probes. Angew. Chem., Int. Ed. 2016, 55, 13658–13699. 10.1002/anie.201510721. - DOI - PubMed
    1. Sun E.; Shi Y. MicroRNAs: Small Molecules with Big Roles in Neurodevelopment and Diseases. Exp. Neurol. 2015, 268, 46–53. 10.1016/j.expneurol.2014.08.005. - DOI - PubMed
    1. Maire E.; Withers P. J. Quantitative X-ray Tomography. Int. Mater. Rev. 2014, 59, 1–43. 10.1179/1743280413Y.0000000023. - DOI
    1. Richardson J. C.; Bowtell R. W.; Mäder K.; Melia C. D. Pharmaceutical Applications of Magnetic Resonance Imaging (MRI). Adv. Drug Delivery Rev. 2005, 57, 1191–1209. 10.1016/j.addr.2005.01.024. - DOI - PubMed
    1. Shung K. K. High Frequency Ultrasonic Imaging. J. Med. Ultrasound 2009, 17, 25–30. 10.1016/S0929-6441(09)60012-6. - DOI - PMC - PubMed