. 2024 Jul 16;30(8):1089-1105.
doi: 10.1261/rna.080027.124.

Transcription factors ERα and Sox2 have differing multiphasic DNA- and RNA-binding mechanisms

Affiliations

Transcription factors ERα and Sox2 have differing multiphasic DNA- and RNA-binding mechanisms

Wayne O Hemphill et al. RNA. .

Abstract

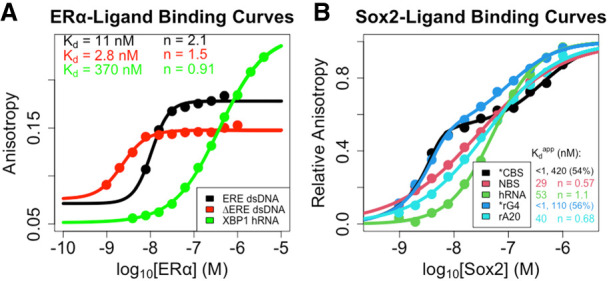
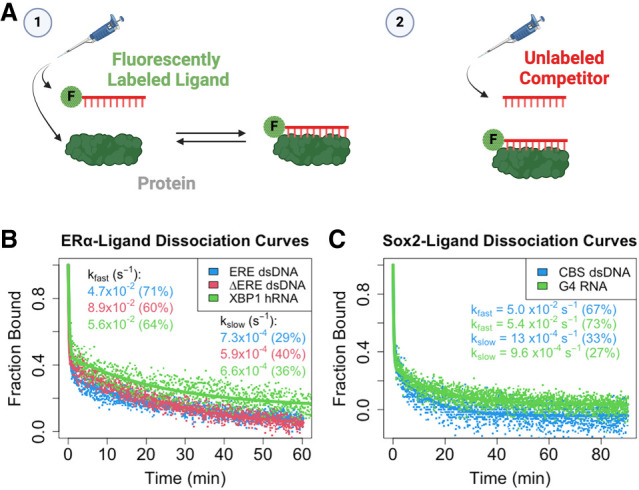
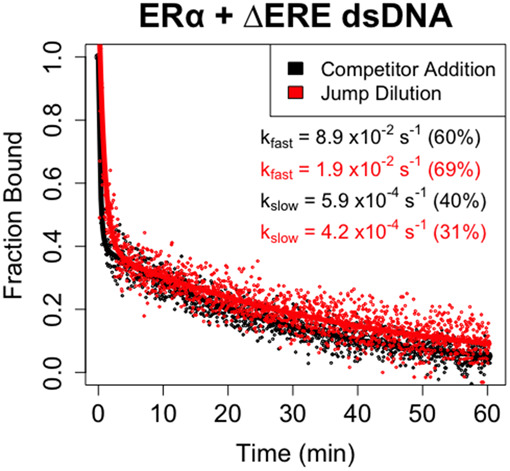
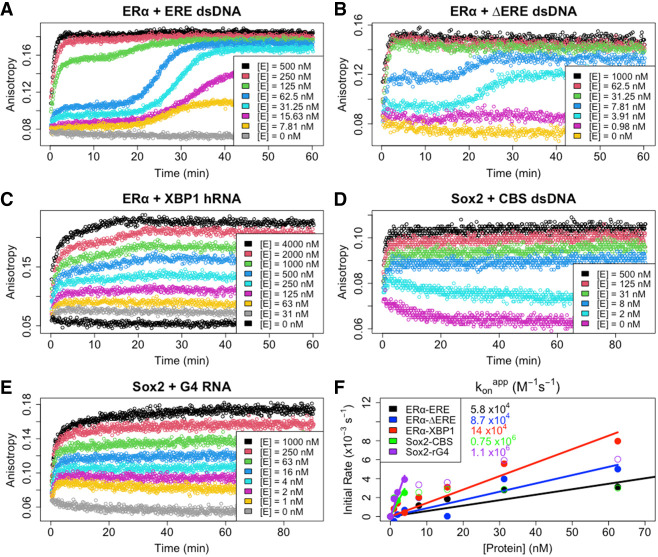
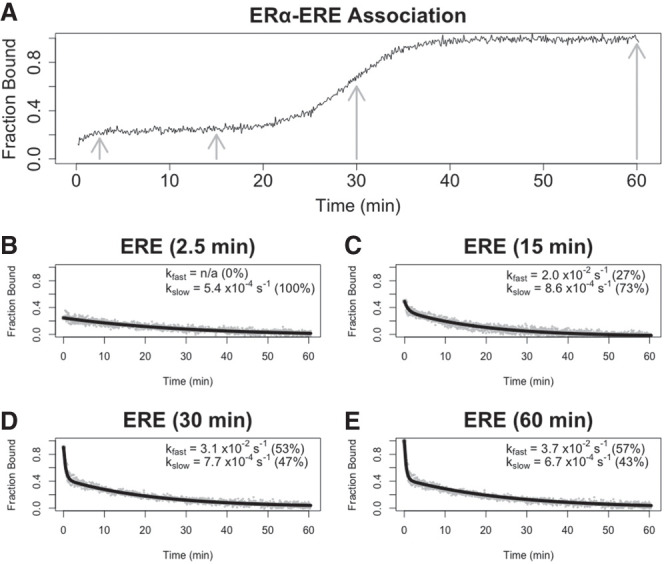
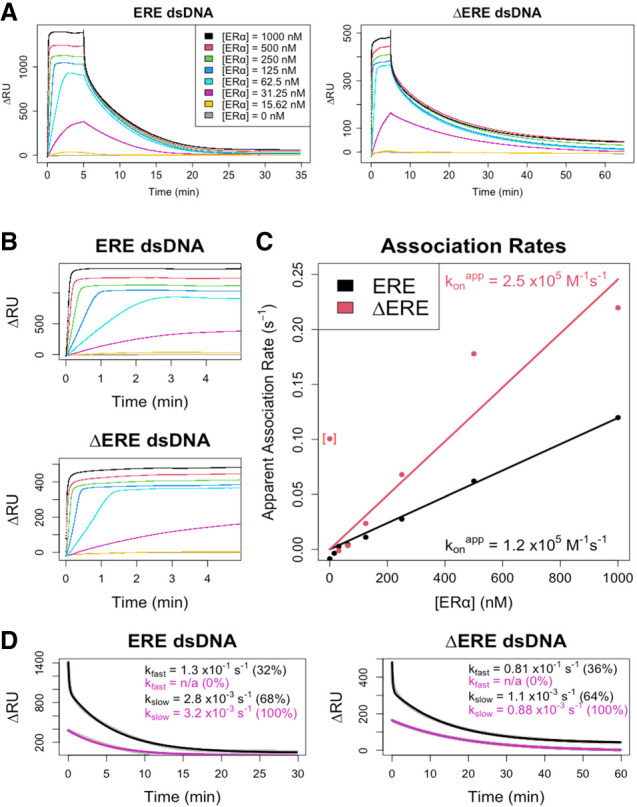
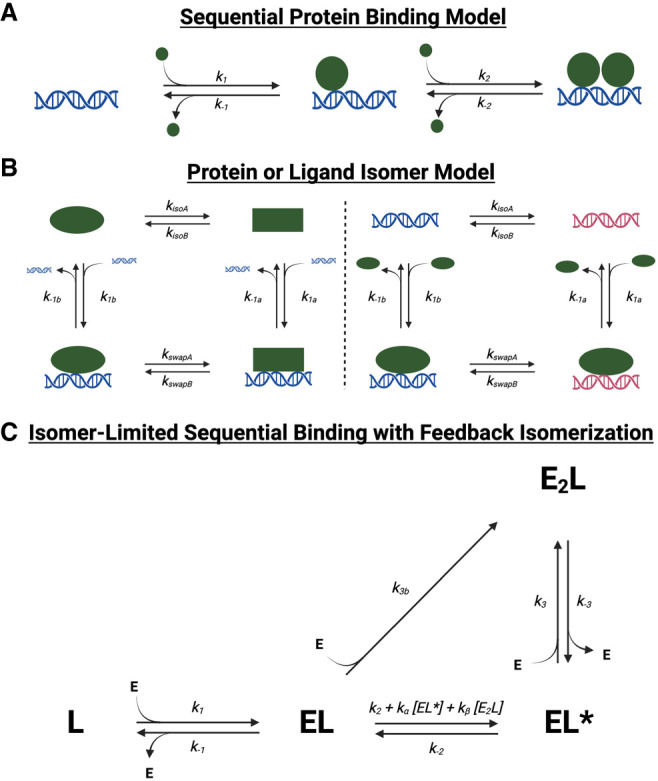
Many transcription factors (TFs) have been shown to bind RNA, leading to open questions regarding the mechanism(s) of this RNA binding and its role in regulating TF activities. Here, we use biophysical assays to interrogate the k on, k off, and K d for DNA and RNA binding of two model human TFs, ERα and Sox2. Unexpectedly, we found that both proteins exhibit multiphasic nucleic acid-binding kinetics. We propose that Sox2 RNA and DNA multiphasic binding kinetics can be explained by a conventional model for sequential Sox2 monomer association and dissociation. In contrast, ERα nucleic acid binding exhibited biphasic dissociation paired with novel triphasic association behavior, in which two apparent binding transitions are separated by a 10-20 min "lag" phase depending on protein concentration. We considered several conventional models for the observed kinetic behavior, none of which adequately explained all the ERα nucleic acid-binding data. Instead, simulations with a model incorporating sequential ERα monomer association, ERα nucleic acid complex isomerization, and product "feedback" on isomerization rate recapitulated the general kinetic trends for both ERα DNA and RNA binding. Collectively, our findings reveal that Sox2 and ERα bind RNA and DNA with previously unappreciated multiphasic binding kinetics, and that their reaction mechanisms differ with ERα binding nucleic acids via a novel reaction mechanism.

Keywords: DNA; RNA; kinetics; transcription factor.


Figures

FIGURE 1.
FIGURE 1.
(A) ERαDBD-Ext- and (B) Sox2HMG-ligand-binding affinities. Equilibrium (end point) anisotropy values are plotted as function of protein concentration. Equilibrium data were fit to the Hill binding equation (Equation 1) or two-transition binding equation (Equation 2) via regression on linear axes to determine the apparent equilibrium dissociation constants (Kdapp) and Hill coefficients (n). Values for Kdapp are in units of nanomolarity (nM). Dots are data points, and solid lines are regression fits. Data are from a single experiment for each ligand, and binding constant values are the average of independent experiments (one to three per interaction; see Table 1 for error analysis). We note that the ΔERE Kdapp is approximately half the ligand concentration for the assay, suggesting that the true Kd may be even lower, and that the apparent Hill coefficient (n) may be slightly inflated by the anomalous tight-binding curve. Thus, we make no assertion of positive cooperativity for the ERαDBD-Ex–ΔERE interaction. (*) Two-transition binding curves with Kdapp values shown alongside the proportion of the binding signal dynamic range attributable to the lower Kdapp; no applicable Hill coefficient values.
FIGURE 2.
FIGURE 2.
ERαDBD-Ext and Sox2HMG exhibit multiphasic ligand dissociation. (A) Graphical summary of FPCD experiments. (1) Fluorescently labeled polynucleotide is mixed with protein and incubated at 4°C for a variable amount of time, and then (2) an excess of unlabeled polynucleotide (i.e., competitor) is added to the protein–ligand reaction and polarization is monitored over time (at 4°C) to observe protein–ligand dissociation kinetics. (B,C) Dissociation curves from FPCD experiments. FPCD experiments (A) were performed using 5 nM ligand, 10 µM competitor, and 100–500 nM protein; protein–nucleic acid–binding reactions were incubated long enough to reach equilibrium before competitor addition. Anisotropy traces were normalized to the internal controls to give “Fraction Bound” over time, and then normalized data were fit with biexponential regression (Equation 5) to determine rate constants. Dots are data points and solid lines are regression fits from a single experiment for each ligand. Rate constants and (in parentheses) the percent contributions of fast versus slow components to the biexponential regression are reported with error in Table 1.
FIGURE 3.
FIGURE 3.
ERαDBD-Ext multiphasic ligand dissociation is independent of competitor. Dissociation curves from FPCD versus FPJD experiments. FPJD experiments were performed for the ERαDBD-Ext–ΔERE interaction using 50 nM ligand and 50 nM protein (predilution), with protein–ligand reactions being incubated to equilibrium before dilution. The protein–polynucleotide reaction was then diluted ∼80-fold in buffer (at 4°C) and polarization was monitored over time postdilution (at 4°C) to quantify protein–ligand dissociation kinetics. FPCD experiments were performed as described in Figure 2. Anisotropy traces were normalized to the controls to give “Fraction Bound” over time, and then normalized data were fit with biexponential regression to determine rate constants. Dots are data points and solid lines are regression fits (Equation 5) from single experiments. Rate constants are the average values from all independent experiments (two for FPCD, three for FPJD), with percent contributions of fast and slow components to the biexponential curve in parentheses. Error analyses for FPCD values are in Table 1, and for FPJD kfast = 1.9 ± 0.91 × 10⁻² sec−1, kslow = 4.2 ± 1.2 × 10⁻⁴ sec−1 (mean ± ½ range).
FIGURE 4.
FIGURE 4.
ERαDBD-Ext, but not Sox2HMG, exhibits multiphasic target DNA association. (AE) FP-based association curves. Protein–ligand reactions were prepared after thermal equilibration (4°C), and anisotropy was monitored over time immediately after protein addition to quantify association kinetics. Ligand concentrations were 5 nM, and protein concentrations [E] are indicated. Data are from single representative experiments (of one to three per protein–ligand interaction). The first 10–45 min of association data were subjected to regression with an equation for monophasic (Equation 3) or biphasic (Equation 4) association; the regression fits are shown in Supplemental Figure S3. (F) Association rate constant analysis. Apparent initial association rates were determined with smoothing spline regression (see Materials and Methods) and are plotted as a function of protein concentration. Each interaction has an initial linear component, followed by a plateau in apparent association rate at higher protein concentrations, which corresponds to the incomplete association curves seen at higher protein concentrations because of methodological limitations. Apparent association rates from these linear stages were used for zero-intercept linear regression to calculate apparent association rate constants (konapp). Filled circles are data points used for linear regression, open circles are data points excluded from linear regression, and solid lines are linear regression fits. Rate constants are reported with any error in Table 1.
FIGURE 5.
FIGURE 5.
The more stable complex state forms first during multiphasic ERαDBD-Ext ligand association. (A) Normalized ERαDBD-Ext association curve. Normalized association curve of 30 nM ERαDBD-Ext and 2 nM ERE dsDNA, taken from Figure 4A. Gray arrows correspond to incubation times before competitor addition in BE experiments. (BE) Dissociation curves from FPCD experiments in which a competitor was added after variable protein–ligand incubation times. FPCD experiments (see Fig. 2A) were performed for the ERαDBD-Ext–ERE interaction using 2 nM ligand, 10 µM competitor, and 30 nM protein; protein–ligand reactions were incubated for 2.5 min (B), 15 min (C), 30 min (D), or 60 min (E) before competitor addition. Anisotropy traces were normalized to the internal controls to give “Fraction Bound” over time, and then normalized data were fit with biexponential regression (Equation 5) to determine rate constants. Gray dots are data points and solid black lines are regression fits from single experiments. Percent contributions of fast versus slow components to the biexponential curve are in parentheses. Rate constant values are from single independent experiments.
FIGURE 6.
FIGURE 6.
Surface plasmon resonance confirms multiphasic ERαDBD-Ext-dsDNA binding kinetics. (A) Normalized SPR traces are shown for the association and dissociation phases. The change in RU signal after ERαDBD-Ext injection (ΔRU), which excludes changes observed in the empty flow cell, is shown as a function of time postinjection. Legends indicate the concentration of ERαDBD-Ext used during protein injection. Lines are data, not regression fits. (B) ERαDBD-Ext ligand association curves. SPR association phase curves, taken from A with the same color scheme. (C) Association rate analysis. Association curves from B had their initial slopes normalized to their signal dynamic range to calculate their apparent association rates (see Materials and Methods). Plots of apparent initial association rates versus protein concentrations were fit with zero-intercept linear regression to calculate apparent initial association rate constants (konapp). Dots are data and solid lines are linear regression fits. Bracketed data point is an outlier from the initial slope quantification of the 16 nM association curve in B, which has negligible signal dynamic range. (D) Dissociation rate analysis. SPR dissociation phase curves, taken from A, with the same color scheme. Two key protein concentrations (1 µM and 30 nM) are shown. Data were fit with biexponential regression (Equation 5) to determine rate constants. Gray dots are data and solid black/purple lines are regression fits; data points are mostly obscured by regression lines. Percent contributions of fast versus slow components to the biexponential curve are in parentheses. All SPR data in this figure are from a single experiment per ligand.
FIGURE 7.
FIGURE 7.
Various reaction schemes that predict biphasic protein–ligand dissociation. (A) Sequential protein-binding model. After initial protein–ligand association, additional protein can associate with the complex to form higher stoichiometry complexes. If the complex states with differing stoichiometries also have differing stabilities, multiphasic dissociation kinetics can be produced. If protein associates at differing rates with ligand versus existing complex, multiphasic association kinetics can be produced. Based on this model, rate constants for Sox2HMG CBS dsDNA binding are inferred to be k1,2 ≈ 8 × 10⁵ M−1 sec−1, k−1 ≈ 1 × 10⁻³ sec−1, and k−2 ≈ 5 × 10⁻² sec−1. The rate constants for Sox2HMG G4 RNA binding are inferred to be k1 ≈ 1 × 10⁶ M−1 sec−1, k2 ≈ 7 × 10⁴ M−1 sec−1, k−1 ≈ 1 × 10⁻³ sec−1, and k−2 ≈ 5 × 10⁻² sec−1. (B) Protein or ligand isomer model. The protein (left) or ligand (right) may isomerize to an alternative state, which produces different protein–ligand association and/or dissociation rates. (C) Isomer-limited sequential binding with feedback isomerization. After initial protein–ligand association to form a stable complex (EL), protein can inefficiently associate with the initial complex to form a higher-order stoichiometry complex (E2L), or the initial complex can isomerize to an alternative complex state (EL*) that can more readily accommodate additional protein monomers. Complex isomerization is intrinsically slow but may be accelerated by “feedback” from isomerized complex or higher-order stoichiometry complex. Such a reaction scheme could produce monophasic, biphasic, or “lagged” triphasic association and monophasic, biphasic, or triphasic dissociation, depending on specific values of rate constants. E is a monomer of free protein, and L is free ligand.
Jackson R. Kominsky
Jackson R. Kominsky
Wayne O. Hemphill
Wayne O. Hemphill
Halley R. Steiner
Halley R. Steiner

Update of

Similar articles

Cited by

References

    1. Alluri PG, Speers C, Chinnaiyan AM. 2014. Estrogen receptor mutations and their role in breast cancer progression. Breast Cancer Res 16: 494. 10.1186/s13058-014-0494-7 - DOI - PMC - PubMed
    1. Avilion AA, Nicolis SK, Pevny LH, Perez L, Vivian N, Lovell-Badge R. 2003. Multipotent cell lineages in early mouse development depend on SOX2 function. Genes Dev 17: 126–140. 10.1101/gad.224503 - DOI - PMC - PubMed
    1. Björnström L, Sjöberg M. 2005. Mechanisms of estrogen receptor signaling: convergence of genomic and nongenomic actions on target genes. Mol Endocrinol 19: 833–842. 10.1210/me.2004-0486 - DOI - PubMed
    1. Chassaing N, Causse A, Vigouroux A, Delahaye A, Alessandri J-L, Boespflug-Tanguy O, Boute-Benejean O, Dollfus H, Duban-Bedu B, Gilbert-Dussardier B, et al. 2014. Molecular findings and clinical data in a cohort of 150 patients with anophthalmia/microphthalmia. Clin Genet 86: 326–334. 10.1111/cge.12275 - DOI - PubMed
    1. Chew J-L, Loh Y-H, Zhang W, Chen X, Tam W-L, Yeap L-S, Li P, Ang Y-S, Lim B, Robson P, et al. 2005. Reciprocal transcriptional regulation of Pou5f1 and Sox2 via the Oct4/Sox2 complex in embryonic stem cells. Mol Cell Biol 25: 6031–6046. 10.1128/MCB.25.14.6031-6046.2005 - DOI - PMC - PubMed

LinkOut - more resources