. 2024 May 17;7(8):e202302307.
doi: 10.26508/lsa.202302307. Print 2024 Aug.

The F-actin bundler SWAP-70 promotes tumor metastasis

Affiliations

The F-actin bundler SWAP-70 promotes tumor metastasis

Chao-Yuan Chang et al. Life Sci Alliance. .

Abstract

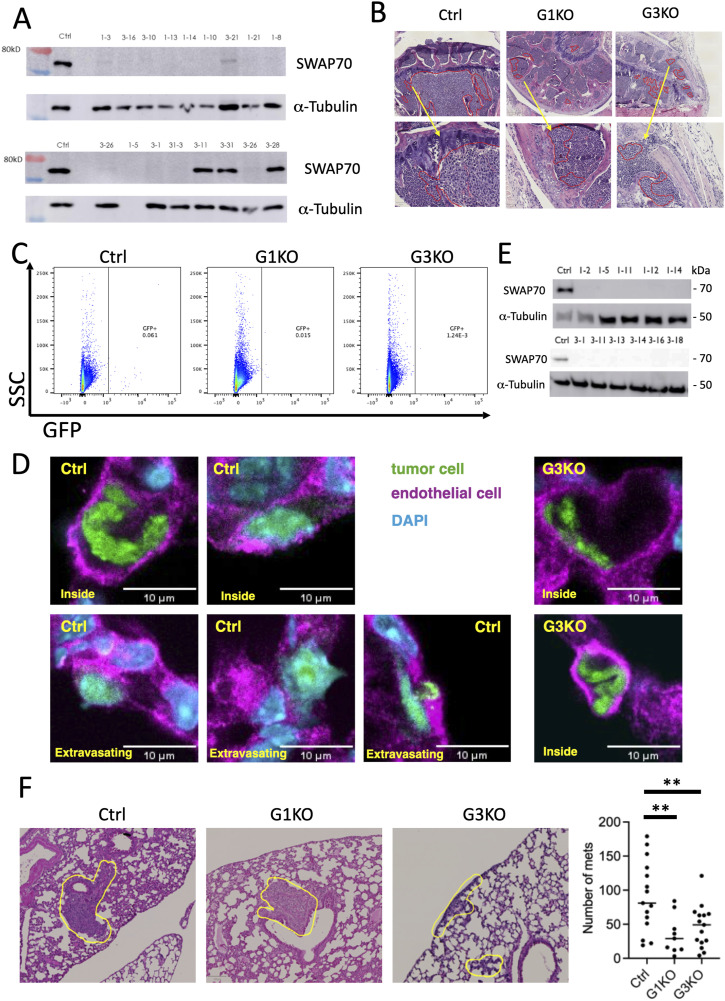
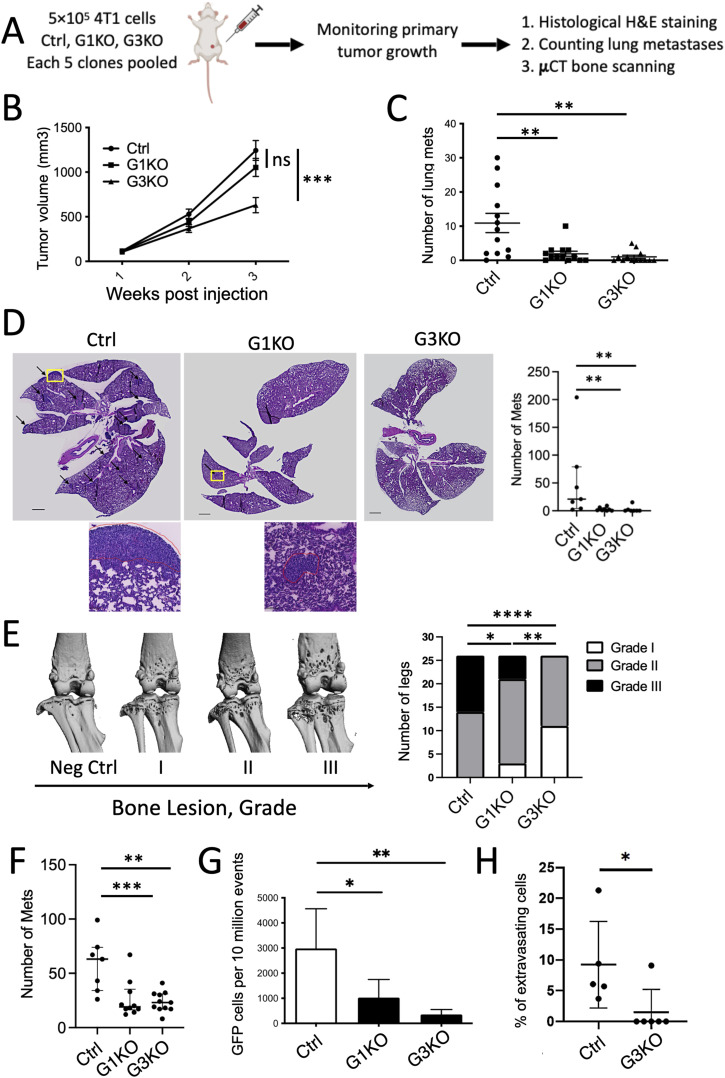
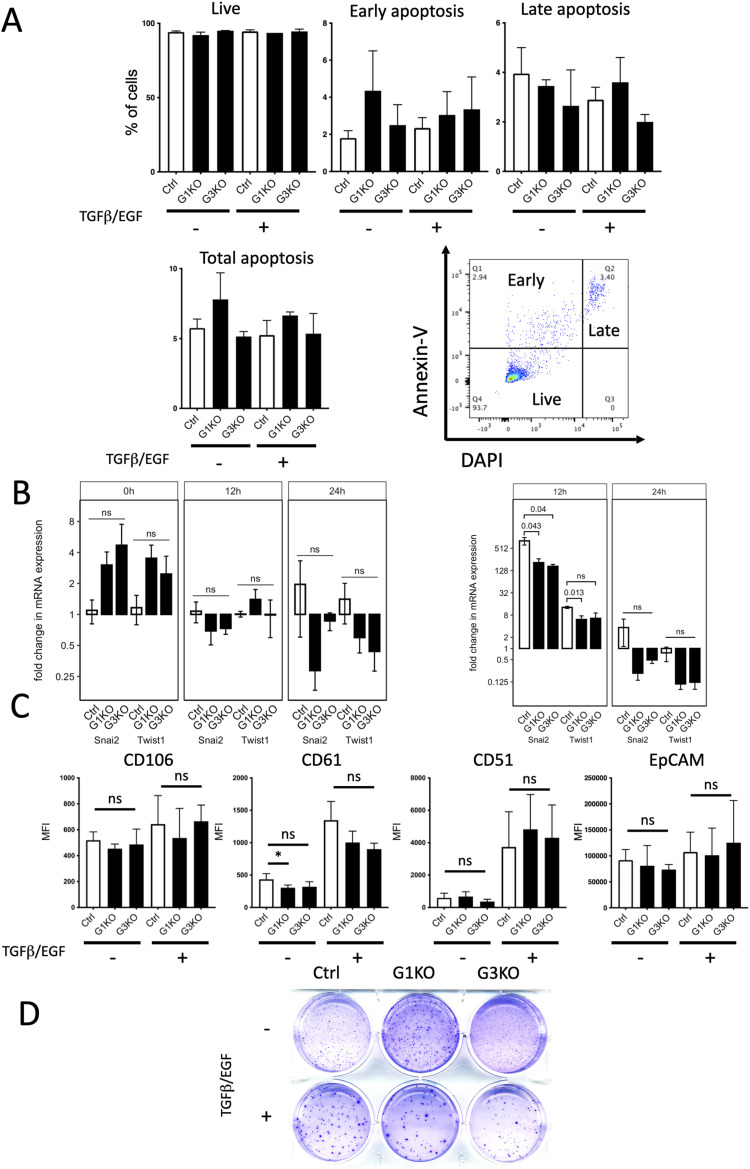
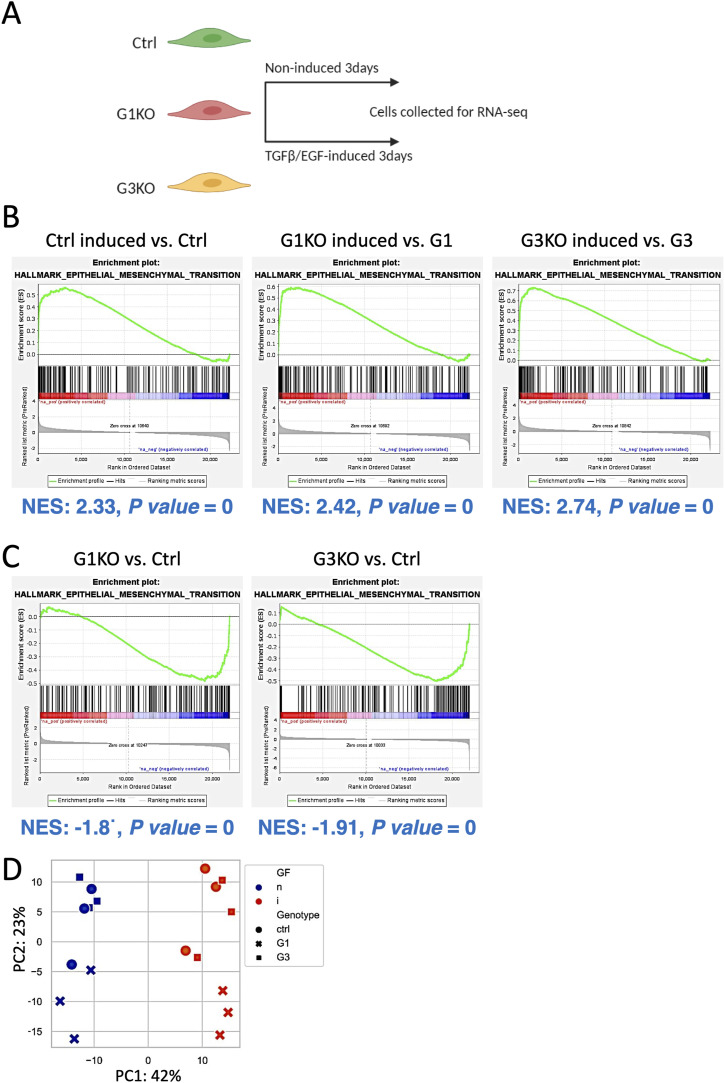
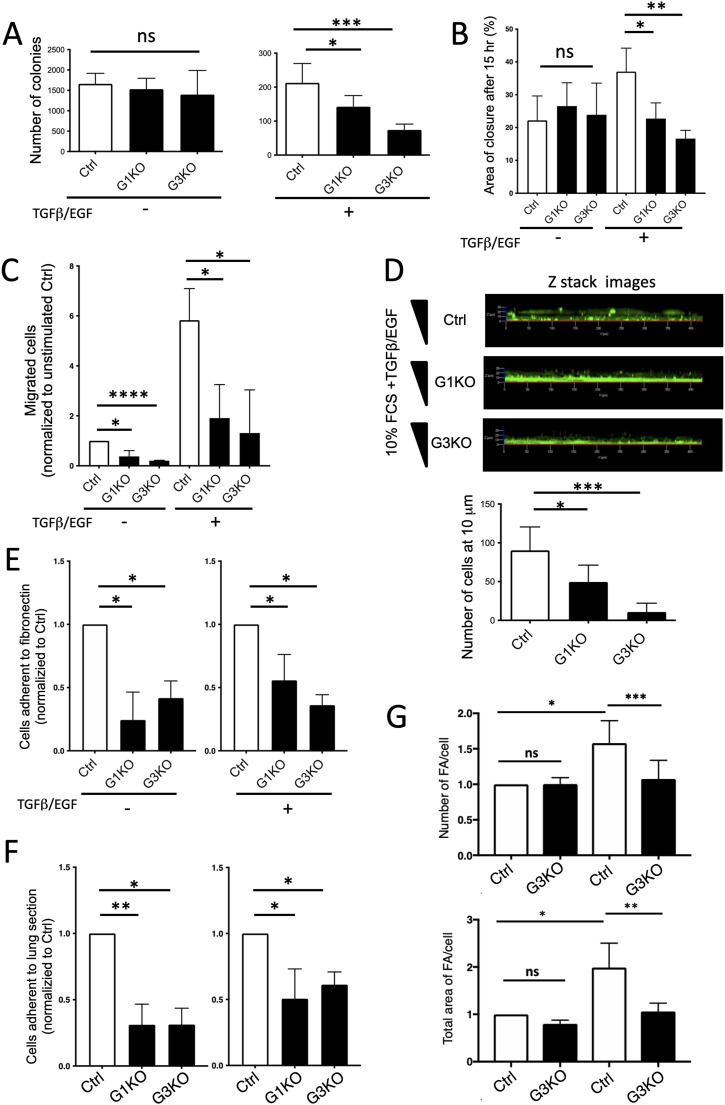
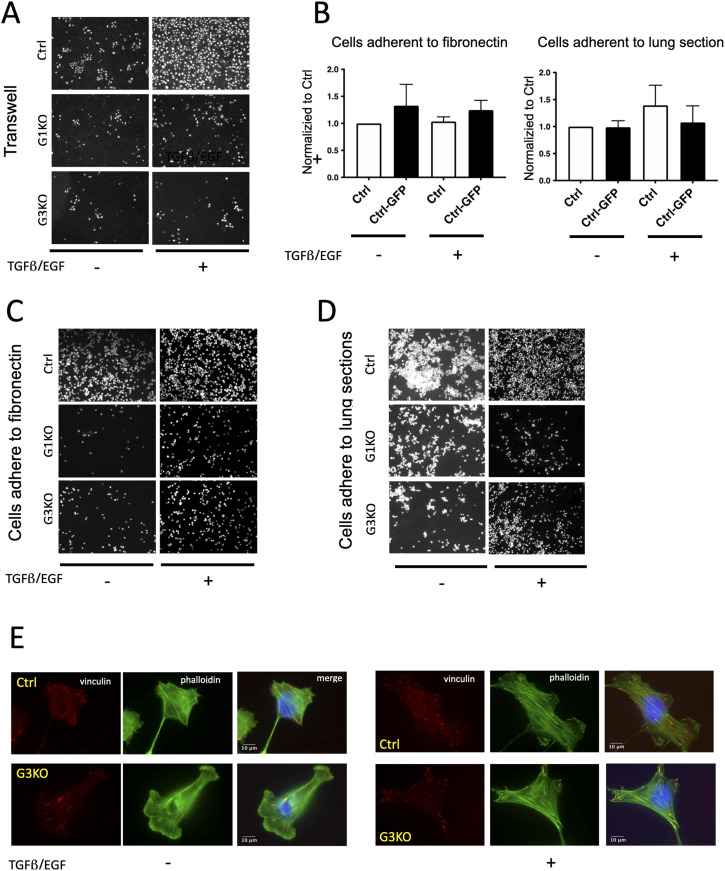
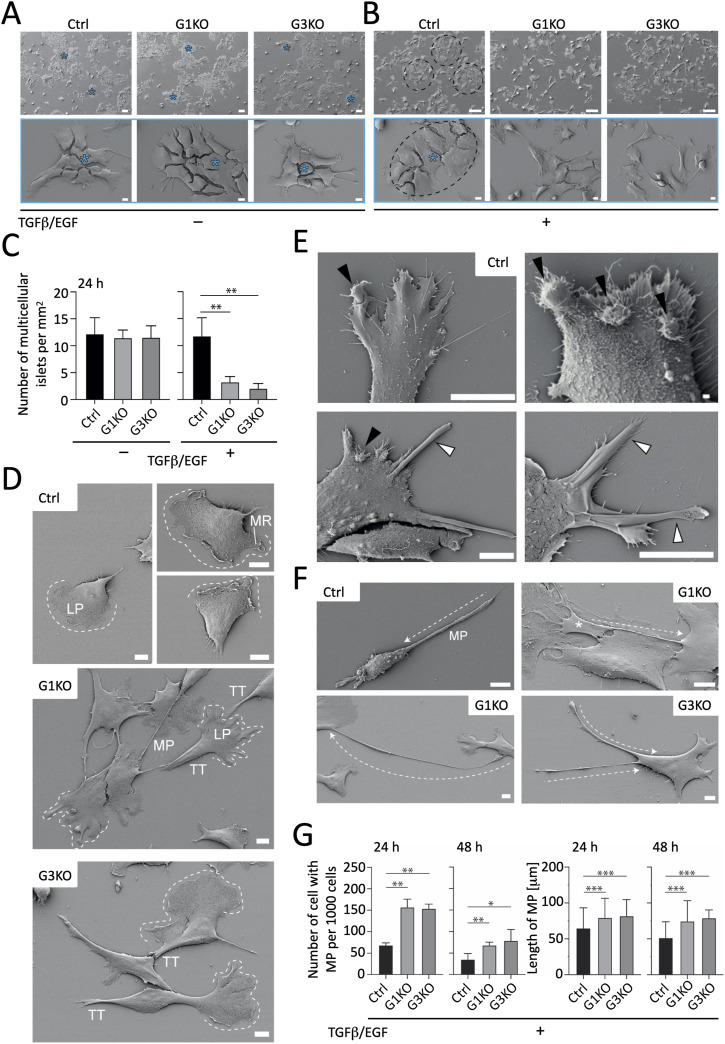
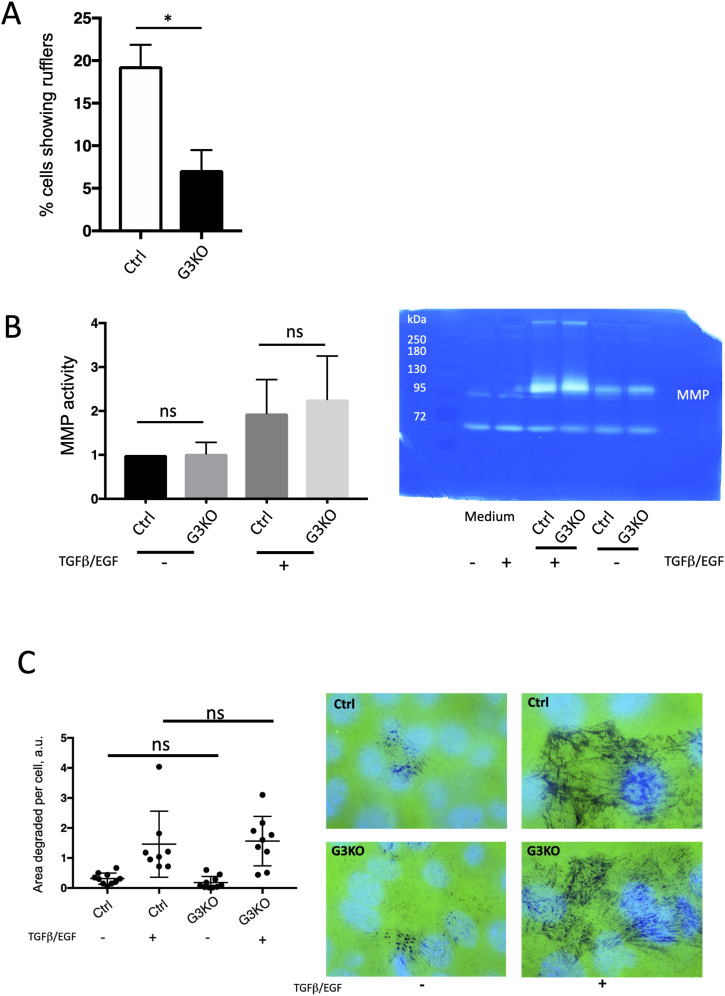
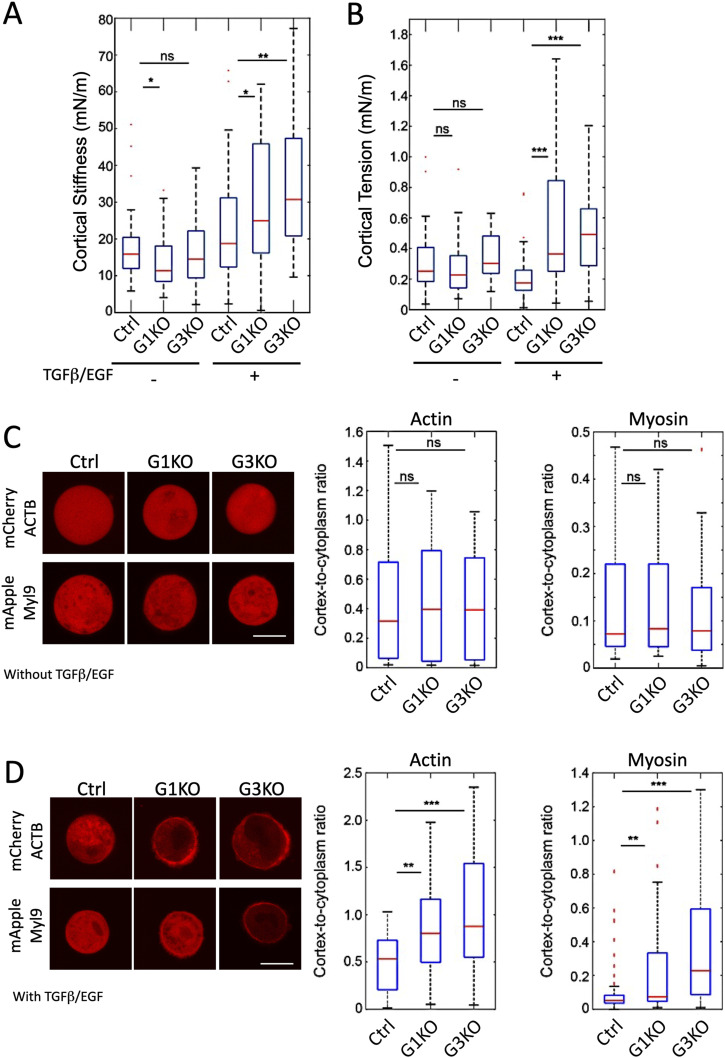
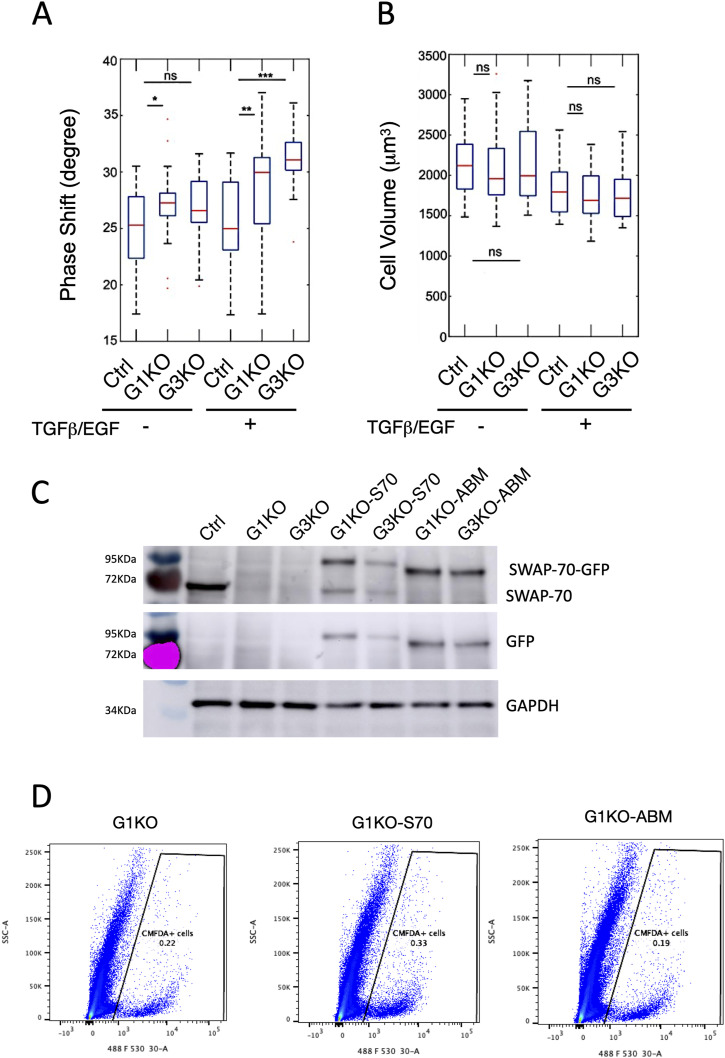
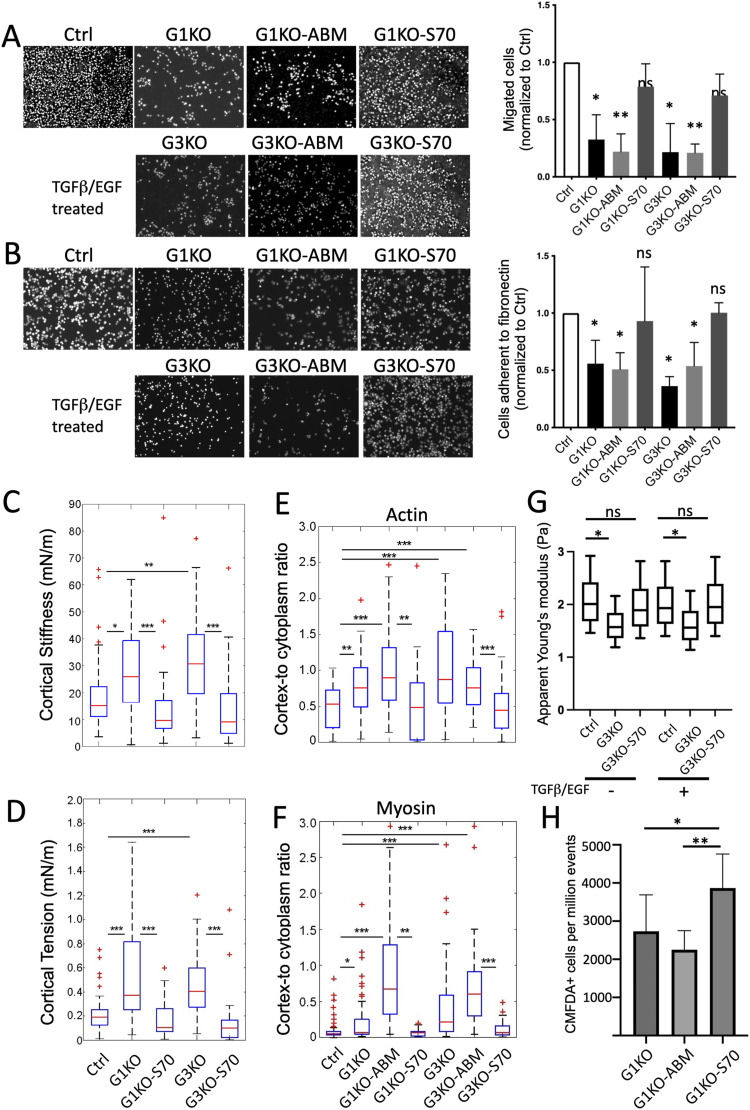
Dynamic rearrangements of the F-actin cytoskeleton are a hallmark of tumor metastasis. Thus, proteins that govern F-actin rearrangements are of major interest for understanding metastasis and potential therapies. We hypothesized that the unique F-actin binding and bundling protein SWAP-70 contributes importantly to metastasis. Orthotopic, ectopic, and short-term tail vein injection mouse breast and lung cancer models revealed a strong positive dependence of lung and bone metastasis on SWAP-70. Breast cancer cell growth, migration, adhesion, and invasion assays revealed SWAP-70's key role in these metastasis-related cell features and the requirement for SWAP-70 to bind F-actin. Biophysical experiments showed that tumor cell stiffness and deformability are negatively modulated by SWAP-70. Together, we present a hitherto undescribed, unique F-actin modulator as an important contributor to tumor metastasis.


Conflict of interest statement

The authors declare that they have no conflict of interest.

Figures

Figure S1.
Figure S1.. In vivo analysis of SWAP-70 deficient metastatic tumor cells.
(A) Western blot was used to check SWAP-70 deficiency in 4T1 KO cells; α-tubulin was used as a loading control. (B) Representative histological images of bone sections with bone metastases are marked by red lines. Higher magnification insets are shown for the areas indicated by arrows. (C) Representative FACS plot of gating the GFP-positive 4T1 cells isolated from the lungs. (D) Representative images of tumor cells inside blood vessels of the lung or extravasating as indicated. As almost no G3KO cells were extravasated, only two control cells are shown extravasating. As reported for 4T1 cells, these cells rarely entirely extravasate but protrude through the vessel walls as seen. Blue: DAPI; green: tumor cells; magenta: vessels (anti-CD31-stained); green: tumor cells. (E) Western blot was used to assess SWAP-70–deficient LLC cells (several individual clones are shown); α-tubulin was used as a loading control. (F) Representative images of lung sections with lung metastasis after injecting LLC cells, and histological quantification of lung metastasis. Ctrl, n = 15; G1KO, n = 9; and G3KO, n = 15. Statistical differences were tested by an unpaired two-tailed t test (**P < 0.01).
Figure 1.
Figure 1.. SWAP-70 promotes metastasis in mice.
(A) Scheme showing the workflow of the mouse breast cancer metastasis experiments. (B) Growth curve of primary tumors in BALB/c mice injected with 4T1 Ctrl, G1KO, or G3KO cells, n = 13 in each group. Each point is the mean tumor volume at each time point ± SEM. Statistical differences were tested by an unpaired two-tailed t test (***P < 0.001). (C) Quantification of metastatic nodules per lung of different cell lines in BALB/c mice, n = 13 in each group. Statistical differences were tested by an unpaired two-tailed t test (**P < 0.01). (D) Representative histological images of lung sections; the lung metastases are marked with arrows. High-magnification insets of the areas indicated by yellow boxes are provided for ctrl and G1KO, there was no tumor in G3KO. Quantification of lung metastasis from the histological sections. Ctrl, n = 7; G1KO, n = 8; and G3KO, n = 7. Statistical differences were tested by an unpaired two-tailed t test (**P < 0.01). (E) Representative images of the bones as scanned by μCT, and associated bone lesion levels, grades I to III. Bone specimens were scored blindly based on the lesion level; the statistical analysis was performed by the Mann–Whitney test, n = 26 in each group (*P < 0.05, **P < 0.01, ***P < 0.001, and ****P < 0.0001). (F) Quantification of bone metastasis determined by histology. Ctrl, n = 10; G1KO, n = 10; and G3KO, n = 11. Statistical differences were tested by an unpaired two-tailed t test (mean; **P < 0.01 and ***P < 0.001). (G) Quantification of the number of GFP-positive cells per 10 million events present in the lungs 16 h after tail vein injection. Statistical analysis was done by an unpaired two-tailed t test, n = 6 in each group (mean ± SD; *P < 0.05 and **P < 0.01). (H) Percentage of extravasating cells is shown for control and G3KO cells after CMFDA labeling of the cells, tail vein injection, and quantification by imaging; n = 5 for Ctrl; n = 6 for G3KO; unpaired t test (*P < 0.05).
Figure S2.
Figure S2.. Cell viability, EMT marker expression and colony formatrion of SWAP-70 deficient 4T1 cells.
(A) Representative FACS plot of gating live, early, and late apoptotic cells. Quantification of the percentage of live cells and apoptotic cells, and statistical analysis using an unpaired two-tailed t test, n = 3 in each group (ns, not significant). (B) qRT–PCR analysis of EMT transcription factors after EGF/TGFß stimulation. Fold change (2−∆∆Ct) in the mRNA expression of the designated genes after the indicated time of stimulation (left) in reference to the WT mRNA expression levels (GAPDH as a reference for ∆Ct, ∆Ct [WT] as a reference for ∆∆Ct, mean ± SEM) (right) in reference to mRNA levels of unstimulated cells of the same genotype (GAPDH as a reference for ∆Ct, 0-h time point ∆Ct as a reference for ∆∆Ct, mean ± SEM). P-values were calculated using an unpaired two-tailed t test. (C) Quantification of mean fluorescence intensity of the epithelial marker EpCAM, intermediate EMT marker CD106, and full EMT markers CD61 and CD5; and the statistical analysis by an unpaired two-tailed t test, n = 3 in each group (ns, no significant and *P < 0.05). (D) Representative soft agar images of 4T1 cell lines in the absence or presence of growth factors.
Figure S3.
Figure S3.. Transcriptome analysius of Ctrl versus SWAP-70 deficient 4T1 cells.
(A) Schematic diagram showing the workflow of collecting cells for RNA-seq. (B) GSEA enrichment plots show that EMT markers are enriched in all three 4T1 cell lines treated with TGFβ/EGF. (C) EMT markers are enriched in untreated Ctrl cells compared with G1KO and G3KO. Normalized enrichment scores are the adjusted ES based on the gene set sizes, which allowed to compare the analysis results across gene sets. The P-value shows the statistical significance of a single gene set’s enrichment score, and P-value = 0 can be considered as P < 0.001. (D) Principal component analysis on the top 500 highly variable genes shows that stimulation with TGFβ/EGF consistently shifts the transcriptome in the direction of principal component 1 for each of the genotypes.
Figure 2.
Figure 2.. SWAP-70–dependent cell features relevant for metastasis.
(A) 4T1 cell lines were subjected to the soft agar colony formation assay, and the colonies were stained with crystal violet at day 15. Quantification of colony numbers per well is presented in the bar graph. Data are represented as means ± SD from three independent experiments. Statistical differences were tested with an unpaired two-tailed t test (*P < 0.05 and ***P < 0.001). (B) 2D cell migration assayed using Oris Cell Migration Assay in fibronectin-coated 96-well plates. The summary bar graph illustrates the percentage of wound closure after 15 h. Data are presented as means ± SD from four independent experiments, and statistical differences were tested with an unpaired two-tailed t test (*P < 0.05 and **P < 0.01). (C) 3D cell migration in Boyden chambers. The transmigrated cells were fixed and then stained by DAPI 24 h after seeding into the well. Complete DMEM with or without TGFβ and EGF was used as a chemoattractant. A summary bar graph is shown illustrating the fold change of the migrated cells normalized to the non-treated Ctrl. Data are presented as means ± SD from three independent experiments, and statistical differences were tested by a ratio-paired two-tailed t test (*P < 0.05 and ****P < 0.01). (D) Invasion assay performed using a Matrigel-coated Transwell chamber. The transmigrated and invaded cells were stained with CellTracker Green CMFDA dye at 72 h and imaged by confocal microscopy. EGF and TGFβ in complete DMEM were used as chemoattractants, and the concentration gradient is indicated by a triangle. Representative Z-stack images are shown with cells that passed the membrane and invaded into the Matrigel. The number of cells reaching 10-μm distance from the membrane was counted. Data are presented as means ± SD from three independent experiments, and statistical differences were tested by an unpaired two-tailed t test (*P < 0.05 and ***P < 0.001). (E) Adhesion of 4T1 cell lines to fibronectin-coated wells. The number of GFP+ cells adhered to the surface was ascertained. A summary bar graph illustrates the fold change of the cells normalized to the EGF/TGFβ-untreated Ctrl or EGF/TGFβ-treated Ctrl, resp., as means ± SD from at least three independent experiments, and statistical differences were tested by a ratio-paired two-tailed t test (*P < 0.05). (F) Adhesion of 4T1 cell lines to mouse lung sections. A summary bar graph illustrates the fold change of adherent cells normalized to the EGF/TGFβ-untreated Ctrl or EGF/TGFβ-treated Ctrl, resp., with SD shown as means from at least three independent experiments, and statistical differences were tested by a ratio-paired two-tailed t test (*P < 0.05 and **P < 0.01). (G) Formation of focal adhesions (FA) by control and SWAP-70–deficient 4T1 cells, 20 cells per sample were assessed by staining for vinculin, and the number of focal adhesions and the area covered by them were quantified. Statistical differences were tested by a ratio-paired two-tailed t test (n = 4; *P < 0.05, **P < 0.01, and ***P < 0.005).
Figure S4.
Figure S4.. Migration and adhesion of Ctrl versus SWAP-70 deficient 4T1 cells
Cells were stained with DAPI. Complete DMEM with TGFβ and EGF was used as a chemoattractant. (B) Summary bar graph illustrating adhesion of cells, non-transfected or transfected to express GFP, to fibronectin, or to frozen lung sections; values were normalized to Ctrl. Cells were unstimulated or stimulated with EGF/TGFβ. Data are presented as means ± SD from at least three independent experiments, and statistical differences were tested by a ratio-paired two-tailed t test. No significant differences were detected between the samples, and no effect of stimulation on the adhesion was observed. (C, D) Representative microscopy images of cells adhered to fibronectin or frozen lung sections. Cells were stained with the CellTracker CMFDA dye. (E) Representative images of focal adhesion staining. Ctrl or G3KO cells were left unstimulated or stimulated as indicated and stained for vinculin and F-actin (phalloidin).
Figure 3.
Figure 3.. SWAP-70–dependent ultrastructure of 4T1 cells.
(A, B, C, D, E, F, G) Morphological characteristics of the indicated cells were observed at high resolution by SEM without or with TGFβ/EGF treatment. (A, B, C, D, E, F, G) Cells were incubated for 24 (A, B, C, D, E, F, G) or 48 (G) h after seeding on fibronectin-coated glass coverslips. (A, B, C) As observed at low-power magnification, all cell lines were developed into multicellular islets ((A, B), blue asterisk, dashed line) containing at least five cells in the absence of treatment, whereas only cells in the control group (Ctrl) retained this characteristic after TGFβ/EGF treatment. (C) Statistical analysis was performed using the Mann–Whitney test, n = 4–6 independent micrographs [area of 2.67 mm2 each] for each group, **P < 0.01). At high-power magnification, individual cells show distinct migratory morphology between the Ctrl and KO cell pools. (D) Ctrl cells have lamellipodia (LPs, dashed line) with membrane ruffles (MR) on their leading edge that has a convex shape, whereas SWAP-70–deficient cells have smooth LPs without ruffles that are extended relative to the cell body and often indented. (E) Although the latter phenotypes can be rarely observed in Ctrl cells (about 1:100), they harbor circular membrane ruffles and/or folded protruding lamella structures, black and white arrowheads, respectively; four examples of Ctrl are displayed). At the rear, Ctrl cells contain very short retraction processes, whereas they appear as a long trailing tail (TT) in KO cells. (D, F) These processes can be very elongated and look like magnupodium-like structures (MP), dashed arrow). (F) MPs may harbor an LP at their extremity (white asterisk) and make contact with other cells. (G) In TGFβ/EGF-treated cells, MPs are predominant and longer in the KO cell pools, as observed after 24 and 48 h of culture. (G) Statistical analysis was performed using the Mann–Whitney test; cell number: n > 2100 cells; length: n > 25 cells, *P < 0.05, **P < 0.01, and ***P < 0.001). Scale bars, 100 μm ((A, B) top panels); 10 μm ((A, B) bottom panels, (D, E) except top right panel, and (F)); 1 μm ((E), top right panel).
Figure S5.
Figure S5.. Ruffle formation, MPP activity and degradation of extracellular matrix by Ctrl versus SWAP-70 deficient 4T2 cells.
(A) Quantification of membrane ruffles of TGFβ/EGF-stimulated 4T1 Ctrl and KO cells. Eight fields of view per genotype were analyzed with an average of 32 cells per field. The t test was used (P = 0.0368). (B) Activity of secreted matrix metalloproteases as assayed by zymography of Ctrl and G3KO cells before or after stimulation with EGF/TGFβ; n = 3, unpaired t test. A representative zymography gel is shown and the area of MMP-mediated degradation of gelatin indicated. (C) Matrix degradation by Ctrl or G3KO cells. Quantification of degradation by microscopy of either non-stimulated or stimulated cells showed no difference between Ctrl and G3KO cells. Areas of FITC-conjugated (green), degraded gelatin are seen as black signals in a representative image. Blue: DAPI.
Figure 4.
Figure 4.. SWAP-70 determines the mechanical properties of 4T1 cells.
(A, B) Cortical stiffness and (B) cortical tension of the suspended cells were measured by AFM, either without or with TGFβ/EGF treatment for 48 h; untreated Ctrl, n = 40; G1KO, n = 32; and G3KO, n = 24; treated Ctrl, n = 30; G1KO, n = 30; and G3KO, n = 29. Measurements are from two independent experiments, and statistical differences were calculated by a two-tailed Mann–Whitney U test (ns, not significant, *P < 0.05, **P < 0.01, and ***P < 0.001). (C) Representative confocal images of TGFβ/EGF-untreated suspended cells expressing mCherry-ACTB or mApple-Myl9. A summary box plot of the ratio of cortical versus cytoplasmic actin (left) or myosin (right) of TGFβ- and EGF-untreated cells. The number of cells measured for actin analysis: Ctrl, n = 44; G1KO, n = 43; and G3KO, n = 48; for myosin: Ctrl, n = 48; G1KO, n = 48; and G3KO, n = 48. Measurements are from two independent experiments, and statistical differences were calculated by a two-tailed Mann–Whitney U test (ns, not significant). (D) Representative confocal images of TGFb- and EGF-treated suspended cells expressing mCherry-ACTB or mApple-Myl9. A summary box plot of the ratio of cortical versus cytoplasmic actin (left) or myosin (right) of TGFβ/EGF-untreated cells. The number of cells measured for actin analysis: Ctrl, n = 46; G1KO, n = 43; and G3KO, n = 43; for myosin: Ctrl, n = 60; G1KO, n = 62; and G3KO, n = 60. Measurements are from two independent experiments, and statistical differences were done by a two-tailed Mann–Whitney U test (**P < 0.01 and ***P < 0.001). Scale bars: 10 μm.
Figure S6.
Figure S6.. Biophysical properties of Ctrl versus SWAP-70 deficient 4T2 cells and expression charateristics of complemented cell lines.
(A, B) Phase shift and (B) cell volume of the suspended cells were measured by AFM, either without or with TGFβ and EGF treatment for 48 h. The number of cells measured in the untreated Ctrl, n = 40; G1KO, n = 32; and G3KO, n = 24; treated Ctrl, n = 30; G1KO, n = 30; and G3KO, n = 29. Measurements are from two independent experiments, and statistical differences were assessed by a two-tailed Mann–Whitney U test (ns, not significant, *P < 0.05, **P < 0.01, and ***P < 0.001). (C) Western blot was used to validate for SWAP-70 protein expression in the complemented 4T1 KO cells, and an antibody against GAPDH was used for loading control. (D) Example FACS plots showing CMFDA-labeled SWAP-70–deficient 4T1 cells (G1KO) re-expressing either full-length SWAP-70 (G1KO-S70) or the actin binding deficient mutant of SWAP-70 (G1KO-ABM). The gate containing positive cells is indicated.
Figure 5.
Figure 5.. SWAP-70 regulates cell migration, adhesion, and mechanics by interacting with F-actin.
(A) 3D migration analyzed in a Boyden chamber. The transmigrated cells were fixed and then stained by DAPI at 24 h for visualization. Complete DMEM with TGFβ/EGF was used as a chemoattractant. A summary bar graph illustrating the fold change of the migrated cells normalized to the Ctrl. Data are presented as means ± SD from at least three independent experiments, and statistical differences were tested by a ratio-paired two-tailed t test (ns, not significant, *P < 0.05, and **P < 0.01). (B) Adhesion of 4T1 cell lines to a fibronectin-coated surface. A summary bar graph illustrating the fold change of the cells normalized to the Ctrl as means ± SD from at least three independent experiments, and statistical differences were tested by a ratio-paired two-tailed t test (ns, not significant and *P < 0.05). (C, D) Cortical stiffness and (D) cortical tension of the suspended cells were measured by AFM after TGFβ/EGF treatment for 48 h. The number of cells measured in the treated Ctrl, n = 55; G1, n = 27; G1-S70, n = 32; G3, n = 27; and G3-S70, n = 34. Measurements represent at least two independent experiments, and statistical differences were done by a two-tailed Mann–Whitney U test (ns, not significant, *P < 0.05, **P < 0.01, and ***P < 0.001). (E, F) Summary box plot of the ratio of cortical versus cytoplasmic actin (E) and myosin (F) of TGFβ- and EGF-treated cells. The number of cells analyzed: actin: Ctrl, n = 46; G1, n = 36; G1-ABM, n = 42; G1-S70, n = 63; G3, n = 29; G3-ABM, n = 31; G3-S70, n = 62; myosin: Ctrl, n = 57; G1, n = 58; G1-ABM, n = 45; G1-S70, n = 38; G3, n = 56; G3-ABM, n = 47; G3-S70, n = 43. Measurements represent at least two independent experiments, and statistical differences were done by a two-tailed Mann–Whitney U test (*P < 0.05, **P < 0.01, and ***P < 0.001). (G) Real-time deformability cytometry analysis of the 4T1 cell lines. Apparent Young’s moduli are presented as box-and-whisker plots (box presents 25th and 75th quartiles and median, and whiskers indicate 10th and 90th percentiles). Five independent experiments were performed, and statistical differences were done using Tukey’s test. (ns, not significant and *P < 0.05). (H) Accumulation in the lungs of G1KO cells or G1KO cells re-expressing either full-length SWAP-70 (G1KO-S70), or the actin binding deficient mutant of SWAP-70 (G1KO-ABM). Accumulation was compared by quantifying the number of CMFDA-positive 4T1 cells per 1 million events present in the lungs 18 h after tail vein injection. Statistical analysis was done by an unpaired two-tailed t test, n = at least seven mice in each group (mean ± SD; *P < 0.05 and **P < 0.01).

Similar articles

References

    1. Adams JC (2004) Roles of fascin in cell adhesion and motility. Curr Opin Cell Biol 16: 590–596. 10.1016/j.ceb.2004.07.009 - DOI - PubMed
    1. Baranov MV, Revelo NH, Dingjan I, Maraspini R, Ter Beest M, Honigmann A, van den Bogaart G (2016) Swap70 organizes the actin cytoskeleton and is essential for phagocytosis. Cell Rep 17: 1518–1531. 10.1016/j.celrep.2016.10.021 - DOI - PMC - PubMed
    1. Barik GK, Sahay O, Paul D, Santra MK (2022) Ezrin gone rogue in cancer progression and metastasis: An enticing therapeutic target. Biochim Biophys Acta Rev Cancer 1877: 188753. 10.1016/j.bbcan.2022.188753 - DOI - PubMed
    1. Bemmerlein L, Deniz IA, Karbanova J, Jacobi A, Drukewitz S, Link T, Gobel A, Sevenich L, Taubenberger AV, Wimberger P, et al. (2022) Decoding single cell morphology in osteotropic breast cancer cells for dissecting their migratory, molecular and biophysical heterogeneity. Cancers 14: 603. 10.3390/cancers14030603 - DOI - PMC - PubMed
    1. Betaneli V, Jessberger R (2020) Mechanism of control of f-actin cortex architecture by swap-70. J Cell Sci 133: jcs233064. 10.1242/jcs.233064 - DOI - PubMed

MeSH terms