. 2024 May 17;15(1):4214.
doi: 10.1038/s41467-024-48471-2.

Liver ACOX1 regulates levels of circulating lipids that promote metabolic health through adipose remodeling

Affiliations

Liver ACOX1 regulates levels of circulating lipids that promote metabolic health through adipose remodeling

Dongliang Lu et al. Nat Commun. .

Abstract

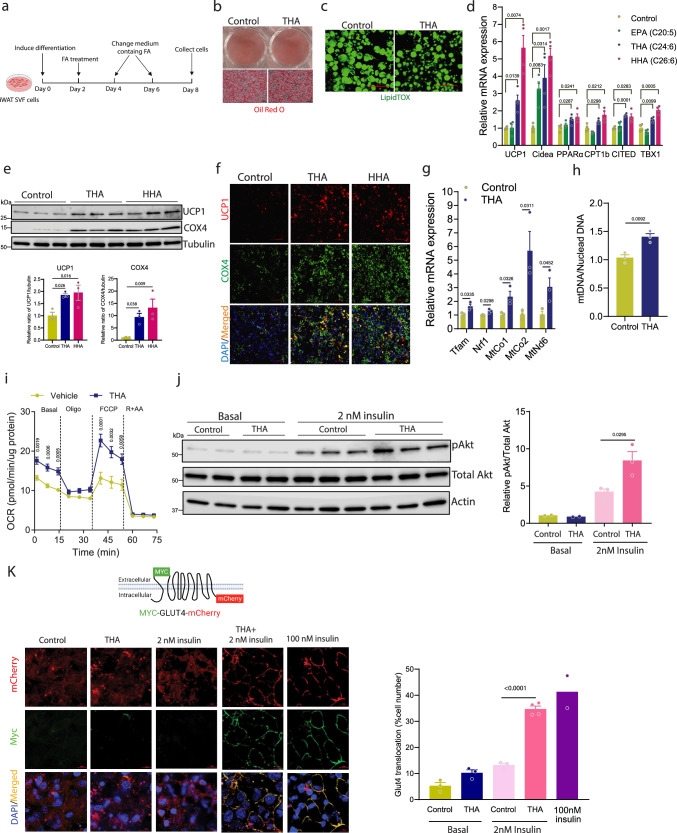
The liver gene expression of the peroxisomal β-oxidation enzyme acyl-coenzyme A oxidase 1 (ACOX1), which catabolizes very long chain fatty acids (VLCFA), increases in the context of obesity, but how this pathway impacts systemic energy metabolism remains unknown. Here, we show that hepatic ACOX1-mediated β-oxidation regulates inter-organ communication involved in metabolic homeostasis. Liver-specific knockout of Acox1 (Acox1-LKO) protects mice from diet-induced obesity, adipose tissue inflammation, and systemic insulin resistance. Serum from Acox1-LKO mice promotes browning in cultured white adipocytes. Global serum lipidomics show increased circulating levels of several species of ω-3 VLCFAs (C24-C28) with previously uncharacterized physiological role that promote browning, mitochondrial biogenesis and Glut4 translocation through activation of the lipid sensor GPR120 in adipocytes. This work identifies hepatic peroxisomal β-oxidation as an important regulator of metabolic homeostasis and suggests that manipulation of ACOX1 or its substrates may treat obesity-associated metabolic disorders.


Conflict of interest statement

The authors declare no competing interests.

Figures

Fig. 1
Fig. 1. Liver-specific knockout of Acox1 protects against high-fat diet-induced obesity, inflammation, and insulin resistance in mice.
a Peroxisomal VLCFA β-oxidation pathway. b Peroxisomal fatty acid β-oxidation gene expression in liver of mice fed with chow or HFD for 16 weeks (n = 3). c Body weight of control and Acox1-LKO male mice fed with HFD (n = 9). d MRI analysis of mice after HFD feeding (n = 9). e Tissue weights of HFD-fed mice; n = 8 (control), n = 9 (Acox1-LKO). f Representative gross images of iWAT from HFD-fed control and Acox1-LKO mice. g H&E staining of adipose tissues from control and Acox1-LKO mice (scale bar, 50 μm). h Cell size quantification in BAT (n = 3 for control, 4 for Acox1-LKO), gWAT (n = 5) and iWAT (n = 3). i Glucose tolerance test of HFD-fed control (n = 9) and Acox1-LKO (n = 11) mice. jk Serum insulin level (j) and TAG level (k) of control (n = 4) and Acox1-LKO (n = 5) mice. l Akt phosphorylation in livers of mice at baseline and 10 min after insulin injection. Quantification based on n = 4 (basal), 5 (control with insulin) and 6 (LKO with insulin) mice. m Akt phosphorylation in gWAT and iWAT of mice at baseline and 10 min after insulin injection. Quantification based on n = 4/group. n UMAP visualization of CD45+ cells in mice gWAT; ATM, adipose tissue macrophages. op Number of macrophages (o) and CD9 + ATM (p) per gram of fat (n = 5). q Density plots of macrophages subpopulation expressing CD11c or CD206 (n = 5). rs Percentage of CD11c-CD206+ (r) and CD11c + CD206+ (s) in total gWAT macrophages (n = 5). t F4/80 (red) staining in gWAT whole tissue mounts stained with LipidTOX (green) (scale bar, 100 μm). Data in (be, hm, op, and rs) are from biologically independent samples. Images in (f) and (g) are representative of three mice/genotype. Images in (t) are representative of two separate experiments. Data with error bars are reported as the mean ± SEM. P values were determined by two-sided unpaired Student’s t test in (b, de, h, j, k, op, r, s) or two-way ANOVA followed by Fisher’s LSD test in c, i and l-m. Source data are provided as a Source Data file.
Fig. 2
Fig. 2. Hepatic ACOX1 deficiency promotes basal energy expenditure and browning of subcutaneous white adipose tissue.
a Oxygen consumption rat (VO2) of HFD-fed control (n = 7) and Acox1-LKO (n = 6) mice. b Analysis of energy expenditure in control and Acox1-LKO mice. c Browning gene expression in iWAT of control and Acox1-LKO mice fed normal chow diet (n = 11). d Western blot analysis of UCP1, Tomm20 and mitochondrial respiratory complex V, III, and II in iWAT from mice after a 2-day cold exposure (n = 3). e UCP1 immunohistochemistry in iWAT from control and Acox1-LKO mice after cold exposure (n = 2; scale bar, 25 μm). f Activities of mitochondrial complex II and complex IV from mice iWAT were measured using Seahorse (n = 10). g VO2 of control and Acox1-LKO mice before and after CL316,243 injection (n = 7). h Strategy for treatment of adipocytes derived from WT iWAT with serum from Acox1-LKO or control mice. Created with BioRender.com. i Western bolt analysis of UCP1 and COX4 (n = 3). j Browning gene expression in iWAT adipocytes treated with whole or delipidated mouse serum (n = 3). Data in (ad, f, g, i, and j) are from biologically independent samples. Images in (e) are representative of two separate experiments. Data with error bars are the mean ± SEM. P values were determined by two-sided unpaired Student’s t test in (a) (right panel) and (c), two-way ANOVA with Tukey’s honest difference post hoc test in (a) (left panel), ANCOVA in (b), two-way ANOVA followed by Fisher’s LSD test in (f, g, and j). n.s., not significant. Source data are provided as a Source Data file.
Fig. 3
Fig. 3. Upregulation of liver-derived ω−3 very long chain fatty acids in the circulation of Acox1-LKO mice.
a The top changed KEGG pathways in RNA-seq analysis in livers of control and Acox1-LKO mice. b Heatmap of all changed lipid metabolic genes in RNA-seq analysis (n = 5). c Mapping of changed lipid metabolic genes to fatty acid metabolic processes: fatty acid transport and activation, peroxisomal β-oxidation, mitochondrial β-oxidation, ER ω-oxidation and elongation and desaturation. Created with BioRender.com. d Untargeted lipidomic analysis of serum from control and Acox1-LKO mice (n = 5). Schematic created with BioRender.com. e Circos plot depicting relationship between liver transcriptomic changes and serum lipidomic changes in Acox1-LKO mice. f Pathway enrichment analysis of changed lipids using MetaboAnalyst. g Significantly altered ω−3 fatty acids identified by serum lipidomics (n = 5). Data in (b, d, g) are from biologically independent samples. Data with error bars are reported as the mean ± SEM. P values were determined by one-tailed Fisher’s exact test in (a) and (f) or two-sided unpaired Student’s t test in (d) and (g). Source data are provided as a Source Data file.
Fig. 4
Fig. 4. ω-3 Very long-chain fatty acids induce iWAT adipocyte browning and Glut4 translocation.
a Strategy for treatment of iWAT SVF cells with fatty acids. Created with BioRender.com. b Oil Red O staining in control and THA-treated iWAT SVF cells (scale bar, 75 μm). c LipidTox staining of lipid droplets in control and THA-treated iWAT SVF cells (scale bar, 50 μm). d Expression of browning marker in adipocytes treated with vehicle, EPA, THA or HHA (n = 4). e UCP1 and COX4 protein levels in adipocytes treated with vehicle, THA or HHA (n = 3). f Immunofluorescence analysis of UCP1 and COX4 in differentiated iWAT SVF treated with THA, HHA or vehicle (scale bar, 50 μm). g Expression of mitochondrial gene in adipocytes treated with vehicle or THA (n = 3). h Mitochondrial DNA copy number in adipocytes treated with vehicle or THA (n = 3). i OCR of adipocytes treated with vehicle or THA (n = 7). j Basal and insulin activated Akt phosphorylation in adipocytes treated with vehicle or THA (n = 2 for basal, 3 for insulin treatment). k Glut4 translocation in adipocytes treated with vehicle or THA in the presence of 0, 2 nM or 100 nM insulin (scale bar, 25 μm). Quantification of Glut4 translocation is based on n = 3/group (basal), 3 (control+ 2 nM insulin), 4 (THA + 2 nM insulin), and 2 (100 nM insulin). Data in (d, e) and (gi) are from biologically independent samples. Data with error bars are reported as the mean ± SEM. P values were determined by two-sided unpaired Student’s t test in (g, h, j) (right panel), two-way ANOVA followed by Fisher’s LSD test in (d, i, k) (right panel) or one-way ANOVA followed by Fisher’s LSD test in (e) (bottom panel). Source data are provided as a Source Data file.
Fig. 5
Fig. 5. THA selectively activates GPR120 to promote adipocyte browning.
a Gene expression of five fatty acid receptors in iWAT of WT mice housed under 30 °C or 4 °C (n = 8). b Schematic representation of Tango (β-arrestin recruitment) assay: (1) Activation of GPCR by agonist. (2) Recruitment of β-arrestin and TEV protease to the C terminus. (3) Cleavage of TEV site leading to the release of the transcription factor tTA. (4) Released tTA induces luciferase expression. Created with BioRender.com. c Tango assay of five fatty acid receptors stimulated by THA (n = 4). d Calcium release assay in 293T cells expressing mouse GPR120 after treatment with GSK137647A, palmitic acid (PA), EPA or THA (n = 4). e Representative images of cell stained with Fluo-4 calcium indicator after treatment with GSK137647A, PA, EPA or THA at 0.2 μM or 20 μM (scale bar, 50 μm). f Gene expression in iWAT adipocytes treated with PA or AH, in the presence of GPR120 inhibitor AH7614 or vehicle (n = 3). gi Gene expression (g), UCP1 protein levels (h) and OCR (i) of Lenti-Scr or Lenti-shGPR120-infected iWAT adipocytes treated with vehicle or THA; (n = 3 in (g), n = 4 in (h) and n = 11 in (i)). Data in (a, c, d) and (fi) are from biologically independent samples. Data with error bars are reported as the mean ± SEM. P values were determined by two-sided unpaired Student’s t test in a or two-way ANOVA followed by Fisher’s LSD test in (d), and (fi). n.s., not significant. Source data are provided as a Source Data file.
Fig. 6
Fig. 6. THA promotes adipose tissue browning in mice.
a Schematic of THA treatment in mice. Created with BioRender.com. b Serum THA levels in vehicle-treated WT mice, THA-treated WT mice, or vehicle-treated Acox1-LKO mice (n = 4). c Free THA level in iWAT of mice injected with vehicle or THA for 15 min, n = 3 (vehicle), n = 4 (THA). d Body weight of mice before and after vehicle or THA injections (n = 9). e MRI analysis of mice after vehicle or THA treatment (n = 9). f Glucose tolerance test of control and THA-treated mice (n = 14). g H&E staining of BAT and iWAT from control or THA-treated mice (scale bar, 100 μm). h Quantification of iWAT cell size, n = 6 (vehicle), n = 8 (THA). i Brown gene expression in iWAT of control or THA treated mice (n = 14). j Western blot analysis of UCP1, OXPHOS proteins and AKT phosphorylation in iWAT tissue (n = 3). Data with error bars are reported as the mean ± SEM. P values were determined by one-way ANOVA followed by Dunnett’s multiple comparisons test in (b) or two-sided unpaired Student’s t test in (ce, h), and (i), or two-way ANOVA followed by Fisher’s LSD test in (f). Source data are provided as a Source Data file.

References

    1. Kusminski CM, Bickel PE, Scherer PE. Targeting adipose tissue in the treatment of obesity-associated diabetes. Nat. Rev. Drug Discov. 2016;15:639–660. doi: 10.1038/nrd.2016.75. - DOI - PubMed
    1. Roden M, Shulman GI. The integrative biology of type 2 diabetes. Nature. 2019;576:51–60. doi: 10.1038/s41586-019-1797-8. - DOI - PubMed
    1. Chondronikola M, et al. Brown adipose tissue improves whole-body glucose homeostasis and insulin sensitivity in humans. Diabetes. 2014;63:4089–4099. doi: 10.2337/db14-0746. - DOI - PMC - PubMed
    1. Van Veldhoven PP. Activity measurements of acyl-CoA oxidases in human liver. J. Inherit. Metab. Dis. 1995;18:125–134. doi: 10.1007/BF00711435. - DOI - PubMed
    1. Wanders RJ, Waterham HR. Biochemistry of mammalian peroxisomes revisited. Annu, Rev. Biochem. 2006;75:295–332. doi: 10.1146/annurev.biochem.74.082803.133329. - DOI - PubMed