. 2024 May 17;15(1):4212.
doi: 10.1038/s41467-024-48164-w.

Time-resolved THz Stark spectroscopy of molecules in solution

Affiliations

Time-resolved THz Stark spectroscopy of molecules in solution

Bong Joo Kang et al. Nat Commun. .

Abstract

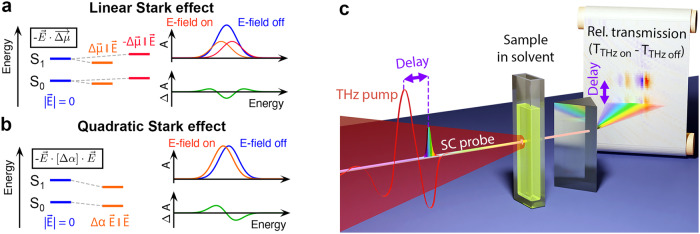
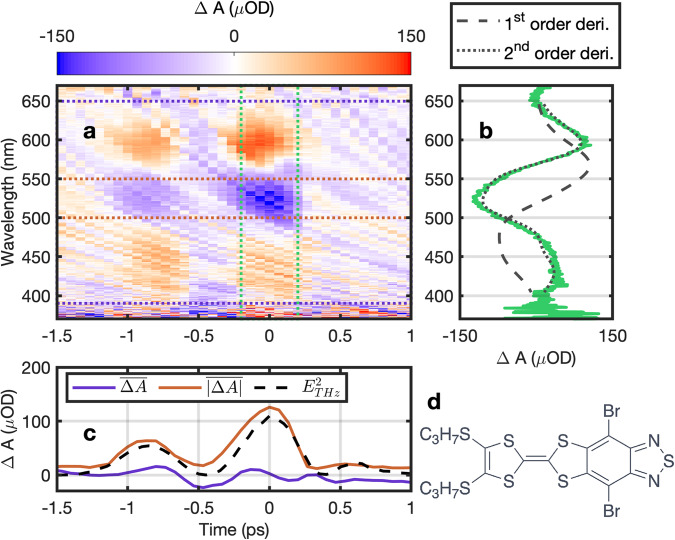
For decades, it was considered all but impossible to perform Stark spectroscopy on molecules in a liquid solution, because their concomitant orientation to the applied electric field results in overwhelming background signals. A way out was to immobilize the solute molecules by freezing the solvent. While mitigating solute orientation, freezing removes the possibility to study molecules in liquid environments at ambient conditions. Here we demonstrate time-resolved THz Stark spectroscopy, utilizing intense single-cycle terahertz pulses as electric field source. At THz frequencies, solute molecules have no time to orient their dipole moments. Hence, dynamic Stark spectroscopy on the time scales of molecular vibrations or rotations in both non-polar and polar solvents at arbitrary temperatures is now possible. We verify THz Stark spectroscopy for two judiciously selected molecular systems and compare the results to conventional Stark spectroscopy and first principle calculations.


Conflict of interest statement

The authors declare no competing interests.

Figures

Fig. 1
Fig. 1. Electric field induced Stark effect and experimental concept.
Electric field induced Stark shift due to a difference in ground- and excited state dipole (a), i.e. linear Stark effect, and polarizability (b), i.e. quadratic Stark effect. For an isotropic distribution of molecules the ground state absorption band versus energy A(E) broadens in the case of the linear Stark effect with the difference signal ΔA(E) resembling the second order derivative of the absorption band. In the case of the quadratic Stark effect the ground state absorption band shifts resulting in a difference signal ΔA(E) that is proportional to the first order derivative of absorption band. c Schematic representation of the experimental setup. The femtosecond supercontinuum probe pulse is scanned in time across the collinear single-cycle THz pulses and its spectrum is recorded by a spectrometer.
Fig. 2
Fig. 2. THz Stark signal of TTF-BTD with parallel orientation.
a False-color plot of the measured change in absorption spectrum as a function of time delay between THz and probe pulse and wavelength. b Time-averaged (between the two green dotted lines) change in absorption versus wavelength (green solid curve) compared to the scaled first (black dashed curve) and second order derivative (black dotted curve) of the ground state absorption spectrum. c Spectral average of the change in absorption between the purple dotted (purple curve) and red dotted lines (red curve) in (a). The red curve is compared to the scaled square of the measured THz electric field ETHz2 (black dashed curve). d Chemical structure of TTF-BTD.
Fig. 3
Fig. 3. THz Stark signal of anthanthrene with parallel orientation.
a False-color plot of the measured change in absorption spectrum as a function of time delay between THz and probe pulse and wavelength. b Time-averaged (between the two green dotted lines) change in absorption versus wavelength (green solid curve) compared to the scaled first (black dashed curve) and second order derivative (black dotted curve) of the ground state absorption spectrum. c Spectral average of the change in absorption between the purple dotted (purple curve) and red dotted lines (red curve) in (a). The red curve is compared to the scaled square of the measured THz electric field ETHz2 (black dashed curve). d Chemical structure of anthanthrene.
Fig. 4
Fig. 4. Comparison of conventional and THz Stark spectroscopy.
a, b Low temperature (77 K) and room temperature (295 K) absorption spectra of (a) TTF-BTD and (b) anthanthrene. c, d Conventional Stark spectra measured at 77 K for two values of the angle χ between the polarization of the THz and the probe pulses. e, f THz Stark spectra recorded at room temperature for parallel and perpendicular orientation of THz and probe polarization. For direct comparison the y-scale is in units of Δϵ scaled to an electric field of 1 MV/cm. The gray dotted vertical lines are guides to the eye and help to visualize the shift of the spectra at the different temperatures.

References

    1. Brunschwig BS, Creutz C, Sutin N. Electroabsorption spectroscopy of charge transfer states of transition metal complexes. Coord. Chem. Rev. 1998;177:61–79. doi: 10.1016/S0010-8545(98)00188-X. - DOI
    1. Bublitz GU, Ortiz R, Marder SR, Boxer SG. Starksyenes. J. Am. Chem. Soc. 1997;119:3365–3376. doi: 10.1021/ja9640814. - DOI
    1. Iimori T, Ito R, Ohta N, Nakano H. Stark spectroscopy of rubrene. I. Electroabsorption spectroscopy and molecular parameters. J. Phys. Chem. A. 2016;120:4307–4313. doi: 10.1021/acs.jpca.6b02625. - DOI - PubMed
    1. Karki L, Vance FW, Hupp JT, LeCours SM, Therien MJ. Electronic stark effect studies of a porphyrin-based push-pull chromophore displaying a large first hyperpolarizability: state-specific contributions to β. J. Am. Chem. Soc. 1998;120:2606–2611. doi: 10.1021/ja973593v. - DOI
    1. Liptay W. Electrochromism and solvatochromism. Angew. Chem. Int. Ed. Engl. 1969;8:177–188. doi: 10.1002/anie.196901771. - DOI