. 2024 May 17;7(1):594.
doi: 10.1038/s42003-024-06215-4.

Deficiency of ADAR2 ameliorates metabolic-associated fatty liver disease via AMPK signaling pathways in obese mice

Affiliations

Deficiency of ADAR2 ameliorates metabolic-associated fatty liver disease via AMPK signaling pathways in obese mice

Mei-Lang Kung et al. Commun Biol. .

Abstract

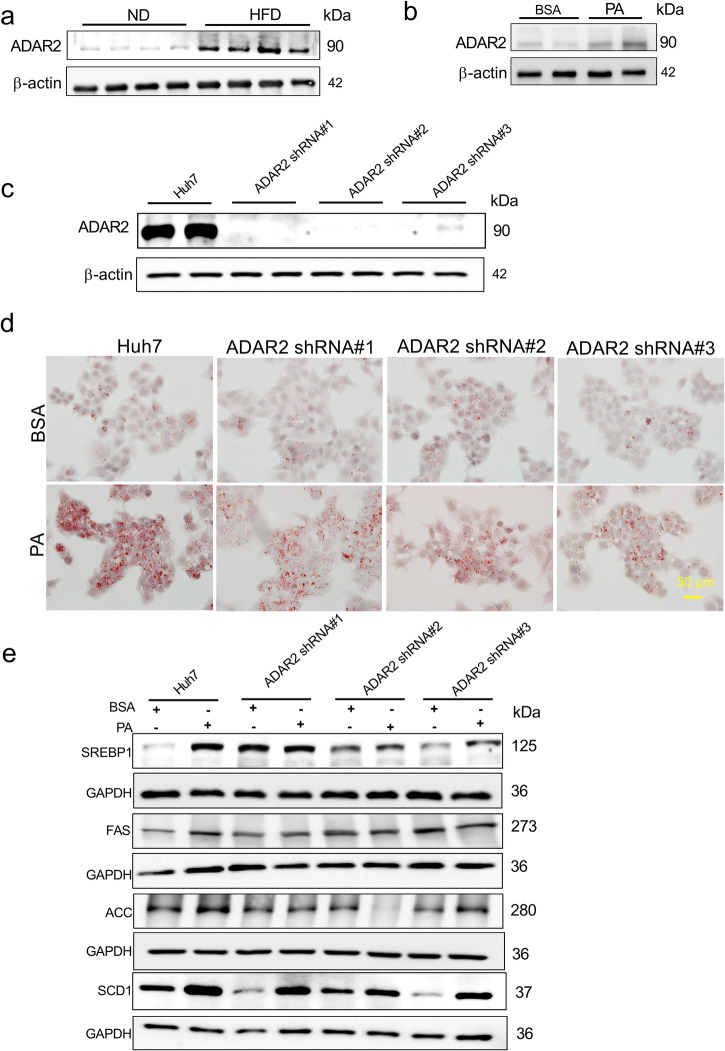
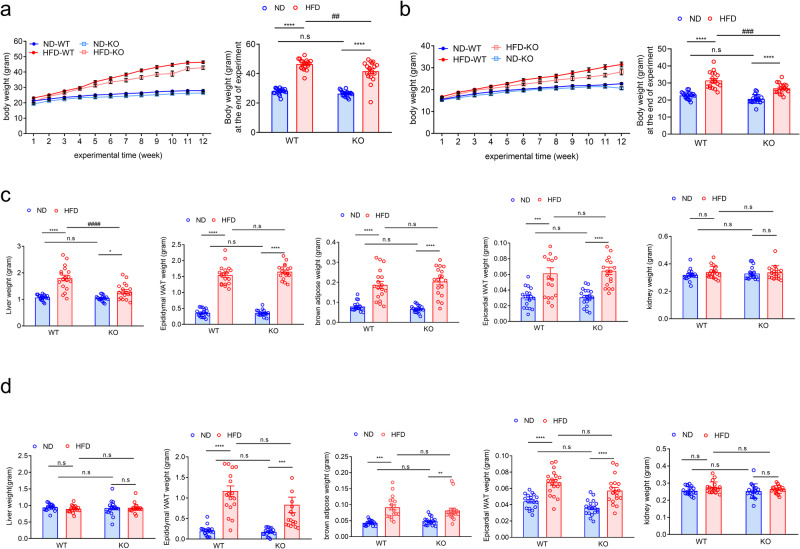
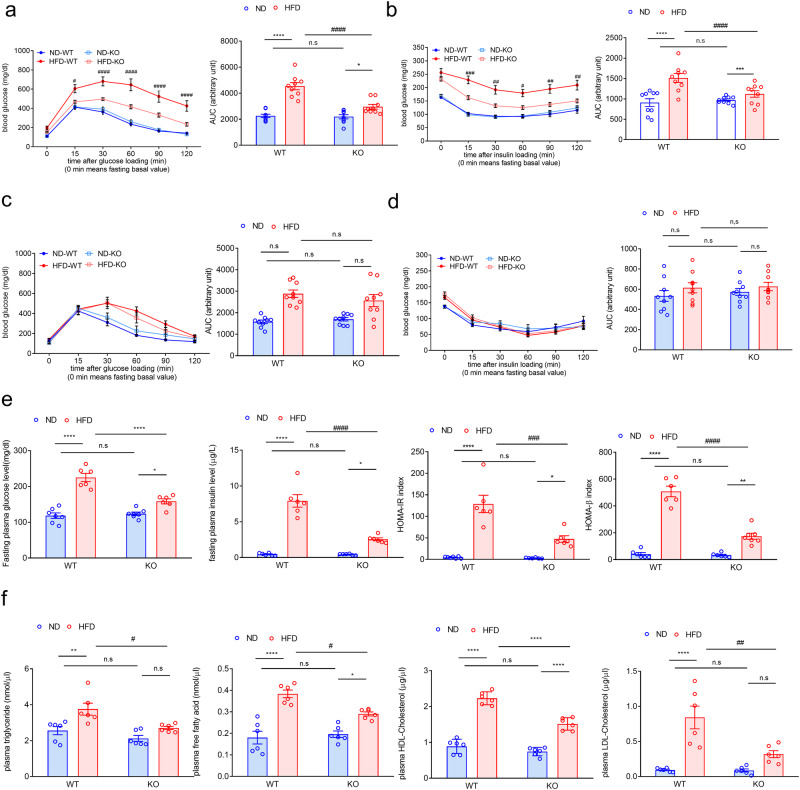
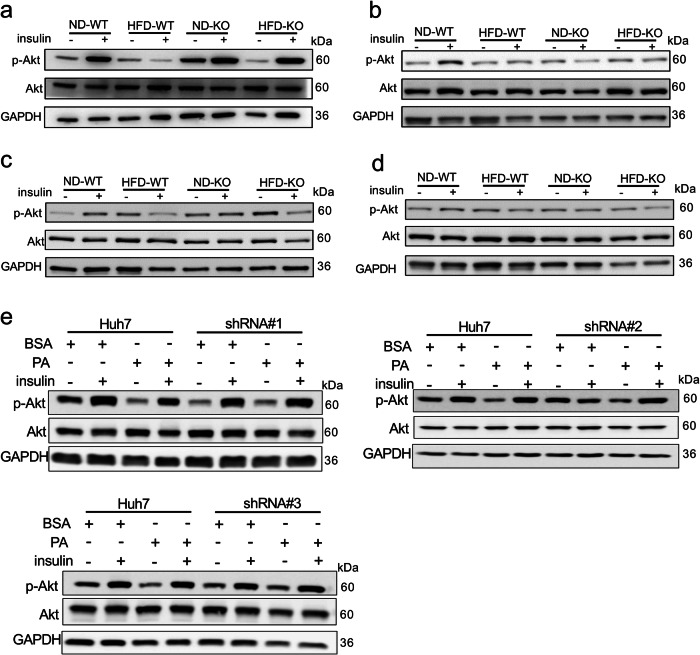
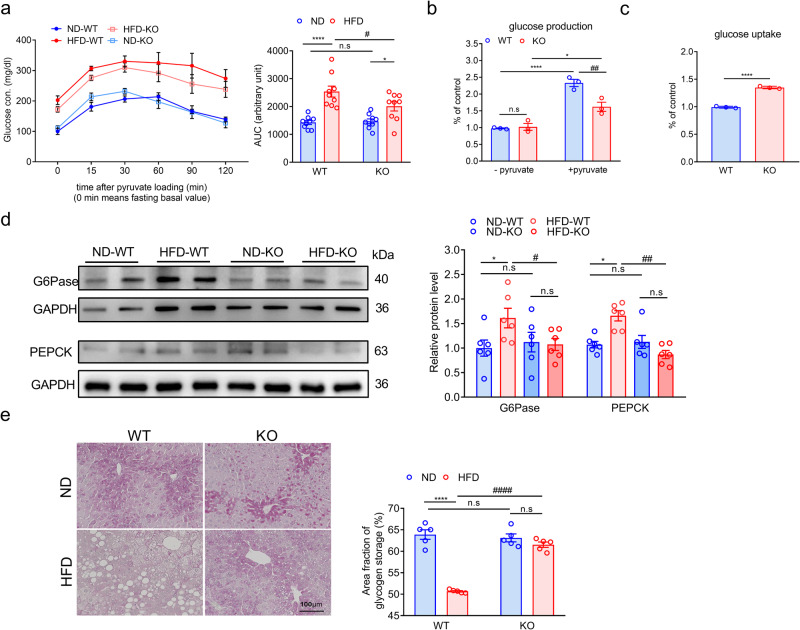
Non-alcoholic fatty liver disease (NAFLD) is a chronic disease caused by hepatic steatosis. Adenosine deaminases acting on RNA (ADARs) catalyze adenosine to inosine RNA editing. However, the functional role of ADAR2 in NAFLD is unclear. ADAR2+/+/GluR-BR/R mice (wild type, WT) and ADAR2-/-/GluR-BR/R mice (ADAR2 KO) mice are fed with standard chow or high-fat diet (HFD) for 12 weeks. ADAR2 KO mice exhibit protection against HFD-induced glucose intolerance, insulin resistance, and dyslipidemia. Moreover, ADAR2 KO mice display reduced liver lipid droplets in concert with decreased hepatic TG content, improved hepatic insulin signaling, better pyruvate tolerance, and increased glycogen synthesis. Mechanistically, ADAR2 KO effectively mitigates excessive lipid production via AMPK/Sirt1 pathway. ADAR2 KO inhibits hepatic gluconeogenesis via the AMPK/CREB pathway and promotes glycogen synthesis by activating the AMPK/GSK3β pathway. These results provide evidence that ADAR2 KO protects against NAFLD progression through the activation of AMPK signaling pathways.


Conflict of interest statement

The authors declare no competing interests.

Figures

Fig. 1
Fig. 1. ADAR2 KO suppresses lipid accumulation in hepatocytes.
a Western blot of ADAR2 expression in the livers of C57BL/6J mice after normal diet (ND) or high‐fat diet (HFD) consumption for 12 weeks (n = 4 mice/group). b Western blot of ADAR2 expression in Huh7 cells stimulated with palmitic acid (PA) (0.25 mM) for 24 h (n = 6, three independent experiments). c Western blot of ADAR2 expression in ADAR2-deficient Huh7 cells (n = 6, three independent experiments). d Representative Oil red O image of lipid drop accumulation in ADAR2-deficient Huh7 cells stimulated with palmitic acid (PA) (0.25 mM) for 24 h (n = 3, three independent experiments). e Western blot of de novo lipogenesis-related protein in ADAR2-deficient Huh7 cells stimulated with palmitic acid (PA) (0.25 mM) for 24 h (n = 3, three independent experiments).
Fig. 2
Fig. 2. ADAR2 KO decreased body weight and liver weight in male obese mice.
Physiological parameters in mice from the age of 5–17 weeks (n = 18 mice/group) (a, male; b, female) body weight (BW, g); (c, male; d, female) weights of liver, epididymal adipose, BAT, epicardial adipose, and kidney derived from WT and ADAR2 KO mice fed with ND or HFD are shown (n = 18) All data are expressed as mean ± SEM. Tukey’s multiple comparison test after the two-way ANOVA was conducted for (ad). *ND-WT group versus HFD-WT group or ND-KO group versus HFD-KO group; **p < 0.01, ***p < 0.001, ****p < 0.0001; #HFD-WT group versus HFD-KO group; ##p < 0.01, ###p < 0.001, ####p < 0.0001; n.s, not significant.
Fig. 3
Fig. 3. ADAR2 KO ameliorates glucose intolerance and insulin intolerance in male obese mice.
The blood glucose levels in WT and ADAR2 KO mice fed with ND or HFD for 12 weeks (at the age of 17 weeks old) were measured at 2 h after glucose (male: a, female: c) and insulin (male: b, female: d) injections. ipGTT-area under the curve (AUC) quantification (0–120 min) (male: a, female: c) and ipITT-area under the curve (AUC) quantification (0–120 min) (male: b, female: d) were shown (n = 9 mice/group). e Fasting plasma glucose levels, fasting plasma insulin levels, and calculated HOMA-IR index of male mice (n = 6 mice/group). f Plasma levels of TG, free fatty acid, HDL-cholesterol, and LDL-cholesterol in male mice (n = 6 mice/group). All data are expressed as mean ± SEM. Tukey’s multiple comparison test after the two-way ANOVA was conducted for (af). *ND-WT group versus HFD-WT group or ND-KO group versus HFD-KO group; *p < 0.05, **p < 0.01, ***p < 0.001, ****p < 0.0001; #HFD-WT group versus HFD-KO group; #p < 0.05, ##p < 0.01, ###p < 0.001, ####p < 0.0001; n.s. not significant.
Fig. 4
Fig. 4. ADAR2 KO reduces lipid deposition in the liver.
a Representative H&E staining of the liver, WAT, and BAT derived from WT and ADAR2 KO mice fed with ND or HFD is shown (Left panel), and quantitative analysis of lipid droplets of the liver, WAT and BAT in each group (Right panel). Scale bars = 100 µm (n = 5 mice/group). b Quantitative results of the liver TG content in each group (n = 9 mice/group). c Western blot assays of the proteins associated with the SREBP-1c-mediated lipogenesis pathway in each group (Left panel) and Quantitative analysis of the proteins associated with the SREBP-1c-mediated lipogenesis pathway in each group. All data were analyzed using 17-week-old mice after ND or HFD feeding for 12 weeks (n = 6 mice/group, three independent experiments). All data are expressed as mean ± SEM. Tukey’s multiple comparison test after the two-way ANOVA was conducted for (ac). *ND-WT group versus HFD-WT group or ND-KO group versus HFD-KO group; *p < 0.05, **p < 0.01, ***p < 0.001, ****p < 0.0001; #HFD-WT group versus HFD-KO group; #p < 0.05, ##p < 0.01, ###p < 0.001; n.s, not significant.
Fig. 5
Fig. 5. Insulin signaling in ADAR2 KO mice and ADAR2-deficient Huh7 cells.
Immunoblot analyses on phosphorylation at Ser473 of Akt in the a liver, b muscle, c WAT, and d BAT of mice fed with ND and HFD. Each band represents a tissue extract from a single mouse. All data were analyzed using 17-week-old mice after ND or HFD feeding for 12 weeks (n = 3 mice/group, three independent experiments). e ADAR2-deficient Huh7 cells. Cells were treated with 0.25 mM PA for 24 h and then were stimulated with or without insulin for 30 min (n = 3 mice/group, three independent experiments).
Fig. 6
Fig. 6. Glucose metabolism in the liver of ADAR2 KO mice.
a Plasma glucose levels during PTT in male mice fed with ND and HFD and analysis of area under the curve (AUC) of IPPTT results. n = 9 mice per group. b Basal and pyruvate-induced glucose release into the medium after 4 h incubation in primary hepatocytes isolated from ADAR2 KO and WT mice. Results are derived from three independent experiments performed in triplicate. c Insulin-stimulated glucose uptake in primary hepatocytes from ADAR2 KO and WT mice. Results are derived from three independent experiments performed in triplicate. d Western blot assays of the proteins associated with gluconeogenesis in each group and Quantitative analysis of the proteins associated with gluconeogenesis in each group (n = 6 mice/group, three independent experiments). e Representative photographs of PAS staining in liver sections. n = 5 mice per group. All data are expressed as mean ± SEM. Tukey’s multiple comparison test after the two-way ANOVA was conducted for (a, b, d and e). Unpaired two-tailed Student’s t-test was conducted for (c). *ND-WT group versus HFD-WT group or ND-KO group versus HFD-KO group; *p < 0.05, ****p < 0.0001; #HFD-WT group versus HFD-KO group; #p < 0.05, ##p < 0.01, ####p < 0.0001; n.s, not significant.
Fig. 7
Fig. 7. ADAR2 KO promotes activation of AMPK signaling in HFD-induced MAFLD of mice.
a Gene ontology analysis showed the changed gene enrichment in the major pathway. b Gene set enrichment analysis showed the enrichment of signaling pathways associated with lipid metabolism in the livers of HFD-WT and HFD-KO mice after 12 weeks of the HFD feeding (n = 6 mice/group). c Relative mRNA expression levels of PPARα, PGC1α, and CPT1A in the liver were measured by qPCR (n = 6 samples/group, three independent experiments). d Relative protein expression levels of p-AMPK, AMPK, and sirt1 in the liver were determined by western blotting (n = 6/group, three independent experiments). e Relative protein expression levels of p-GSK3β, GSK3β, p-CREB, and CREB in the liver were determined by western blotting (n = 6/group, three independent experiments).

References

    1. Liu A, et al. Nonalcoholic fatty liver disease: epidemiology, liver transplantation trends and outcomes, and risk of recurrent disease in the graft. J. Clin. Transl. Hepatol. 2018;6:420–424. doi: 10.14218/JCTH.2018.00010. - DOI - PMC - PubMed
    1. Anstee QM, McPherson S, Day CP. How big a problem is non-alcoholic fatty liver disease? BMJ. 2011;343:d3897. doi: 10.1136/bmj.d3897. - DOI - PubMed
    1. Yi M, Chen RP, Yang R, Chen H. Increased prevalence and risk of non-alcoholic fatty liver disease in overweight and obese patients with Type 2 diabetes in South China. Diabetes Med. 2017;34:505–513. doi: 10.1111/dme.13174. - DOI - PubMed
    1. Dvorak K, et al. The prevalence of nonalcoholic liver steatosis in patients with type 2 diabetes mellitus in the Czech Republic. Biomed. Pap. Med. Fac. Univ. Palacky Olomouc Czech Repub. 2015;159:442–448. doi: 10.5507/bp.2014.033. - DOI - PubMed
    1. Abd El-Kader SM, El-Den Ashmawy EM. Non-alcoholic fatty liver disease: the diagnosis and management. World J. Hepatol. 2015;7:846–858. doi: 10.4254/wjh.v7.i6.846. - DOI - PMC - PubMed

Publication types

MeSH terms