. 2024 May 17;10(1):53.
doi: 10.1038/s41540-024-00378-w.

Comprehensive molecular interaction map of TGFβ induced epithelial to mesenchymal transition in breast cancer

Affiliations

Comprehensive molecular interaction map of TGFβ induced epithelial to mesenchymal transition in breast cancer

Sai Bhavani Gottumukkala et al. NPJ Syst Biol Appl. .

Abstract

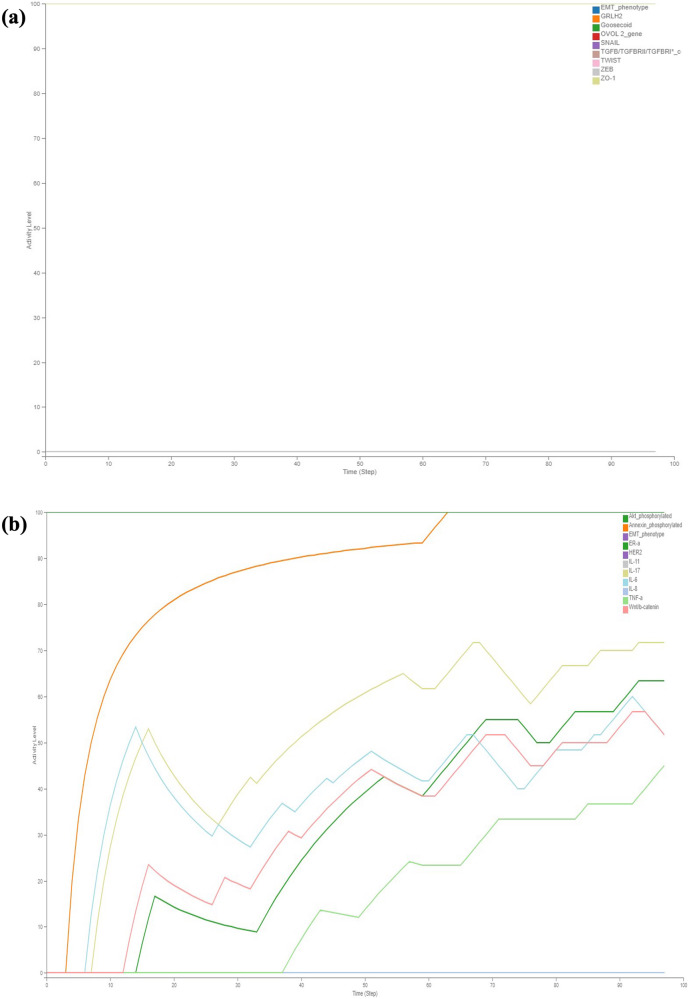
Breast cancer is one of the prevailing cancers globally, with a high mortality rate. Metastatic breast cancer (MBC) is an advanced stage of cancer, characterised by a highly nonlinear, heterogeneous process involving numerous singling pathways and regulatory interactions. Epithelial-mesenchymal transition (EMT) emerges as a key mechanism exploited by cancer cells. Transforming Growth Factor-β (TGFβ)-dependent signalling is attributed to promote EMT in advanced stages of breast cancer. A comprehensive regulatory map of TGFβ induced EMT was developed through an extensive literature survey. The network assembled comprises of 312 distinct species (proteins, genes, RNAs, complexes), and 426 reactions (state transitions, nuclear translocations, complex associations, and dissociations). The map was developed by following Systems Biology Graphical Notation (SBGN) using Cell Designer and made publicly available using MINERVA ( http://35.174.227.105:8080/minerva/?id=Metastatic_Breast_Cancer_1 ). While the complete molecular mechanism of MBC is still not known, the map captures the elaborate signalling interplay of TGFβ induced EMT-promoting MBC. Subsequently, the disease map assembled was translated into a Boolean model utilising CaSQ and analysed using Cell Collective. Simulations of these have captured the known experimental outcomes of TGFβ induced EMT in MBC. Hub regulators of the assembled map were identified, and their transcriptome-based analysis confirmed their role in cancer metastasis. Elaborate analysis of this map may help in gaining additional insights into the development and progression of metastatic breast cancer.


Conflict of interest statement

The authors declare no competing interests.

Figures

Fig. 1
Fig. 1. Molecular regulatory map of metastatic breast cancer.
The map represents proteins in green, RNAs in lime green, genes in canary, and phenotypes in pink. Interactions among regulators are displayed in black and inhibitions are displayed in red. Compartments are distinguished as bounding boxes. The SBGN-compliant map consists of 312 species, 426 interactions built using Cell Designer V 4.4. The map captures the TGFβ induced epithelial-to-mesenchymal transition signalling network in metastatic breast cancer. TGFβ parallelly regulates other signaling pathways like TNF-α, integrins, EGFR, in modulating the regulators associated with mesenchymal phenotype and epithelial phenotype further moderating EM transition.
Fig. 2
Fig. 2. MBC Map in the MINERVA platform.
Users can search for their regulator of interest from the search box. The results are shown as pins. The annotations of the corresponding regulators like HGNC ID, Uniport ID, Ensembl identifiers are displayed on the left upon selecting any element along with the PUBMED identifiers. Further users can also navigate interactions starting from a molecule of interest tracking the signal from TGFβ to the end phenotype. MAP is available at: http://35.174.227.105:8080/minerva/?id=Metastatic_Breast_Cancer_1.
Fig. 3
Fig. 3. Discrete dynamic modelling and analysis of the assembled MBC map illustrating the activity of various EMT factors and receptors regulating them using Cell Collective in the absence of stimulus TGFβ.
a The activity of all the mesenchymal markers was observed to be at their minimal levels and the epithelial markers were observed to be at maximal levels, b The activity of the receptors associated with epithelial phenotype remained at their maximum while the receptors associated with mesenchymal phenotype remain at their minimal level. The observation of moderate activity in Akt signaling and proinvasive genes suggests the presence of cross-regulation among the signaling molecules.
Fig. 4
Fig. 4. Discrete dynamic modelling and analysis of the assembled MBC map illustrating the activity of various key signaling pathways of EMT and miRNAs using Cell Collective in the absence of stimulus TGFβ.
a The regulators involved in modulating the expressions of EMT markers exhibit moderate to minimum activity levels over time, with the notable exceptions of NF-kB, PI3K, and Metadherin regulators, b Epithelial miRNAs show maximum activity levels, while miRNAs regulating the mesenchymal phenotype were observed to exhibit minimum activity.
Fig. 5
Fig. 5. Discrete dynamic modelling and analysis of the assembled MBC map activity of various EMT factors and receptors regulating them using Cell Collective in the presence of stimulus TGFβ.
a Shows maximum activation of core transcription factors of EMT like ZEB, SNAIL, and TWIST along with the upregulation of the EMT marker Goosecoid in regulating EMT. Simultaneously, the activity of the epithelial gene ZO-1 was observed to be reduced. b Induction of the other signaling pathways HER, TNF-α, Wnt, Akt and proinvasive genes along with the concurrent loss of ER-α was observed. Notably, the coexistence of epithelial and mesenchymal regulators (i.e., hybrid phenotype) was observed in the presence of TGFβ.
Fig. 6
Fig. 6. Discrete dynamic modelling and analysis of the assembled MBC map illustrating the activity of various key signaling pathways of EMT and miRNAs using Cell Collective in the presence of stimulus TGFβ.
a The regulators responsible for maintaining the epithelial phenotype were observed to exhibit reduced activity, while those governing the mesenchymal phenotype were observed to display increased activity, driving EMT. b The activity of miRNAs governing epithelial phenotype was observed to decrease, while that of mesenchymal miRNAs was increased, with a few exceptions; Notably, the coexistence of epithelial and mesenchymal regulators (i.e., hybrid phenotype) was observed in the presence of TGFβ.
Fig. 7
Fig. 7. Visualisation of the assembled map using Cytoscape.
The assembled map of metastatic breast cancer (MBC) visualised using the Compound Spring Embedder (CoSE) layout within the Cytoscape. This visualisation highlights the intricate relationships within the MBC network. The network is visualised as a complex structure comprising a single centrally connected network (graph) and 37 separate subgraphs.
Fig. 8
Fig. 8. Hub genes identified using Cytohubba.
Top 25 influential genes in the assembled MBC as identified by the cytohubba tool employing the MCC (Maximal Clique Centrality) method. Hub genes are those genes that are members of the largest cliques within the network. The level of importance for these hubs was visually represented using a colour scale from highly significant to significant genes (red to yellow).
Fig. 9
Fig. 9. Transcriptome-based analysis of the significant hub genes.
Violin plots illustrating the expression patterns of prognostically significant hub genes identified in invasive breast carcinoma. These plots compare the gene expression across tumour, normal, and metastatic RNA-seq data. The bars within the plots represent the proportions of samples, and the statistical analysis was conducted based on Kruskal–Wallis test for the regulators with log p < 0.05 from survival analysis (Table 2).
Fig. 10
Fig. 10. Workflow for the development and analysis of a comprehensive disease map of TGFβ induced EMT in MBC.
This figure illustrates the workflow for developing a comprehensive disease map of the signaling pathways involved in TGFβ induced epithelial-to-mesenchymal transition (EMT) in metastatic breast cancer (MBC). The development of a map is an iterative process involving the integration of information from various experimental studies found in the scientific literature. The final map is made publicly available through the MINERVA platform and is subjected to further validation through various analyses.

Similar articles

Cited by

References

    1. Desantis CE, et al. Breast cancer statistics, 2019. CA: A Cancer J. Clin. 2019;69:438–451. - PubMed
    1. Ferlay, J. et al. Global Cancer Observatory: Cancer Today. <Available from: https://gco.iarc.fr/today(International Agency for Research on Cancer, Lyon, France,2020) accessed [24 February 2022].
    1. Wei S, Siegal GP. Metastatic organotropism: an intrinsic property of breast cancer molecular subtypes. Adv. Anat. Pathol. 2017;24:78–81. doi: 10.1097/PAP.0000000000000140. - DOI - PubMed
    1. Blanco MA, Kang Y. Signaling pathways in breast cancer metastasis - novel insights from functional genomics. Breast Cancer Res. 2011;13:206. doi: 10.1186/bcr2831. - DOI - PMC - PubMed
    1. Vella, V. et al. Microenvironmental determinants of breast cancer metastasis: focus on the crucial interplay between estrogen and insulin/insulin-like growth factor signaling. Front. Cell Dev. Biol. 1458 10.3389/fcell.2020.608412 (2020). - PMC - PubMed

MeSH terms