

Assessment of TROP2, CEACAM5 and DLL3 in metastatic prostate cancer: Expression landscape and molecular correlates
- PMID: 38760413
- PMCID: PMC11101486
- DOI: 10.1038/s41698-024-00599-6
Assessment of TROP2, CEACAM5 and DLL3 in metastatic prostate cancer: Expression landscape and molecular correlates
Abstract
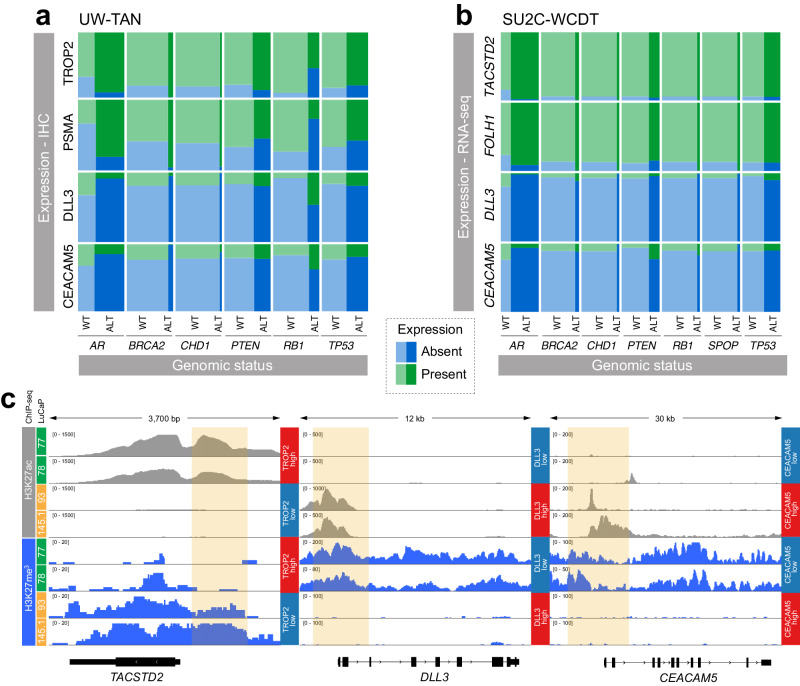
Therapeutic approaches targeting proteins on the surface of cancer cells have emerged as an important strategy for precision oncology. To capitalize on the potential impact of drugs targeting surface proteins, detailed knowledge about the expression patterns of the target proteins in tumor tissues is required. In castration-resistant prostate cancer (CRPC), agents targeting prostate-specific membrane antigen (PSMA) have demonstrated clinical activity. However, PSMA expression is lost in a significant number of CRPC tumors. The identification of additional cell surface targets is necessary to develop new therapeutic approaches. Here, we performed a comprehensive analysis of the expression heterogeneity and co-expression patterns of trophoblast cell-surface antigen 2 (TROP2), delta-like ligand 3 (DLL3), and carcinoembryonic antigen-related cell adhesion molecule 5 (CEACAM5) in CRPC samples from a rapid autopsy cohort. We show that DLL3 and CEACAM5 exhibit the highest expression in neuroendocrine prostate cancer (NEPC), while TROP2 is expressed across different CRPC molecular subtypes, except for NEPC. We further demonstrated that AR alterations were associated with higher expression of PSMA and TROP2. Conversely, PSMA and TROP2 expression was lower in RB1-altered tumors. In addition to genomic alterations, we show a tight correlation between epigenetic states, particularly histone H3 lysine 27 methylation (H3K27me3) at the transcriptional start site and gene body of TACSTD2 (encoding TROP2), DLL3, and CEACAM5, and their respective protein expression in CRPC patient-derived xenografts. Collectively, these findings provide insights into patterns and determinants of expression of TROP2, DLL3, and CEACAM5 with implications for the clinical development of cell surface targeting agents in CRPC.
© 2024. The Author(s).
Conflict of interest statement
J. Zhao is currently an employee at Astra Zeneca. L.D. True is a co-founder and has equity in Alpenglow Biosciences. H.H. Cheng was a paid consultant to AstraZeneca in the past and has received research funding from Astellas, Clovis Oncology, Color Foundation, Janssen, Medivation, Promontory Therapeutics, Sanofi, and royalties from UpToDate. E.Y. Yu served as paid consultant/received honoraria Amgen, AstraZeneca, Bayer, Churchill, Dendreon, EMD Serono, Incyte, Janssen, Merck, Clovis, Pharmacyclics, QED, Seattle Genetics, and Tolmar and received research funding from Bayer, Daiichi-Sankyo, Dendreon, Merck, Taiho, and Seattle Genetics. R.B. Montgomery received research funding from AstraZeneca, ESSA, Ferring and Janssen Oncology. J.E. Hawley received consulting fees from ImmunityBio and research funding to her institution from Bristol Myers Squibb, Astra Zeneca, Vaccitech, Crescendo and Macrogenics. J. K. Lee has received research funding from Immunomedics and serves as a scientific advisor for and has equity in PromiCell Therapeutics. E. Corey received sponsored research funding from AbbVie, Astra Zeneca, Foghorn, Kronos, MacroGenics, Bayer Pharmaceuticals, Forma Pharmaceuticals, Janssen Research, Gilead, Arvina, and Zenith Epigenetics. J.M. Lang served as paid consultant/received honoraria from Sanofi, AstraZeneca, Gilead, Pfizer, Astellas, Seattle Genetics, Janssen, and Immunomedics. C.L. Sawyers serves on the board of directors of Novartis, is a co-founder of ORIC Pharmaceuticals, and is a co-inventor of enzalutamide and apalutamide. He is a science adviser to Arsenal, Beigene, Blueprint, Column Group, Foghorn, Housey Pharma, Nextech, KSQ, and PMV. M.T. Schweizer is a paid consultant/received honoraria from Sanofi, AstraZeneca, PharmaIn, and Resverlogix and has received research funding from Novartis, Zenith Epigenetics, Bristol Myers Squibb, Merck, Immunomedics, Janssen, AstraZeneca, Pfizer, Hoffman-La Roche, Tmunity, SignalOne Bio, Epigenetix, Xencor, Incyte and Ambrx, Inc. P.S. Nelson served as a paid advisor for Bristol Myers Squibb, Pfizer, and Janssen. M.C. Haffner served as a paid consultant/received honoraria from Pfizer and has received research funding from Merck, Novartis, Genentech, Promicell and Bristol Myers Squibb. All other authors declare no potential conflicts of interest.
Figures


Update of
-
ASSESSMENT OF CELL SURFACE TARGETS IN METASTATIC PROSTATE CANCER: EXPRESSION LANDSCAPE AND MOLECULAR CORRELATES.Res Sq [Preprint]. 2023 Dec 19:rs.3.rs-3745991. doi: 10.21203/rs.3.rs-3745991/v1. Res Sq. 2023. Update in: NPJ Precis Oncol. 2024 May 17;8(1):104. doi: 10.1038/s41698-024-00599-6. PMID: 38196594 Free PMC article. Updated. Preprint.
References
Grants and funding
LinkOut - more resources
Full Text Sources
Research Materials
Miscellaneous
