. 2025 Mar;43(3):369-383.
doi: 10.1038/s41587-024-02224-0. Epub 2024 May 17.

Engineered CRISPR-Cas12a for higher-order combinatorial chromatin perturbations

Affiliations

Engineered CRISPR-Cas12a for higher-order combinatorial chromatin perturbations

C C-S Hsiung et al. Nat Biotechnol. 2025 Mar.

Abstract

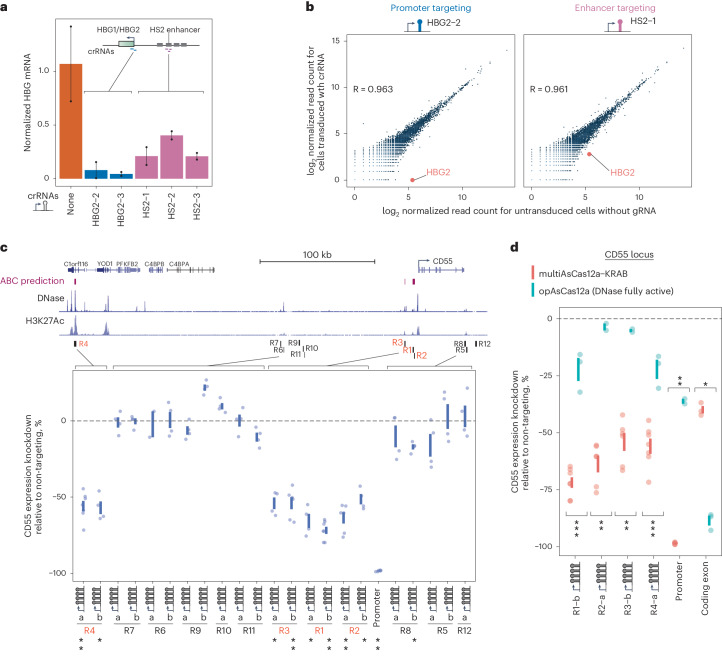
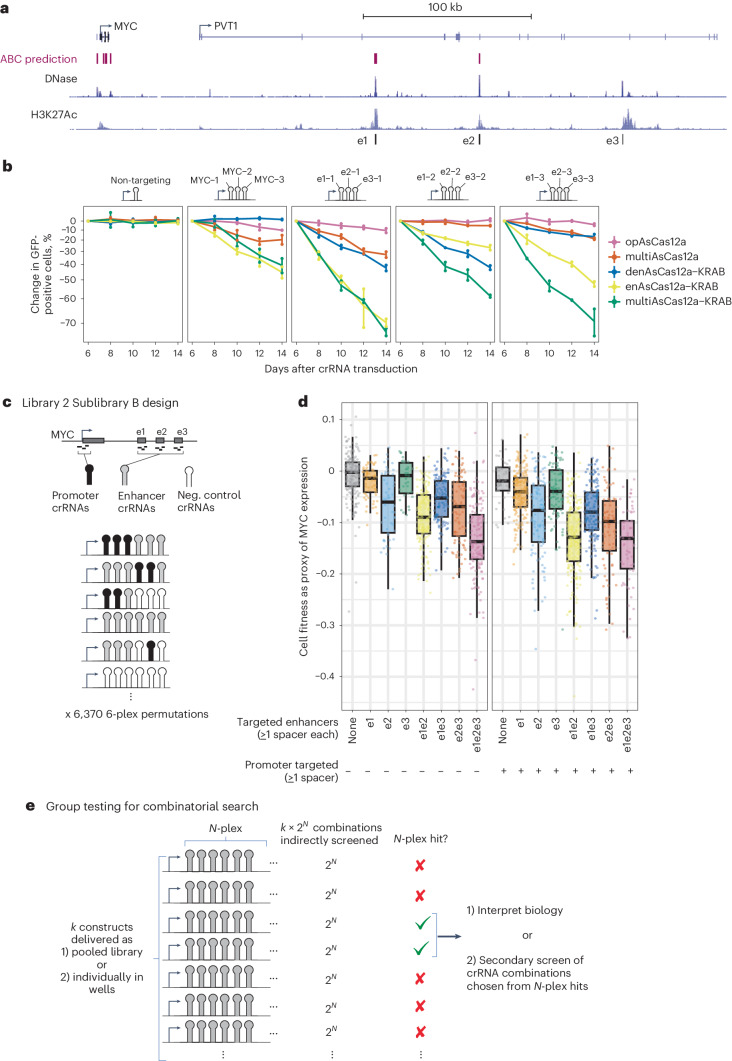
Multiplexed genetic perturbations are critical for testing functional interactions among coding or non-coding genetic elements. Compared to double-stranded DNA cutting, repressive chromatin formation using CRISPR interference (CRISPRi) avoids genotoxicity and is more effective for perturbing non-coding regulatory elements in pooled assays. However, current CRISPRi pooled screening approaches are limited to targeting one to three genomic sites per cell. We engineer an Acidaminococcus Cas12a (AsCas12a) variant, multiplexed transcriptional interference AsCas12a (multiAsCas12a), that incorporates R1226A, a mutation that stabilizes the ribonucleoprotein-DNA complex via DNA nicking. The multiAsCas12a-KRAB fusion improves CRISPRi activity over DNase-dead AsCas12a-KRAB fusions, often rescuing the activities of lentivirally delivered CRISPR RNAs (crRNA) that are inactive when used with the latter. multiAsCas12a-KRAB supports CRISPRi using 6-plex crRNA arrays in high-throughput pooled screens. Using multiAsCas12a-KRAB, we discover enhancer elements and dissect the combinatorial function of cis-regulatory elements in human cells. These results instantiate a group testing framework for efficiently surveying numerous combinations of chromatin perturbations for biological discovery and engineering.


Conflict of interest statement

Competing interests: C.C.H., C.M.W., R.D. and L.A.G. have filed patent applications related to multiAsCas12a. J.S. is a scientific consultant for Treeline Biosciences. L.A.G. has filed patents on CRISPRoff/on and CRISPR functional genomics and is a co-founder of Chroma Medicine. The other authors declare no competing interests.

Figures

Fig. 1
Fig. 1. dAsCas12a-KRAB variants are dose-limited and weak in CRISPRi activity when using lentivirally delivered crRNAs, despite incorporating state-of-the-art optimizations.
a, Schematic for assaying CRISPRi activity of AsCas12a constructs using lentivirally transduced single-plex or 3-plex crRNAs targeting cell surface marker genes assayed by antibody staining and flow cytometry. b, K562 cells constitutively expressing dAsCas12a-3xKRAB were lentivirally transduced with the indicated single crRNAs and assayed by flow cytometry 6 days after crRNA transduction. One of two biological replicates is shown; second replicate is shown in Supplementary Fig. 2. c, A panel of AsCas12a variants harboring combinations of mutations are tested using crCD55-4 and crCD81-1 using the fusion protein domain architecture shown. Both AsCas12a fusion protein and crRNA constructs are delivered by lentiviral transduction. D908A is a mutation in the RuvC catalytic triad that renders Cas12a DNase inactive,. Other mutations are described in detail in the main text. Shown are single-cell distributions of target gene expression assayed by flow cytometry 6 days after crRNA transduction for one of three independent replicates. Additional replicates and results for additional crRNA constructs (up to 3-plex crRNA constructs) are summarized in Supplementary Fig. 6a–c. d, Analysis of CD81 knockdown in cells lentivirally transduced with denAsCas12a-KRAB protein construct at multiplicity of infection (MOI) ~1 versus MOI ~5 while maintaining constant crRNA MOI (<0.74) for each crRNA construct. CD81 expression was assayed by flow cytometry 6 days after crRNA transduction. Shown are single-cell distributions for one out of 3–6 biological replicates for each crRNA construct. Summaries of all replicates shown in Supplementary Fig. 7a. e, Analysis of CD81 knockdown in cells lentivirally transduced with denAsCas12a-KRAB protein construct at MOI ~ 5, while crRNA MOI is changed from high to low as indicated. CD81 expression was assayed by flow cytometry 10 days after crRNA transduction. Shown are single-cell distributions of CD81 knockdown for one of two biological replicates. Second replicate shown in Supplementary Fig. 7b. be, Medians and interquartile ranges are shown for single-cell distributions (n > 200 cells per replicate). ce, Asterisks indicate P < 0.01 for comparing the replicate-level single-cell distributions of the paired conditions by one-sided Wilcoxon rank-sum test. Percentages of cells below the 5th percentile (dashed line) of non-targeting crRNA are also shown. Source data
Fig. 2
Fig. 2. MultiAsCas12a-KRAB (R1226A/E174R/S542R/K548R), an engineered variant that favors a nicked DNA intermediate, substantially improves lentivirally delivered CRISPRi activity.
a, Model of Cas12a DNA binding and cleavage states for wild-type DNase versus the R1226A nicking-biased mutant based on prior in vitro studies,,–. Sizes of arrows qualitatively reflect relative reaction rates within each biochemical step. b, Comparison of denAsCas12a-KRAB (D908A/E174R/S542R/K548R) versus multiAsCas12a-KRAB (R1226A/E174R/S542R/K548R) in CRISPRi knockdown of CD81 expression assayed by flow cytometry 10 days after crRNA transduction, using the combinations of MOI for crRNA and protein shown. One biological replicate is shown for each condition; additional replicates shown in Supplementary Fig. 9. c, Comparison of CD81 knockdown by lentivirally delivered denAsCas12a-KRAB versus multiAsCas12a-KRAB at protein MOI ~1 versus ~5 across a panel of single and 3-plex crRNA constructs, maintaining a constant crRNA MOI within each paired comparison of denAsCas12a-KRAB versus multiAsCas12a-KRAB. Lines connect paired experiments within each biological replicate. crRNA MOI indicated by color scale. Dots indicate flow cytometry measurement 10 days after crRNA transduction; triangles indicate measurements 16 days after crRNA transduction. d, Same as panel c, but showing scatter plot of CD55-APC and CD81-PE antibody co-staining signals on flow cytometry performed 16 days after transduction of the indicated crRNA constructs in K562 cells lentivirally transduced with denAsCas12a-KRAB versus multiAsCas12a-KRAB at protein MOI ~ 5. One-sided two-sample chi-square test was performed to compare the proportion of cells with double knockdown for denAsCas12a-KRAB versus multiAsCas12a-KRAB for a given crRNA construct (n > 200 cells per condition); asterisks indicate P < 0.01. e, K562 cells piggyBac-engineered to constitutively express denAsCas12a-KRAB or multiAsCas12a-KRAB were transduced with the indicated crRNA constructs, followed by measurement of CD151 expression by antibody staining and flow cytometry 13 days after crRNA transduction. Lines connect paired experiments within each replicate. crRNA MOI indicated by color scale. f, Indel quantification from PCR amplicons surrounding target sites of crCD81-1 and crCD55-4 in cells lentivirally transduced at protein MOI ~5 for denAsCas12a-KRAB and multiAsCas12a-KRAB. Cells lentivirally transduced with opAsCas12a (DNase fully active) are shown for comparison. Percent of reads containing indels at each base position within the amplicon is plotted, with labels indicating maximum indel frequency observed across all bases within the amplicon. be, dashed lines indicate 5th percentile of measurements for non-targeting crRNA. Asterisks indicate P < 0.01 for one-sided Wilcoxon rank-sum test of single-cell distributions (n > 200 cells per replicate) for a given paired comparison for all replicates shown. Source data
Fig. 3
Fig. 3. MultiAsCas12a-KRAB enables multigene CRISPRi perturbations using higher-order arrayed crRNA lentiviral constructs.
a, Schematic for higher-order crRNA expression constructs. bg, Experiments were performed on K562 cells engineered by piggyBac transposition of fusion protein constructs (except opAsCas12a was delivered by lentiviral transduction). b, Flow cytometry analysis of CD81 expression knockdown 6 days after transduction of the indicated lentiviral crRNA constructs. Shown are averages of median single-cell expression knockdown from two to five biological replicates for each crRNA construct, with error bars indicating standard error of the mean. One-sided Wilcoxon rank-sum test was performed for differences in single-cell expression distributions (n > 200 cells) for each fusion protein against multiAsCas12a-KRAB for each replicate. Asterisk indicates P < 0.01 for all replicates for a given pairwise comparison. c, Same as panel b, but shown for KIT expression knockdown. d, Indel quantification by Illumina sequencing of a 340 bp PCR amplicon surrounding two sites on opposite strands near the KIT TSS targeted by crKIT-2 and crKIT-3 encoded within a 6-plex crRNA array. Percentages indicates maximum fraction of reads containing indels overlapping any base position within each of the demarcated regions for each of the fusion protein constructs. e, Flow cytometry comparison of the indicated fusion protein constructs in dual CD55 and CD81 knockdown 10 days after lentiviral transduction of a 6-plex crRNA construct, shown for one biological replicate. Percentages of cells in each quadrant of the scatter plot, defined by the 5th percentile of non-targeting crRNA for each fluorescence signal, are indicated. One-sided, two-sample chi-square test was used to compare the proportion of cells (n = 56–5,006 cells per replicate) with double knockdown between multiAsCas12a-KRAB versus each of the other fusion protein constructs; asterisks indicate P < 0.01. f, Same analysis as panel e, but summarized for additional crRNA constructs and showing the percentage of cells with successful double knockdown of CD55 and CD81. Two to six biological replicates are shown as individual data points and summarized by the mean and standard error of the mean as error bars. g, Gene expression knockdown by multiAsCas12a-KRAB using 6-plex, 8-plex and 10-plex crRNA array constructs was measured by flow cytometry 10-11 days after lentiviral transduction of crRNA constructs. Shown are median gene expression knockdown averaged from two to four biological replicates, with error bars denoting standard error of the mean. From the two replicates for which all constructs were tested, one-sided Wilcoxon rank-sum test was performed to compare the single-cell distribution (n > 200 cells for each replicate) of the 6-plex #1 construct against each of the other constructs; asterisks indicate P < 0.01 for both replicates. Source data
Fig. 4
Fig. 4. MultiAsCas12a-KRAB enables TSS-targeting pooled CRISPRi screens, including with 6-plex crRNA arrays.
a, Design of Library 1, consisting of single crRNAs tiling TSS-proximal regions of essential genes. b, Library 1: Scatter plot of cell fitness scores in K562 cells for multiAsCas12a-KRAB versus denAsCas12a-KRAB for 3,357 single crRNA constructs with sufficient read coverage for analysis and targeting canonical TTTV PAMs within a −50-bp to +300-bp window of 559 essential gene TSSs. Marginal histograms show percentage of crRNA constructs with cell fitness score is lower than the 5th percentile of negative control crRNAs. c, Library 1: Moving average cell fitness score across all TTTV PAM-targeting crRNAs at each PAM position relative to the TSS for denAsCas12a-KRAB or multiAsCas12a-KRAB (left), shown for the 240 essential gene TSS’s for which analogous dCas9-KRAB NGG PAM tiling screen data is available in K562 cells (right). d, Design of Library 2 Sublibrary A, aimed at evaluating CRISPRi activity at each position in the 6-plex array. For each 6-plex array, a specific position is defined as the test position (which can encode either a TSS-targeting spacer or a negative control spacer), and the remaining positions are referred to as context positions encoding one of 5 sets of negative control spacers designated only for context positions. e, Library 2 Sublibrary A: Analysis of 2,391 6-plex constructs with sufficient read coverage and that encode in the test position one of 99 spacers that scored as strong hits as single crRNAs in the Library 1 screen (orange boxplots), or negative control crRNA (grey boxplots). Boxplots show cell fitness scores averaged from the top three context constructs of each test position spacer in the 6-plex array from two screen replicates. Recall is calculated as the percentage of essential TSS-targeting spacers (that were empirically active in the single crRNA Library 1 screen) with a cell fitness defect in the Library 2 6-plex crRNA array screen for a given test position, using the 5th percentile of constructs containing negative control spacer in the same test position as a threshold (dashed line) for calling hits. Boxplots display median, interquartile range, whiskers indicating 1.5× interquartile range, and outliers. One-sided Wilcoxon rank-sum test was performed for the difference in the distributions of negative control spacers (n = 69–506 constructs) versus TSS-targeting spacers (n = 20–99 constructs) at each position, with asterisks indicating P < 0.01. Source data
Fig. 5
Fig. 5. MultiAsCas12a-KRAB CRISPRi enables enhancer perturbation and discovery.
a, K562 cells lentivirally transduced at MOI ~5 to constitutively express multiAsCas12a-KRAB were lentivirally transduced with single crRNAs targeting the HBG1/HBG2 TSS’s or their known enhancer, HS2. Shown are HBG1/HBG2 mRNA levels measured by RT-qPCR, normalized to GAPDH mRNA levels for two biological replicates shown as individual data points connected by vertical line to denote the range. b, 3’ RNA-seq analysis for a subset of crRNAs shown in panel a. Additional crRNAs and analyses shown in Supplementary Fig. 11a–c. Pearson correlation coefficients are calculated for the transcriptome, excluding HBG2. c, Genome browser view of the CD55 locus, including predicted enhancers using the activity-by-contact model and DNase-seq and H3K27Ac ChIP-seq tracks from ENCODE. K562 cells piggyBac-engineered to constitutively express multiAsCas12a-KRAB were transduced with 4-plex crRNA constructs targeting each candidate region (R1–R12) in the CD55 locus, with R12 being a negative control region devoid of DNase hypersensitivity and H3K27Ac. For regions targeted by two distinct 4-plex crRNA constructs, each construct is labeled as ‘a’ or ‘b’. For comparison, targeting the CD55 promoter using a 6-plex crRNA array (crCD55-4_crB2M-1_crKIT-2_crKIT-3_crCD81-1) is included. CD55 expression was assayed by flow cytometry between 9 and 11 days after crRNA transduction. One-sided Wilcoxon rank-sum test was performed on the medians of single-cell expression knockdown across n = 2–7 biological replicates (shown as individual data points) for each crRNA construct, compared to the medians of single-cell expression knockdown of R12 (negative control region). **P = 0.01; *P = 0.03. Vertical lines denote standard error of the mean. d, Comparison of CRISPRi targeting in K562 cells engineered to constitutively express multiAsCas12a-KRAB (delivered by piggyBac) versus opAsCas12a (delivered by lentiviral transduction) using a subset of lentivirally transduced crRNA constructs from panel b, plus a crRNA construct targeting a coding exon of CD55 as a positive control for knockdown by DNA cutting. CD55 expression was assayed by flow cytometry 11 days after crRNA transduction. One-sided Wilcoxon rank-sum test was performed to compare the medians of single-cell expression knockdown of multiAsCas12a-KRAB versus opAsCas12a across n = 2–7 biological replicates (shown as individual data points, with vertical lines denoting standard error of the mean). ***P = 0.008; **P = 0.033–0.036; *P = 0.05. Source data
Fig. 6
Fig. 6. Higher-order combinatorial targeting of cis-regulatory elements by multiAsCas12a-KRAB instantiates a group testing framework.
a, Genome browser view of the MYC locus, including activity-by-contact model predictions, and DNase-seq and H3K27Ac ChIP-seq tracks from ENCODE. Three of the known MYC enhancers (e1, e2 and e3) in the body of the non-coding RNA, PVT1, are shown. b, K562 cells piggyBac-engineered to constitutively express the indicated panel of fusion protein constructs were transduced with one of four 3-plex crRNA constructs targeting the MYC promoter or cotargeting the three enhancers using one crRNA per enhancer. Cell fitness as a proxy of MYC expression is measured as log2 fold-change in percentage of cells expressing GFP marker on the crRNA construct, relative to day 6 after crRNA transduction. The averages of two biological replicates (n = 3,432–8,872 cells per replicate) are shown as individual data points and the range denoted by vertical lines. c, 6,370 6-plex permutations of the 12 individual spacers from panel b and three intergenic negative control spacers, were designed as 6-plex crRNA arrays in Library 2 Sublibrary B. d, Library 2 Sublibrary B: Analysis of 1,629 constructs with sufficient read coverage, categorized based on whether each contains at least one of three crRNAs that target the MYC promoter, and/or at least one crRNA that targets each of the MYC enhancers. Boxplots summarize cell fitness score distributions (as proxy of MYC expression) of all constructs that fall in each category. Boxplots show median, interquartile range, whiskers indicating 1.5× interquartile range, and are overlaid with individual data points each representing a 6-plex construct. e, A general framework for efficiently exploring combinations of CRISPR perturbations using the concept of group testing. Source data

Update of

References

    1. Wong, A. S. L., Choi, G. C. G. & Lu, T. K. Deciphering combinatorial genetics. Annu. Rev. Genet.50, 515–538 (2016). - PubMed
    1. Costanzo, M. et al. Global genetic networks and the genotype-to-phenotype relationship. Cell177, 85–100 (2019). - PMC - PubMed
    1. Domingo, J., Baeza-Centurion, P. & Lehner, B. The causes and consequences of genetic interactions (epistasis). Annu. Rev. Genomics Hum. Genet.20, 433–460 (2019). - PubMed
    1. Takahashi, K. & Yamanaka, S. Induction of pluripotent stem cells from mouse embryonic and adult fibroblast cultures by defined factors. Cell126, 663–676 (2006). - PubMed
    1. Ewen-Campen, B., Mohr, S. E., Hu, Y. & Perrimon, N. Accessing the phenotype gap: enabling systematic investigation of paralog functional complexity with CRISPR. Dev. Cell43, 6–9 (2017). - PubMed

MeSH terms