. 2024 Jun;43(12):2397-2423.
doi: 10.1038/s44318-024-00108-2. Epub 2024 May 17.

Decitabine cytotoxicity is promoted by dCMP deaminase DCTD and mitigated by SUMO-dependent E3 ligase TOPORS

Affiliations

Decitabine cytotoxicity is promoted by dCMP deaminase DCTD and mitigated by SUMO-dependent E3 ligase TOPORS

Christopher J Carnie et al. EMBO J. 2024 Jun.

Abstract

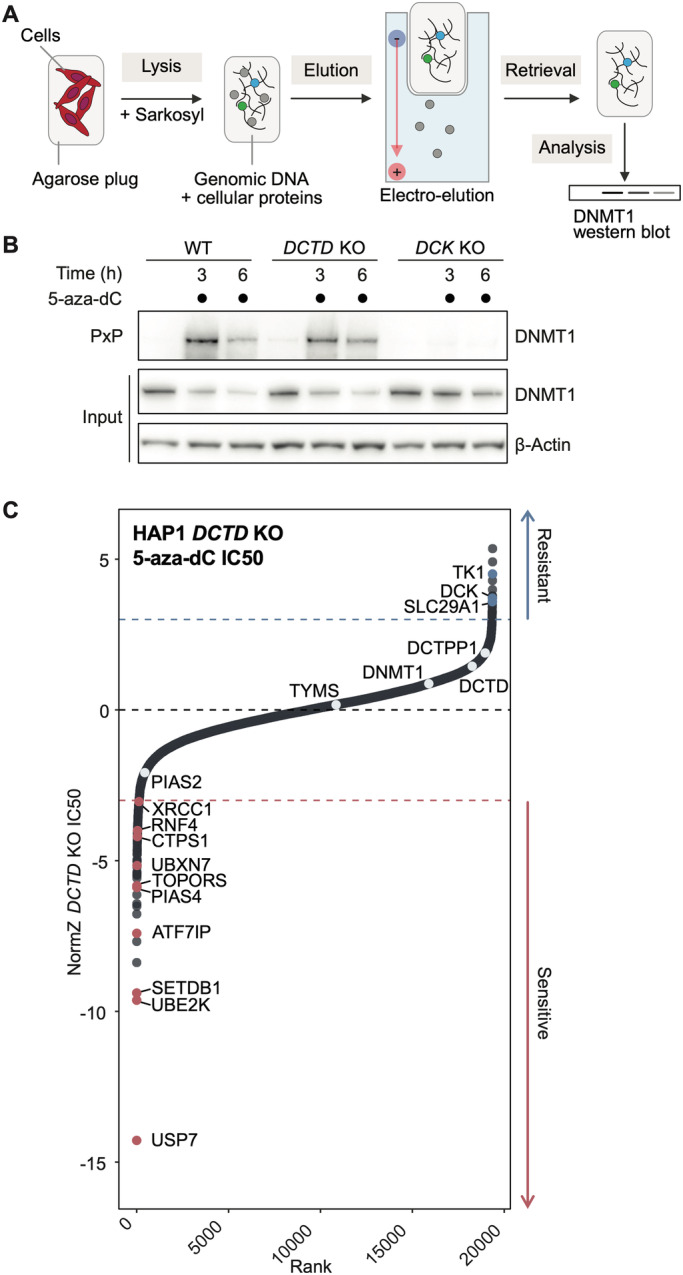
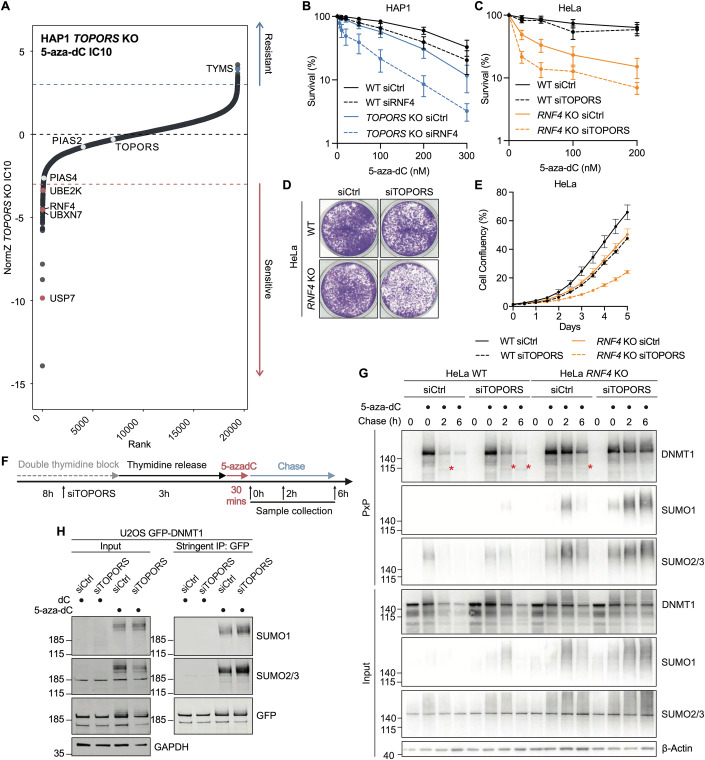
The nucleoside analogue decitabine (or 5-aza-dC) is used to treat several haematological cancers. Upon its triphosphorylation and incorporation into DNA, 5-aza-dC induces covalent DNA methyltransferase 1 DNA-protein crosslinks (DNMT1-DPCs), leading to DNA hypomethylation. However, 5-aza-dC's clinical outcomes vary, and relapse is common. Using genome-scale CRISPR/Cas9 screens, we map factors determining 5-aza-dC sensitivity. Unexpectedly, we find that loss of the dCMP deaminase DCTD causes 5-aza-dC resistance, suggesting that 5-aza-dUMP generation is cytotoxic. Combining results from a subsequent genetic screen in DCTD-deficient cells with the identification of the DNMT1-DPC-proximal proteome, we uncover the ubiquitin and SUMO1 E3 ligase, TOPORS, as a new DPC repair factor. TOPORS is recruited to SUMOylated DNMT1-DPCs and promotes their degradation. Our study suggests that 5-aza-dC-induced DPCs cause cytotoxicity when DPC repair is compromised, while cytotoxicity in wild-type cells arises from perturbed nucleotide metabolism, potentially laying the foundations for future identification of predictive biomarkers for decitabine treatment.

Keywords: DNA–Protein Crosslinks; Genome Stability; Hypomethylating Agents; Nucleotide Metabolism; SUMO-targeted Ubiquitylation.


Conflict of interest statement

The authors declare no competing interests.

Figures

Figure 1
Figure 1. Loss of DCTD confers resistance to 5-aza-dC.
(A) Schematic outlining genome-wide CRISPR/Cas9 screen with 5-aza-dC in HAP1 cells. (B) Rank plot displaying selected hits from CRISPR/Cas9 screen with 5-aza-dC, outlined in (A); dotted lines at NormZ scores of +3/−3 indicate thresholds for resistance/sensitivity hits, respectively. (C) Schematic detailing the existing model of 5-aza-dC action and the additional action suggested by our CRISPR screen. Factors whose loss confers resistance/sensitivity to 5-aza-dC in the CRISPR screen in (B) are displayed in blue/red, respectively. * Denotes inferred enzymatic activity based on its yeast homologue. Green ticks denote alignment between our CRISPR/Cas9 screen outputs and expectations of the existing model of 5-aza-dC action, while red crosses denote disagreement between screen outputs and the existing model. (D) Clonogenic survival assays in WT, DCTD KO and DCK KO HAP1 cells treated with 5-aza-dC and stained 6 days later; n = 3 biological replicates, error bars ± SEM. (E) Representative images from (D) of cells at selected 5-aza-dC doses. Source data are available online for this figure.
Figure 2
Figure 2. 5-aza-dC cytotoxicity is driven by DNMT1-dependent and -independent mechanisms.
(A) Schematic detailing the PxP assay. Cells are harvested and cast into low-melt agarose plugs. Plugs are transferred to the denaturing lysis buffer. After lysis is completed, plugs are placed into the pockets of an SDS-PAGE-gel and non-crosslinked proteins are eluted by electrophoresis. Finally, plugs are retrieved from the gel pockets and boiled with LDS sample buffer. For DPC detection, samples are run on SDS-PAGE gels and quantified by western blotting. (B) DNMT1-DPC formation assessed by PxP in WT, DCTD KO and DCK KO HAP1 cells treated with 5-aza-dC (1 μM) for the indicated times; representative of three independent experiments. (C) Rank plot of a genome-wide CRISPR/Cas9 screen in DCTD KO HAP1 cells treated with 5-aza-dC; dotted lines at NormZ scores of +3/−3 indicate threshold for resistance/sensitivity hits, respectively. Source data are available online for this figure.
Figure 3
Figure 3. iPOND identifies SUMO- and ubiquitin-dependent DNMT1-DPC-proximal factors.
(A) Schematic outlining the iPOND approach. (B) HeLa TREx cells were treated with 5-aza-dC (10 μM), EdU (10 μM) or both and processed as depicted in (A). Samples were analysed by western blot using the indicated antibodies. Brightness and contrast was adjusted globally in ImageLab (Bio-Rad, version 5.2) to help visualise bands. Unprocessed blots are provided with the source data. Blots are representative of three independent experiments. (C) Schematic outlining global-genome (GG-) DPC repair and the impacts of SUMO or ubiquitin E1 inhibitors on this pathway. (D) Ranked standardised enrichment of proteins detected by iPOND-MS from 5-aza-dC treated over untreated cells. Dotted lines indicate thresholds of ±2.326. Proteins with an FDR ≤1% are represented by red or blue dots. Four replicates were measured. (E) Ranked standardised enrichment of proteins detected by iPOND-MS from co-treatment with 5-aza-dC and SUMO E1i over untreated cells. Dotted lines indicate thresholds of ±2.326. Proteins with an FDR ≤1% are represented by red or blue dots. Four replicates were measured. (F) Ranked standardised enrichment of proteins detected by iPOND-MS from co-treatment with 5-aza-dC and Ub E1i over untreated cells. Dotted lines indicate thresholds of ± 2.326. Proteins with an FDR ≤1% are represented by red or blue dots. Four replicates were measured. (G) Scatter plot comparing standardised enrichment scores of iPOND-MS from (D) with NormZ score of the top 2% of hits from our 5-aza-dC CRISPR/Cas9 screen in DCTD KO cells from Fig. 2C. Dotted lines indicate thresholds of ±2.326. Source data are available online for this figure.
Figure 4
Figure 4. TOPORS is a SUMO-dependent DPC tolerance factor.
(A) Clonogenic survival assays in TP53 KO and three clonally-derived TP53/TOPORS DKO RPE1 cell lines treated with 5-aza-dC; n = 4 biological replicates, error bars ± SEM. (B) Clonogenic survival assays in WT and TOPORS KO HAP1 cells treated with 5-aza-dC; n = 4 biological replicates, error bars ± SEM. (C) Clonogenic survival assays in WT U2OS cells transfected with siCtrl or siTOPORS and treated with 5-aza-dC; n = 3 biological replicates, error bars ± SEM. (D) Clonogenic survival assays in WT and TOPORS KO HAP1 cells treated with formaldehyde; n = 3 biological replicates, error bars ± SEM. (E) Clonogenic survival assays in WT and TOPORS KO HAP1 cells transfected with indicated siRNAs and treated with 5-aza-dC; n = 3 biological replicates, error bars ± SEM. (F) Western blot against the indicated antibodies from siRNA-transfected cells in (E); representative of three independent experiments. (G) Proximity ligation assay in U2OS cells expressing GFP-DNMT1 and HA-TOPORS, released from a single thymidine block and treated with deoxycytidine (dC), 5-aza-dC and/or Ub E1i or SUMO E1i for 1 h before pre-extraction of non-chromatin-bound proteins and fixation; scale bars = 10 μm. (H) Quantification of per-nucleus mean PLA intensities from (G), normalised to the median from the 5-aza-dC-treated U2OS GFP-DNMT1/HA-TOPORS condition. Black dots display the median normalised PLA intensity of each biological replicate for each condition; for single antibody controls, n = 2 biological replicates with a line at the mean. For all other experimental conditions, n = 4 independent biological replicates, error bars ± SEM. (I) Co-immunoprecipitation of GFP from extracts of HeLa cells expressing GFP (EV) or GFP-TOPORSWT, released from thymidine block into S-phase and treated with dC, 5-aza-dC and/or SUMO E1i for 1 h, followed by western blotting for indicated proteins; representative of three independent experiments. Source data are available online for this figure.
Figure 5
Figure 5. TOPORS’ RING domain and SUMO-interacting motifs mediate 5-aza-dC tolerance.
(A) Domain map of TOPORS highlighting mutations made in the RING domain (CCAA) and of SIMs (ΔSIM). (B, C) Clonogenic survival assays in TOPORS KO cell lines with (B) or without (C) doxycycline-induced expression of the indicated forms of TOPORS, treated with 5-aza-dC; n = 4 biological replicates, error bars ± SEM. (D) Co-immunoprecipitation of GFP from extracts of HeLa cells expressing GFP (EV), GFP-TOPORSWT or GFP-TOPORSCCAA, released from thymidine block into S-phase and treated with dC or 5-aza-dC for 1 h, followed by western blotting for indicated proteins; representative of three independent experiments. (E) Co-immunoprecipitation and western blot as in (D) but under stringent, denaturing conditions; representative of three independent experiments. (F) Co-immunoprecipitation and western blotting as in (D) but with cells expressing GFP (EV), GFP-TOPORSWT or GFP-TOPORSΔSIM; representative of three independent experiments. Source data are available online for this figure.
Figure 6
Figure 6. TOPORS and RNF4 operate in parallel to promote DPC degradation.
(A) Rank plot of a genome-wide CRISPR/Cas9 screen in TOPORS KO HAP1 cells treated with 5-aza-dC; dotted lines at NormZ scores of +3/−3 indicate thresholds for resistance and sensitivity hits, respectively. (B) Clonogenic survival assays in WT and TOPORS KO HAP1 cells transfected with siCtrl or siRNF4 and treated with 5-aza-dC; n = 4 biological replicates, error bars ± SEM. Note: two repeats in WT cells are shared with data shown in EV5H. (C) Clonogenic survival assays in WT and RNF4 KO HeLa cells transfected with siCtrl or siTOPORS and treated with 5-aza-dC; n = 4 biological replicates, error bars ±  SEM. (D) Representative image of cell confluency of WT and RNF4 KO HeLa cells transfected with siCtrl or siTOPORS. (E) Cell confluency of WT and RNF4 KO HeLa cells transfected with siCtrl or siTOPORS for a period of 5 days; data shown at mean ± SD, n = 3. Cell confluency was monitored using IncuCyte live cell imaging. (F) Treatment schematic for PxP assay in (G). (G) HeLa WT or RNF4 KO were transfected with the indicated siRNAs, synchronised by double-thymidine block and treated with 5-aza-dC (10 μM) as depicted in (F). DNMT1-DPCs were isolated using PxP and analysed by western blotting using the indicated antibodies; representative of three independent experiments. Red asterisks (*) indicate SPRTN-dependent DNMT1 cleavage fragment. (H) Stringent immunoprecipitation of GFP-DNMT1 and subsequent western blotting from U2OS cells constitutively expressing GFP-DNMT1, transfected with siCtrl or siTOPORS and treated with dC or 5-aza-dC as indicated after release from a thymidine block into S-phase; representative of three independent experiments. Source data are available online for this figure.
Figure EV1
Figure EV1. DCTD promotes DNMT1-independent 5-aza-dC cytotoxicity.
(A, B) Western blot in WT and DCTD KO (A) or DCK KO (B) HAP1 cells with the indicated antibodies; representative of 3 (A) and 2 (B) independent experiments. The DCTD-specific band in (A) is marked with a red asterisk (*). (C) Speculative model for DCK-independent incorporation of 5-aza-dC into DNA and subsequent DNMT1 trapping. Briefly, upon cellular uptake, 5-aza-dC can be deaminated by CDA, followed by triphosphorylation involving the activity of TK1, followed by possible conversion of 5-aza-dUTP to 5-aza-dCTP by CTPS1 and subsequent DNA incorporation and DNMT1 trapping. (D) Western blot for the indicated antibodies in WT and DCTD KO HAP1 cells transfected with the indicated siRNAs; representative of three independent experiments. (E) Clonogenic survival assays with siRNA-transfected WT and DCTD KO cells from (D) treated with 5-aza-dC; n = 3 biological replicates, error bars ± SEM. (F) Representative images from (D) at selected 5-aza-dC doses. (G) Percentage of EdU-positive cells determined by flow cytometry of HAP1 WT, DCTD KO and DCK KO cells either untreated or treated with 1 μM 5-aza-dC for 3 h or 6 h; n = 3 biological replicates, error bars show mean ± SD. (H) Western blot with the indicated antibodies of polyclonal cell populations of WT and DCTD KO cells following CRISPR/Cas9-mediated depletion of PARP1 with the indicated sgRNAs; representative of two independent experiments. (I) Clonogenic survival assays on cells from (G) treated with 5-aza-dC; n = 3 biological replicates, error bars ± SEM. (J) Representative images from (I) at selected 5-aza-dC doses. Source data are available online for this figure.
Figure EV2
Figure EV2. iPOND identifies the SUMO- and ubiquitin-dependent DNMT1-DPC-proximal proteome.
(AC) Ranked standardised enrichment of proteasomal subunits detected by iPOND-MS from 5-aza-dC-treated (A), 5-aza-dC- and SUMO E1i-co-treated (B), and 5-aza-dC- and Ub E1i-co-treated (C) over untreated cells. (D) STRING analysis of proteins enriched on nascent DNA after 5-aza-dC treatment with SUMO/ubiquitin dependencies indicated, as assessed by iPOND-MS.
Figure EV3
Figure EV3. TOPORS loss sensitises cells to DPC-inducing agents.
(A) Validation by Sanger sequencing of TP53/TOPORS DKO RPE1 clones. (BD) Representative images of selected 5-aza-dC doses from clonogenic survival assays in Fig. 4A (B), Fig. 4B (C) and Fig. 4C (D). (E) Relative expression levels of TOPORS from U2OS cells 72 h after siRNA-mediated depletion of TOPORS measured by qPCR, relative to GAPDH expression and normalised to TOPORS expression level in siCtrl cells; n = 3 replicates, error bars ± SEM. (F) Representative images from clonogenic survival assays in Fig. 4D. (G, H) Clonogenic survival assays in WT and TOPORS KO HAP1 cells treated with camptothecin (G) and ionising radiation (IR; H); n = 3 biological replicates, error bars ± SEM. (I, J) Representative images from clonogenic survival assays in (G, H), respectively. Source data are available online for this figure.
Figure EV4
Figure EV4. TOPORS promotes 5-aza-dC resistance through its RING domain and SUMO-interaction motifs.
(A) Representative images from clonogenic survival assays in Fig. 4E. (B) Proximity ligation assay in U2OS cells expressing GFP-DNMT1 and HA-EV, treated with dC or 5-aza-dC; quantification in Fig. 4H. (C) Expression levels of HA-TOPORS after doxycycline induction measured by qPCR, relative to GAPDH expression and normalised to doxycycline-induced HA-TOPORSWT; n = 2 biological replicates performed in technical triplicate, error bars ± SEM. (D) Representative images from clonogenic survival assays in Fig. 5B,C. (E) Expression levels of TOPORS in U2OS GFP-DNMT1 cells measured by qPCR relative to GAPDH and normalised to U2OS GFP-DNMT1 cells expressing HA-EV; n = 2 biological replicates performed in technical triplicate. (F, G) Representative images (F) and quantification (G) of PLA in U2OS GFP-DNMT1 cells expressing HA-EV, HA-TOPORSWT or HA-TOPORSΔSIM treated with dC or 5-aza-dC; scale bars = 10 μm. In (G), black dots display the median normalised PLA intensity of each biological replicate for each condition; n = 3 independent biological replicates, error bars ± SEM. Source data are available online for this figure.
Figure EV5
Figure EV5. TOPORS functions in parallel to RNF4 and UBE2K to promote cellular 5-aza-dC tolerance.
(A) Western blot of RNF4 from HAP1 cells after siRNA-mediated depletion of RNF4; representative of two independent replicates. (B, C) Representative images at selected 5-aza-dC doses from clonogenic survival assays in Fig. 6B (B) and Fig. 6C (C). (D) Western blot of UBE2K in WT and UBE2K KO HAP1 cells; representative of two independent replicates. (E) Validation by Sanger sequencing of UBE2K/TOPORS DKO HAP1 clones. (F) Clonogenic survival assays in WT, UBE2K KO, TOPORS KO and UBE2K/TOPORS DKO HAP1 cells treated with 5-aza-dC; n = 3 biological replicates, error bars ± SEM. (G) Representative images of selected doses from (F). (H, I) Clonogenic survival assays with 5-aza-dC in WT and UBE2K KO (H; n = 4 biological replicates. Note that two replicates are shared with data shown in Fig. 6B) or UBE2K/TOPORS DKO #1 (I; n = 3 biological replicates) cells transfected with siCtrl or siRNF4; error bars ± SEM. (J, K) Representative images at selected 5-aza-dC doses from (H) and (I), respectively. Source data are available online for this figure.

References

    1. Almqvist H, Axelsson H, Jafari R, Dan C, Mateus A, Haraldsson M, Larsson A, Martinez Molina D, Artursson P, Lundbäck T, et al. CETSA screening identifies known and novel thymidylate synthase inhibitors and slow intracellular activation of 5-fluorouracil. Nat Commun. 2016;7:11040. doi: 10.1038/ncomms11040. - DOI - PMC - PubMed
    1. Arber DA, Orazi A, Hasserjian R, Thiele J, Borowitz MJ, Le Beau MM, Bloomfield CD, Cazzola M, Vardiman JW. The 2016 revision to the World Health Organization classification of myeloid neoplasms and acute leukemia. Blood. 2016;127:2391–2405. doi: 10.1182/blood-2016-03-643544. - DOI - PubMed
    1. Bejar R, Steensma DP. Recent developments in myelodysplastic syndromes. Blood. 2014;124:2793–2803. doi: 10.1182/blood-2014-04-522136. - DOI - PubMed
    1. Blum W. How much? How frequent? How long? A clinical guide to new therapies in myelodysplastic syndromes. Hematol Am Soc Hematol Educ Program. 2010;2010:314–321. doi: 10.1182/asheducation-2010.1.314. - DOI - PMC - PubMed
    1. Borgermann N, Ackermann L, Schwertman P, Hendriks IA, Thijssen K, Liu JC, Lans H, Nielsen ML, Mailand N. SUMOylation promotes protective responses to DNA-protein crosslinks. EMBO J. 2019;38:e101496. doi: 10.15252/embj.2019101496. - DOI - PMC - PubMed

MeSH terms

Substances