. 2024 May;4(5):664-680.
doi: 10.1038/s43587-024-00624-0. Epub 2024 May 17.

DDX5 inhibits hyaline cartilage fibrosis and degradation in osteoarthritis via alternative splicing and G-quadruplex unwinding

Affiliations

DDX5 inhibits hyaline cartilage fibrosis and degradation in osteoarthritis via alternative splicing and G-quadruplex unwinding

Qianqian Liu et al. Nat Aging. 2024 May.

Abstract

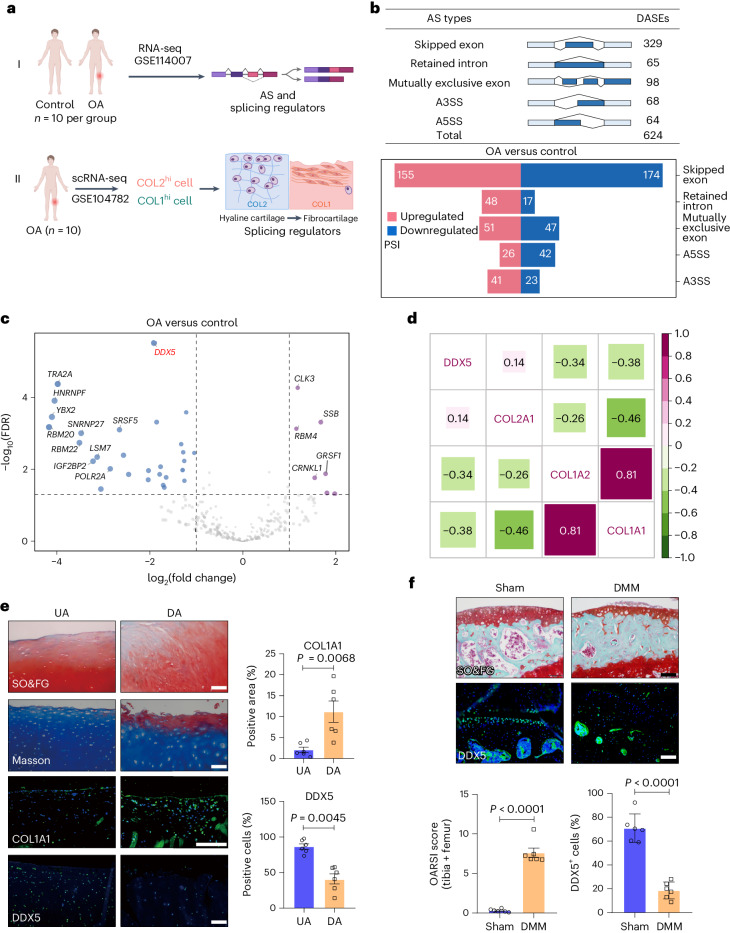
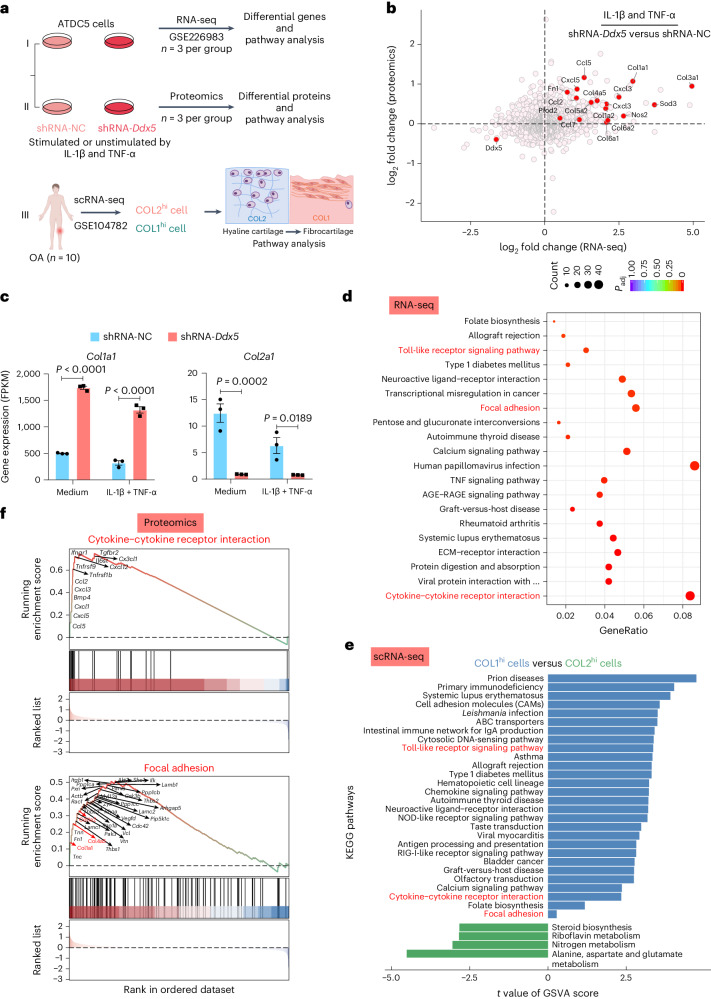
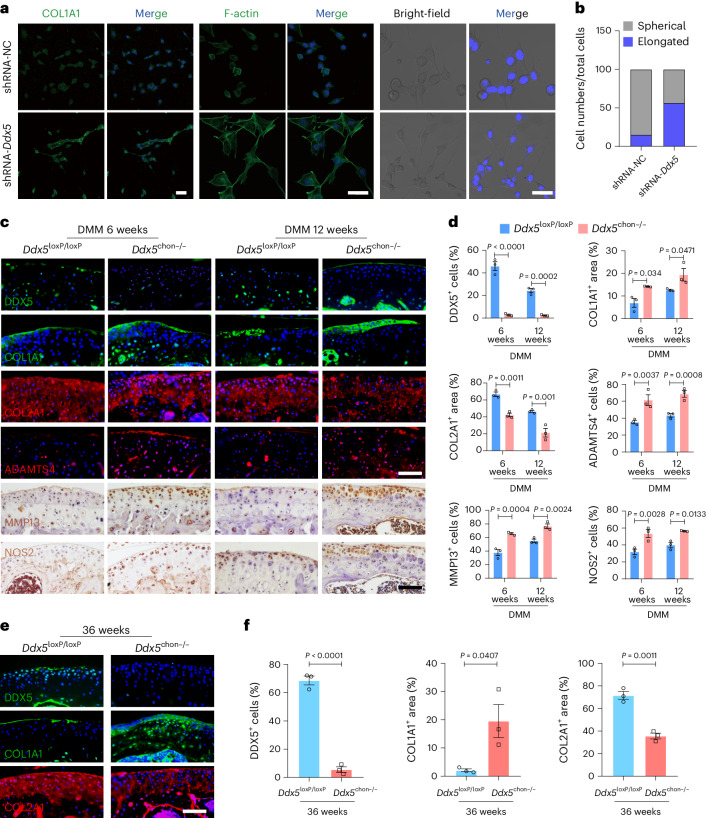
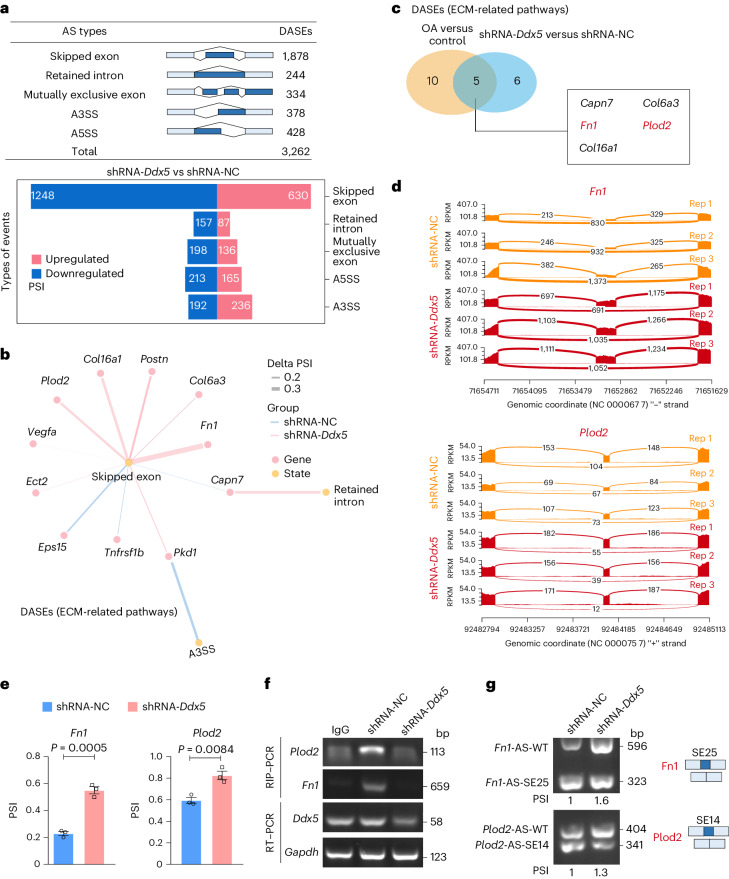
Hyaline cartilage fibrosis is typically considered an end-stage pathology of osteoarthritis (OA), which results in changes to the extracellular matrix. However, the mechanism behind this is largely unclear. Here, we found that the RNA helicase DDX5 was dramatically downregulated during the progression of OA. DDX5 deficiency increased fibrosis phenotype by upregulating COL1 expression and downregulating COL2 expression. In addition, loss of DDX5 aggravated cartilage degradation by inducing the production of cartilage-degrading enzymes. Chondrocyte-specific deletion of Ddx5 led to more severe cartilage lesions in the mouse OA model. Mechanistically, weakened DDX5 resulted in abundance of the Fn1-AS-WT and Plod2-AS-WT transcripts, which promoted expression of fibrosis-related genes (Col1, Acta2) and extracellular matrix degradation genes (Mmp13, Nos2 and so on), respectively. Additionally, loss of DDX5 prevented the unfolding Col2 promoter G-quadruplex, thereby reducing COL2 production. Together, our data suggest that strategies aimed at the upregulation of DDX5 hold significant potential for the treatment of cartilage fibrosis and degradation in OA.


Conflict of interest statement

The authors declare no competing interests.

Figures

Fig. 1
Fig. 1. Identification of DDX5 as a downregulated gene and protein in relation to OA progression in human patient samples and animal models.
a, Schematic of the experimental design. b, rMATS analysis of the number of DASEs between healthy and OA samples (n = 10 per group). Delta PSI > 4%, FDR < 0.05. c, Differential expression analysis in OA versus healthy (FDR < 0.05) d, Analysis of the correlation between DDX5 and COL1 and COL2 in COL2hi and COL1hi cells. Correlation coefficients are represented by numbers. e, Safranin O/Fast Green (SO&FG) and Masson staining, and immunofluorescence (IF) detection, of COL1A1 and DDX5 in OA cartilage (left). Quantitation of COL1A1 and DDX5 (n = 6 biologically independent samples). f, IF of DDX5 and SO&FG staining 12 week after mouse surgery for destabilization of the medial meniscus (DMM). Quantification of the Osteoarthritis Research Society International (OARSI) score and DDX5 protein (n = 6 mice per group). e,f, Scale bar, 100 µm. All data are presented as the mean ± s.e.m. A Student’s t-test (paired in e, unpaired in f) were conducted. Source data
Fig. 2
Fig. 2. Regulation of DDX5 expression alters the progression of posttraumatic OA.
a, Schematic of the experimental design. At 11 weeks of age, Ddx5loxP/loxP and Ddx5chon−/− male mice received five daily intraperitoneal injections of tamoxifen. One week after tamoxifen injection, mice underwent DMM surgery and were killed at 6 and 12 weeks postoperatively. SO&FG staining of the knee joint sections from Ddx5loxP/loxP and Ddx5chon−/− mice is shown. b, Corresponding OARSI and synovitis scores using histological sections (n = 8 mice per group). c, SO&FG staining of knee joint sections from Ddx5loxP/loxP and Ddx5chon−/− mice at 18 and 36 weeks. d, Quantification of the SO&FG staining area (red) and synovitis score using histological sections (n = 3 in 36-week-old Ddx5loxP/loxP mice, n = 4 mice in the other groups). e, Representative joint sections from mice with DMM injected intra-articularly with AAV2-NC or AAV2-Ddx5, stained with SO&FG. f, OARSI and synovitis scores (n = 6 mice per group). a,c,e, Scale bars, 100 µm. All data are expressed as the mean ± s.e.m. b,d,f, A two-way analysis of variance (ANOVA) with Šidák’s correction was conducted. Source data
Fig. 3
Fig. 3. Ddx5 knockdown results in the upregulation of inflammation-related and fibrosis-related pathways.
a, Schematic of the experimental design. b, Bi-omics joint analysis was performed in ATDC5 cells stimulated with IL-1β combined with TNF-α. The dotted line represents the FDR (FDR < 0.05). c, Gene expression levels (shRNA-Ddx5 versus shRNA-NC) from the RNA-seq analysis of ATDC5 cells (5 ng ml−1 IL-1β + 25 ng ml−1 TNF-α, 6 h). A two-way ANOVA with Šidák’s correction was conducted. The results are expressed as the mean ± s.e.m. FPKM, fragments per kilobase of transcript per million mapped reads. d, A KEGG term enrichment analysis was performed on the data (shRNA-Ddx5 versus shRNA-NC, RNA-seq) in ATDC5 cells (5 ng ml−1 IL-1β + 25 ng ml−1 TNF-α, 6 h). e, KEGG enrichment pathway analysis of the scRNA-seq dataset (GSE104782) of patients with OA. GSVA, gene set variation analysis. f, GSEA analysis was performed on differentially expressed proteins determined using quantitative proteomics (shRNA-Ddx5 versus shRNA-NC) in ATDC5 cells (5 ng ml−1 IL-1β + 25 ng ml−1 TNF-α, 24 h). bf, n = 3 biologically independent experiments. Source data
Fig. 4
Fig. 4. DDX5 reduces the fibrocartilage phenotype and inhibits cartilage degradation.
a, Left, Representative IF images of COL1A1 expression in ATDC5 cells (shRNA-Ddx5 versus shRNA-NC). Middle, F-actin was labeled using fluorescently conjugated phalloidin. ATDC5 cells were cultured in confocal dishes. Right, Nuclei were counterstained with Hoechst dye (blue); optical transmission (bright-field) images show cell morphology. b, Ratio of spherical and elongated cells to total cells. c, Representative images of DDX5, COL1A1, COL2A1, MMP13 and NOS2 expression in knee sections of Ddx5loxP/loxP and Ddx5chon−/− mice after DMM. d, Percentage of COL1A1+ and COL2A1+ areas, and number of cells stained for DDX5, MMP13 and NOS2 (n = 3 mice per group). e, Expression of DDX5, COL1A1 and COL2A1 in the knee sections of Ddx5loxP/loxP and Ddx5chon−/− mice at 36 weeks of age. f, Number of cells stained for COL1A1, COL2A1 and DDX5 in slices (n = 3 mice per group). a,c,e, Scale bars, 100 μm. All data are presented as the mean ± s.e.m. A two-way ANOVA with Šidák’s correction (d) and an unpaired Student’s t-test (f) were conducted. Source data
Fig. 5
Fig. 5. DDX5 is required to splice key genes in OA.
a, Summary of the differential splicing analysis performed between shRNA-NC and shRNA-Ddx5 ATDC5 cells (delta PSI > 10% and FDR < 0.05). The numbers of DASEs in each category on Ddx5 deletion are indicated. b, DDX5-regulated DASEs related to ECM pathways in ATDC5 cells. c, Venn diagram indicating common ECM-related splicing genes between DDX5-regulated DASEs and human OA-associated DASEs. d, Sashimi plots showing an alternative exon skipping event in the Fn1 and Plod2 genes in shRNA-NC (yellow) and shRNA-Ddx5 (red) ATDC5 cells. RPKM, reads per milobase per million mapped reads. e, The inclusion levels of the Fn1 and Plod2 genes were analyzed in ATDC5 cells using the rMATS software (shRNA-NC and shRNA-Ddx5) (n = 3 independent experiments). Data are presented as the mean ± s.e.m. An unpaired Student’s t-test was conducted. f, Enrichment of Fn1 and Plod2 by DDX5 was detected using a RIP–PCR assay. g, Splicing of alternative exons in ATDC5 cells (shRNA-NC and shRNA-Ddx5) was analyzed using PCR with reverse transcription (RT–PCR). Quantification is shown as the fold change of PSI relative to the control sample. ag, ATDC5 cells were treated with combined IL-1β and TNF-α for 6 h. Source data
Fig. 6
Fig. 6. Knockdown of Fn1-AS-WT and Plod2-AS-WT inhibits transcription of fibrosis-related and ECM degradation genes and reverses the phenotype that aggravates OA, caused by DXX5 deficiency.
a, qPCR analysis of the indicated genes in ATDC5 cells transfected with two small interfering RNAs (siRNAs) alone or in combination for 24 h (n = 3 per group repetition). b, Upper, Schematic illustrating the experimental design. Bottom left, Representative SO&FG and IF staining of eGFP, DDX5, COL1A1 and MMP13 in sham and DMM joint sections from mice injected intra-articularly with AAV2-NC or AAV2-shRNA-(Fn1 + Plod2)-AS-WT. Scale bar, 100 µm. c,d, Bottom right, OARSI (c) and synovitis (d) scores (n = 6 mice per group). All data are presented as the mean ± s.e.m. In a,c,d, a one-way ANOVA with Tukey’s multiple comparisons test was conducted. Source data
Fig. 7
Fig. 7. Determination of the position 689 folding topology of the Col2 promoter.
a, Residue number and one-dimensional 1H NMR spectrum of position 689. The imino proton peaks of the G4 folded according to position 689 are denoted by the downward arrowheads. b, H8/6-H1′ sequential connectivity in the NOESY spectrum (250 ms mixing time, 100% D2O) at 298 K. Intra-residue NOEs are labeled with residue numbers. Weak or missing sequential connections are labeled with blue rectangles. c, The HMBC spectrum shows the through-bond correlations between imino H1 and base H8 protons from the same guanine residue via 13C5 at natural abundance. d, The NOESY spectrum (250 ms mixing time, 10% D2O and 90% H2O) reveals inter-residue H1–H8 cross-peaks for the identification of the arrangement of the G-tetrads. The guanine H1–H8 cross-peaks are labeled with the residue numbers of the H1 and H8 protons in the first and second positions, respectively. The remaining strong cross-peaks are identified as: α, G4H1-T13H6; β, G9H1-C15H22; χ, G9H1-C15H21; δ, G9H1-G9H22; and ε, G10H1-T13H6. e, Stacked plot of the two-dimensional NOESY spectrum (50 ms mixing time, 100% D2O) of position 689. f, Schematic folding topologies of position 689. The hydrogen bond directionality from donor (arrow tail) to acceptor (arrow head) within the same G-tetrad is shown in the same row by the arrows. W, M and N represent wide, medium and narrow groove widths, respectively. g, CD spectra of G4 folded according to position 689 in 100 mM Li+ (blue) or K+ (red). Source data
Fig. 8
Fig. 8. DDX5 resolves G4 in the Col2 promoter and TMPyP4 unfolds G4 in the Col2 promoter and enhances COL2 expression.
a, ChIP was performed with an anti-DDX5 antibody in shRNA-NC and shRNA-Ddx5 ATDC5 cells. qPCR analysis of the promoter region (515–759 bp) of the Col2 gene (1,470–1,590 bp region as the negative control, n = 3 per group repetition) is shown. b, Representative IF staining of DDX5 and G4 in shRNA-NC and shRNA-Ddx5 ATDC5 cells. The mean fluorescence intensity (intensity per area) of each cell was calculated using Image J (n = 5 cells). c, NMR tracing of DDX5 unfolding of the Col2 promoter G4 at position 689. d, Expanded imino proton regions of one-dimensional 1H NMR spectra were recorded for prefolded G4 position 689 titrated with 0–1.75-equivalent TMPyP4. e, Variation of peak intensity of G4 position 689 with 0–1.75-equivalent TMPyP4 titrations. f, qPCR analysis of Col2a1 and Myc in primary mouse chondrocytes treated with TMPyP4 (5 μM, 24 h, n = 3 repetition). g, Immunoblot analysis of COL2 in primary mouse chondrocytes (at the indicated doses of TMPyP4, 24 h). Image J was used for the density measurements (n = 3 biologically independent experiments). All data are presented as the mean ± s.e.m. b, Scale bar, 5 μm. A two-way ANOVA with Šidák’s correction (b), a Student’s t-test (a,f) and a one-way ANOVA with Dunnett’s multiple comparisons test (g) were conducted. Source data
Extended Data Fig. 1
Extended Data Fig. 1. The most significant differential alternative splicing events in OA.
The most significant differential alternative splicing events between normal and osteoarthritis (OA) samples (RNAseq datasets GSE114007, n = 10 /group) were analyzed using rMATS. The screening cut off delta PSI > 20% and FDR < 0.0001.The schematic diagram was shown in Panel a-I of Fig. 1.
Extended Data Fig. 2
Extended Data Fig. 2. The differential alternative splicing events of ECM-related pathways in OA.
The DASEs between normal and OA samples (GSE114007, n = 10 /group) were analyzed using rMATS. The screening cut off delta PSI > 4% and FDR < 0.05. The schematic diagram was shown in Panel a-I of Fig. 1.
Extended Data Fig. 3
Extended Data Fig. 3. The expression levels of the representative candidate marker genes and DDX5 between normal and OA samples.
The schematic diagram for this panel was shown in Panel a-I of Fig. 1 (GSE114007, n = 10 samples/group). The significant differences were tested in related genes through ‘wilcox test’. The box plots was defined as follows: minima (Q1 - 1.5×IQR), maxima (Q3 + 1.5×IQR), centre (Q2), bounds of box (Q1 - Q3) and whiskers (Min-Max) and percentile (Min, 0%; Q1, 25% percentile; Q2, 50% percentile; Q3, 75% percentile, Max, 100%).
Extended Data Fig. 4
Extended Data Fig. 4. Identification of chondrocyte populations and gene signatures during human OA progression.
(a) Single-cell count matrices were obtained from the GEO database (GSE104782). The UMAP plot of all cells were colored by their cell type identity. The cell types classified are as follows: PreHTC (prehypertrophic chondrocyte), EC (effector chondrocyte), HTC (hypertrophic chondrocyte), ZC (ZNF585B positive chondrocyte), RegC (regulatory chondrocyte), HomC (homeostatic chondrocyte), FC (fibrocartilage chondrocyte), ProC (proliferative chondrocyte). (b) The bubble chart displays some characteristic genes in different clusters. (c) The dot plot represents the differential genes expression (cell cluster in each group vs all other cell clusters).
Extended Data Fig. 5
Extended Data Fig. 5. The expression of related genes in COL1high cells and COL2high cells.
The significant differences were tested in related genes through ‘wilcox test’ (GSE104782, n = 10 samples/group). The box plots was defined as follows: minima (Q1 - 1.5×IQR), maxima (Q3 + 1.5×IQR), centre (Q2), bounds of box (Q1 - Q3) and whiskers (Min-Max) and percentile (Min, 0%; Q1, 25% percentile; Q2, 50% percentile; Q3, 75% percentile, Max, 100%).
Extended Data Fig. 6
Extended Data Fig. 6. The expression level of DDX5 in damaged areas and uninjured areas of cartilage from OA patients.
(a) QPCR was used to detect the mRNA level of DDX5 in damaged areas (DA) and uninjured areas (UA) of cartilage from OA patients (n = 6 samples). The data are presented as the mean ± SEM. Student’s t-test (paired) was conducted. (b) The mRNA expression of DDX5 in UA and DA of human OA cartilage was detected by RT-PCR analysis (n = 4 samples). (c) Western bolt analysis was performed to detect the expression of DDX5, COL1A1 and MMP3 in the DA and UA of cartilage from OA patients (n = 4 samples). Source data
Extended Data Fig. 7
Extended Data Fig. 7. The expression level of DDX5 in aged mice and under cytokine stimulation conditions.
Related to Fig. 1. (a) Representative images of DDX5 immunostaining in 2-month-old and 24-month-old mice (left panel). Scale bars, 100 μm. Quantitative of DDX5 (right panel, n = 6 mice/group). (b) QPCR analysis of Sox9, Col2a1, Mmp3 and Ddx5 mRNA levels in primary mouse chondrocytes stimulated with 5 ng/ml IL-1β and/or 25 ng/ml TNF-α for 12 h. (c) Western bolt analysis of DDX5 in primary mouse chondrocytes stimulated with 5 ng/ml IL-1β and/or 25 ng/ml TNF-α for 48 h (n = 4 independent experiments). COL2A1, as a positive control. All data are presented as the mean ± SEM. Unpaired Student’s t-test (a), two-way ANOVA with Tukey’s multiple comparisons test (b) and Friedman test (c) were conducted. Source data
Extended Data Fig. 8
Extended Data Fig. 8. Genetic knockdown of Ddx5 delays early development in mice.
(a)The deletion of Ddx5 affected early development in mice, resulting in impaired skeletal development, including shortened limbs and tails, as well as abnormal ribs. Mating strategies were employed in mice. (b) Genotyping was detected using mice tail PCR. (c) Staining of mouse skeletons showed that Ddx5 deletion could result in impaired skeletal development, including short limbs and tails, and abnormal ribs (indicated by yellow arrows). Scale bars, 0.5 cm. (d, e) In tissue sections were examined after 2 weeks after tamoxifen injection, and the weight (d) and length of femurs, tibias and tails (e) were counted. Ddx5chon-/- mice, n = 4; Ddx5fl/fl mice, n = 3. All data are presented as the mean ± SEM. Unpaired Student’s t test (d, e) was conducted. Source data
Extended Data Fig. 9
Extended Data Fig. 9. Genetic knockdown of Ddx5 promotes chondrocytes apoptosis and inhibits chondrocytes proliferation in the early stages of mouse development.
(a) In tissue sections taken 2 weeks after tamoxifen injection, knee joint sections of Ddx5fl/fl and Ddx5chon-/- mice were detected by SO&FG staining. COLX expression was detected by IF. The SO&FG staining showed significant shortening of the growth plate in Ddx5chon-/- mice, affecting both hypertrophic and non-hypertrophic regions, and causing a slight loss of articular cartilage. (b) PCNA expression was detected by IHC. Cell apoptosis was detected by TRUNEL kit (Scale bars, 100 μm). DDX5 expression was detected by IF (Scale bars, 200 μm). The blue and yellow lines in the panel represented the hypertrophic and non-hypertrophic cartilage thickness at the growth plate, respectively. The white or black dotted lines frame the cartilage or growth plate area. Source data
Extended Data Fig. 10
Extended Data Fig. 10. The transfection efficiency of AAV2 virus in cartilage of mice.
The efficiency of AAV2 infection in articular chondrocytes was assessed by expressing enhanced green fluorescent protein (EGFP) using AAV2. After 6 weeks of DMM surgery in mice, the virus was injected into the joint cavity for 6 another 6 weeks. The expression of EGFP protein was detected using immunofluorescence. Scale bars, 200 μm. Source data

References

    1. Rim A, Ju JH. The role of fibrosis in osteoarthritis progression. Life. 2020;11:3. doi: 10.3390/life11010003. - DOI - PMC - PubMed
    1. Deroyer C, et al. CEMIP (KIAA1199) induces a fibrosis-like process in osteoarthritic chondrocytes. Cell Death Dis. 2019;10:103. doi: 10.1038/s41419-019-1377-8. - DOI - PMC - PubMed
    1. Miosge N, Hartmann M, Maelicke C, Herken R. Expression of collagen type I and type II in consecutive stages of human osteoarthritis. Histochem. Cell Biol. 2004;122:229–236. doi: 10.1007/s00418-004-0697-6. - DOI - PubMed
    1. Li J, et al. Articular fibrocartilage-targeted therapy by microtubule stabilization. Sci. Adv. 2022;8:eabn8420. doi: 10.1126/sciadv.abn8420. - DOI - PMC - PubMed
    1. Hu X, et al. Identification of cellular heterogeneity and immunogenicity of chondrocytes via single-cell RNA sequencing technique in human osteoarthritis. Front. Pharmacol. 2022;13:1004766. doi: 10.3389/fphar.2022.1004766. - DOI - PMC - PubMed