. 2024 Jun;30(6):1622-1635.
doi: 10.1038/s41591-024-02969-w. Epub 2024 May 17.

A prognostic neural epigenetic signature in high-grade glioma

Affiliations

A prognostic neural epigenetic signature in high-grade glioma

Richard Drexler et al. Nat Med. 2024 Jun.

Abstract

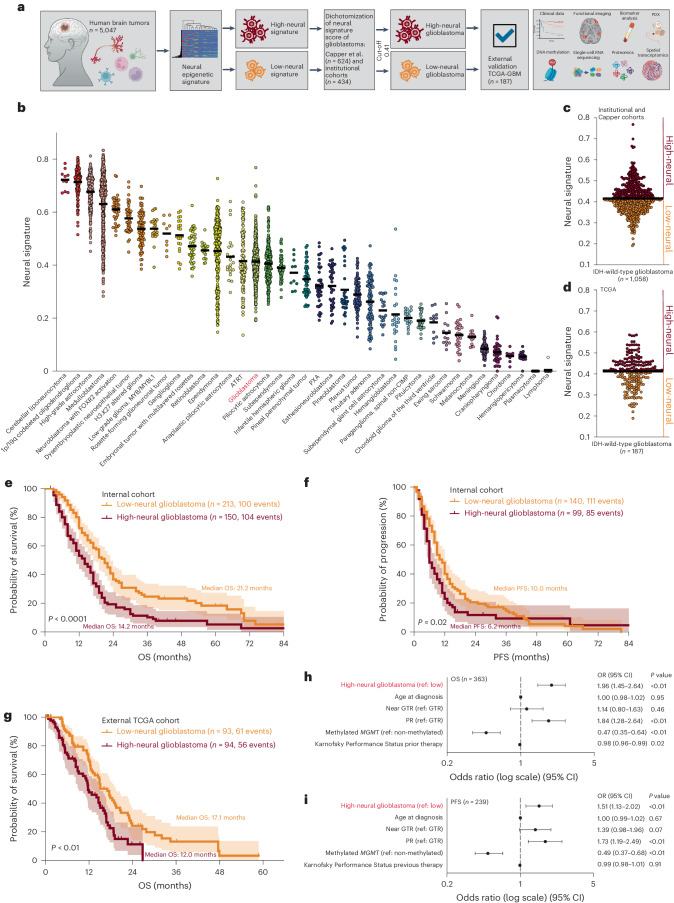
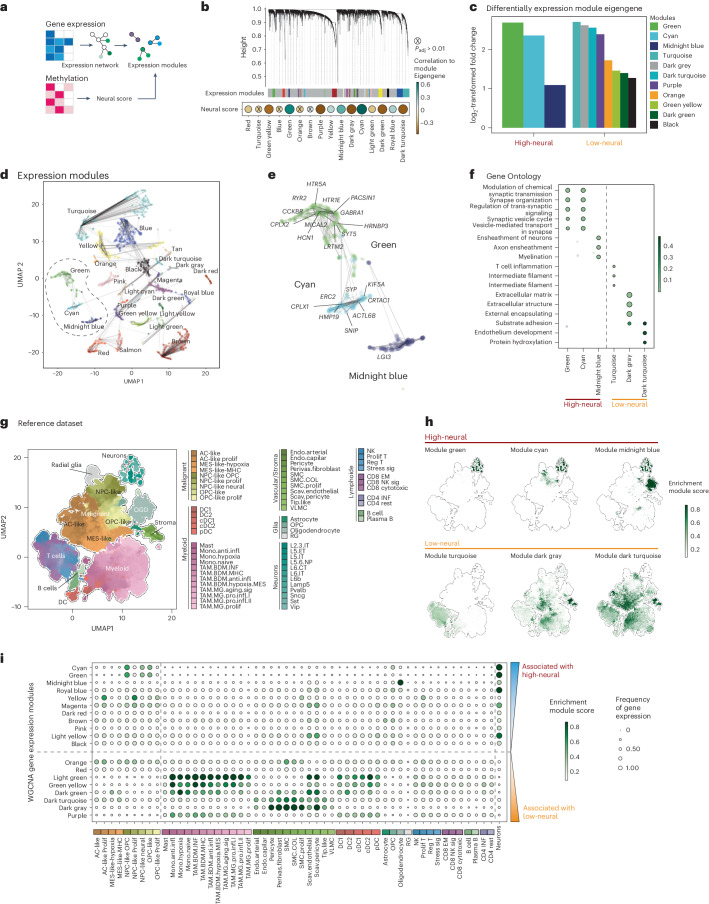
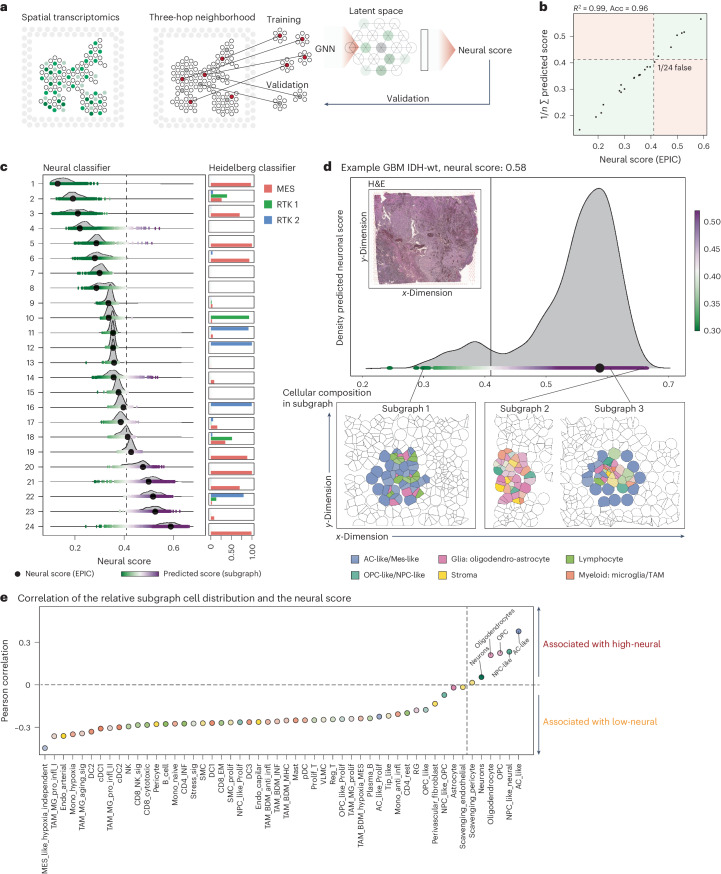
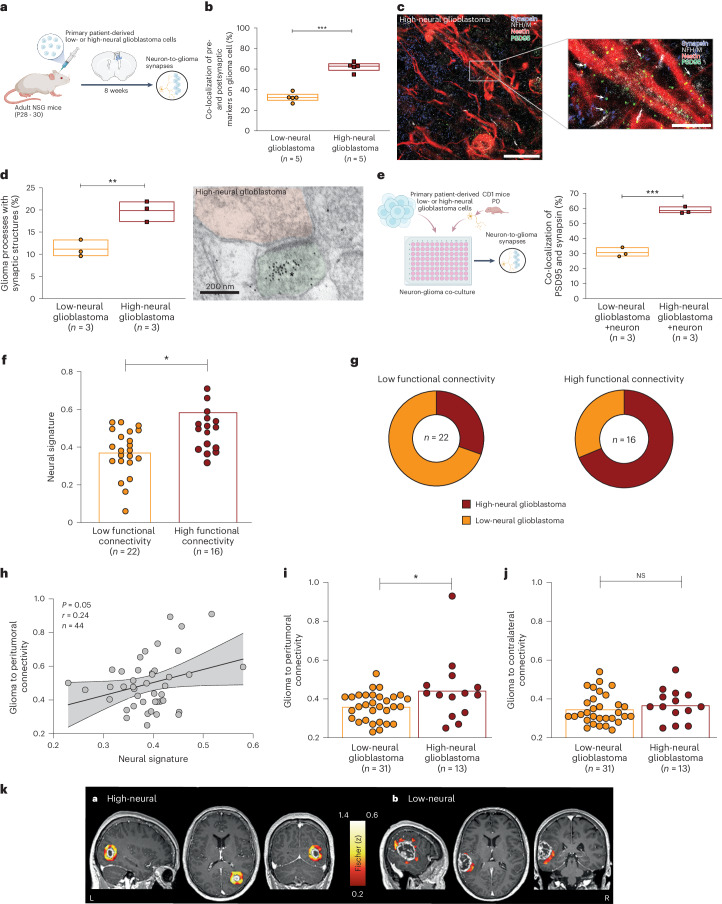
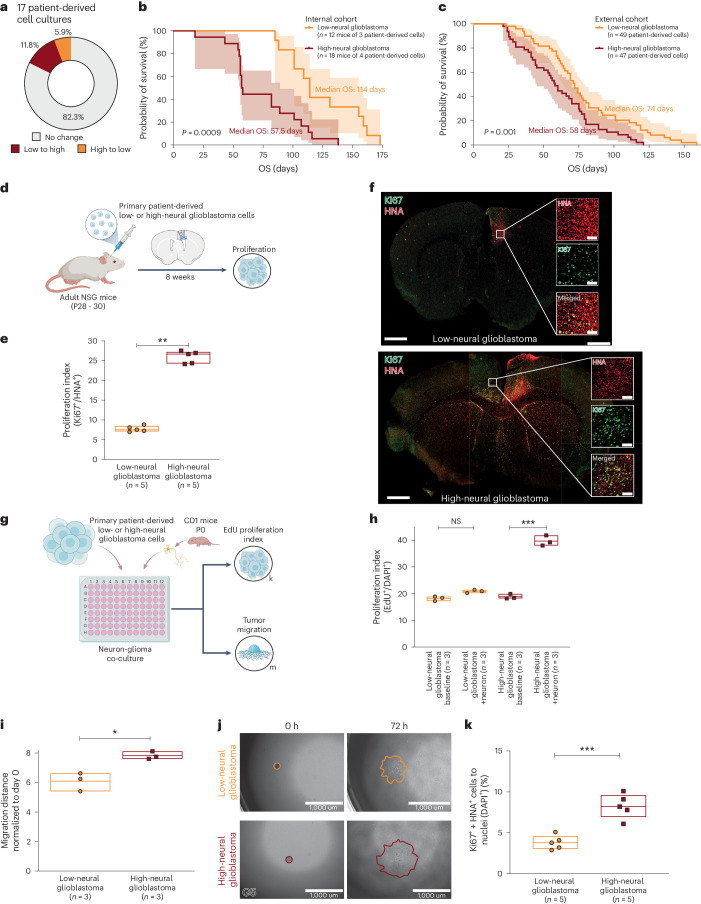
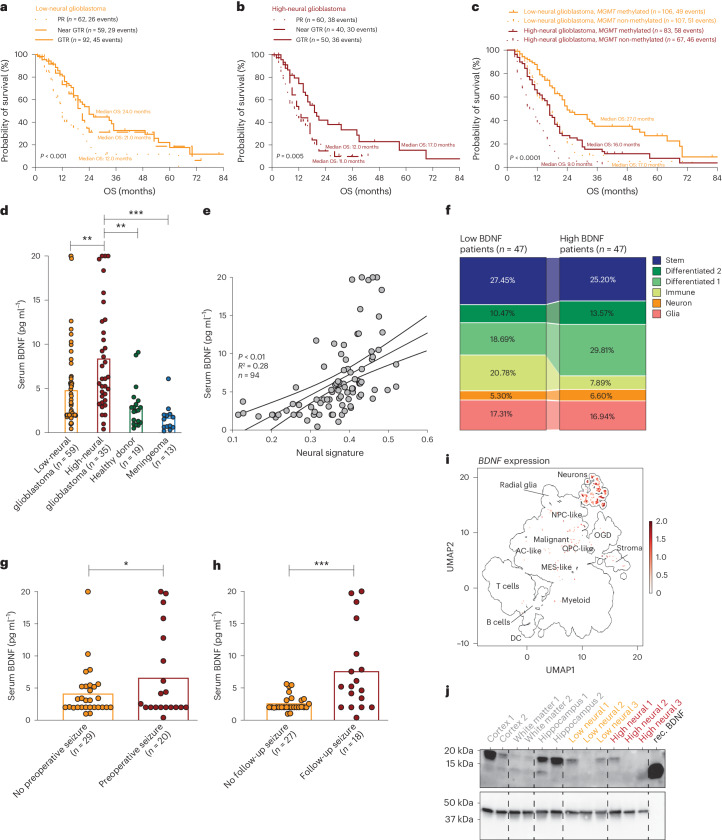
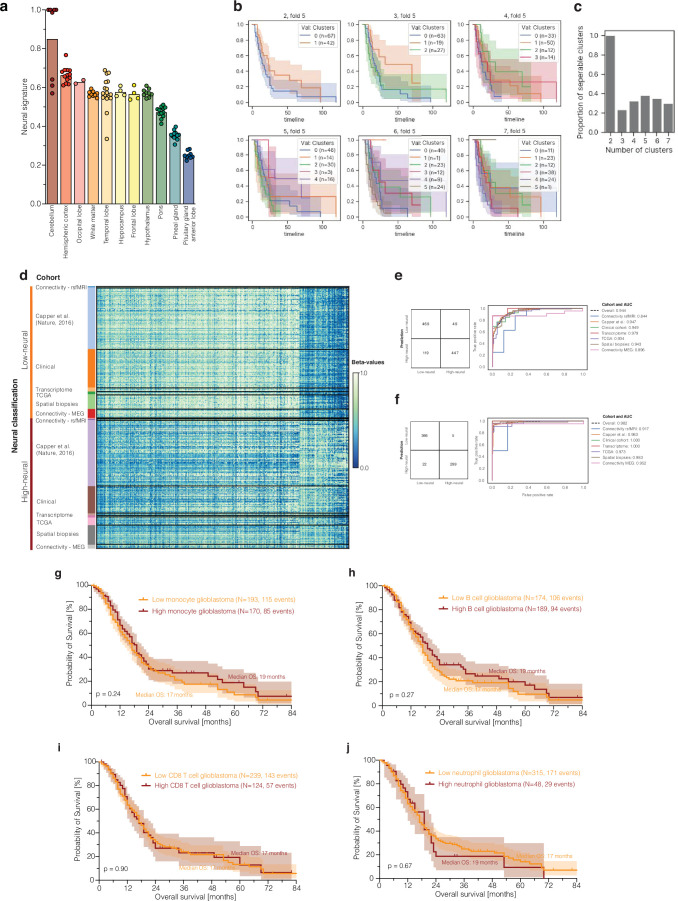
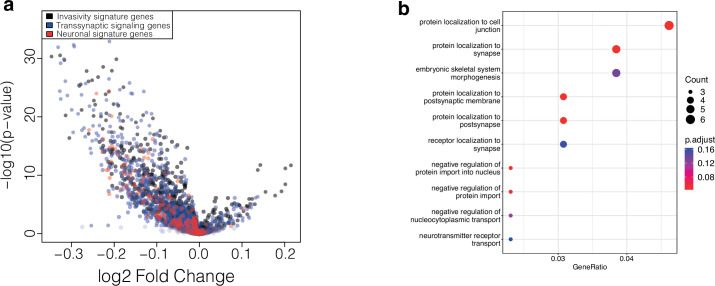
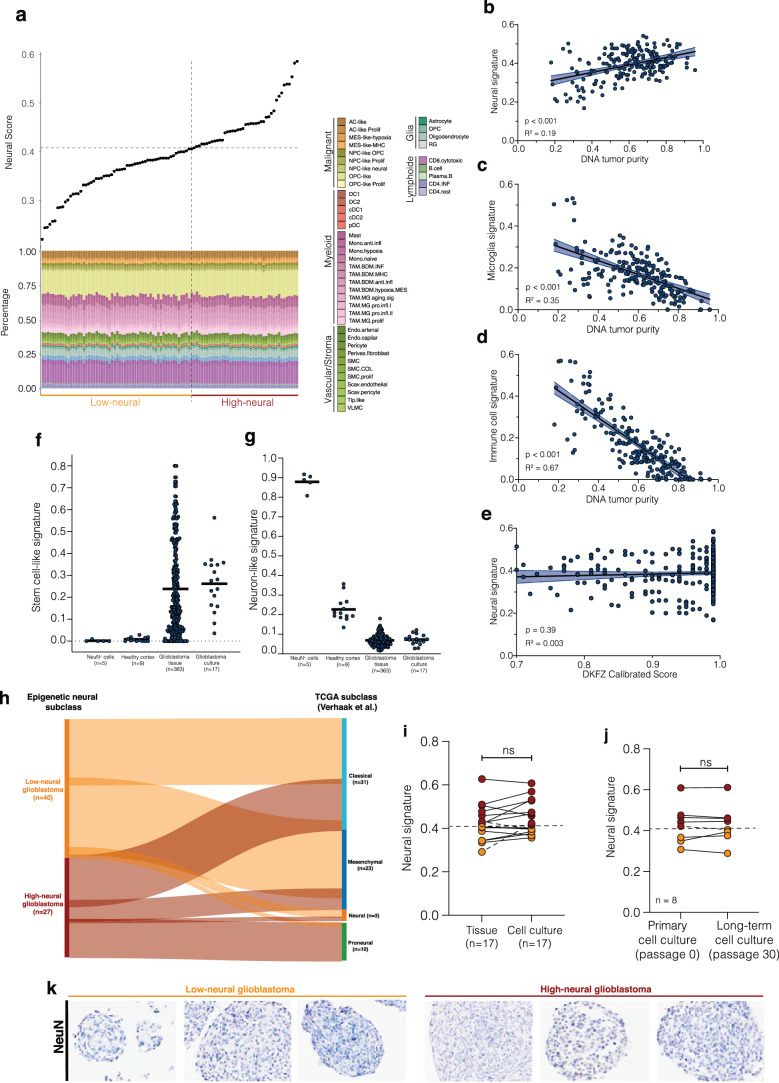
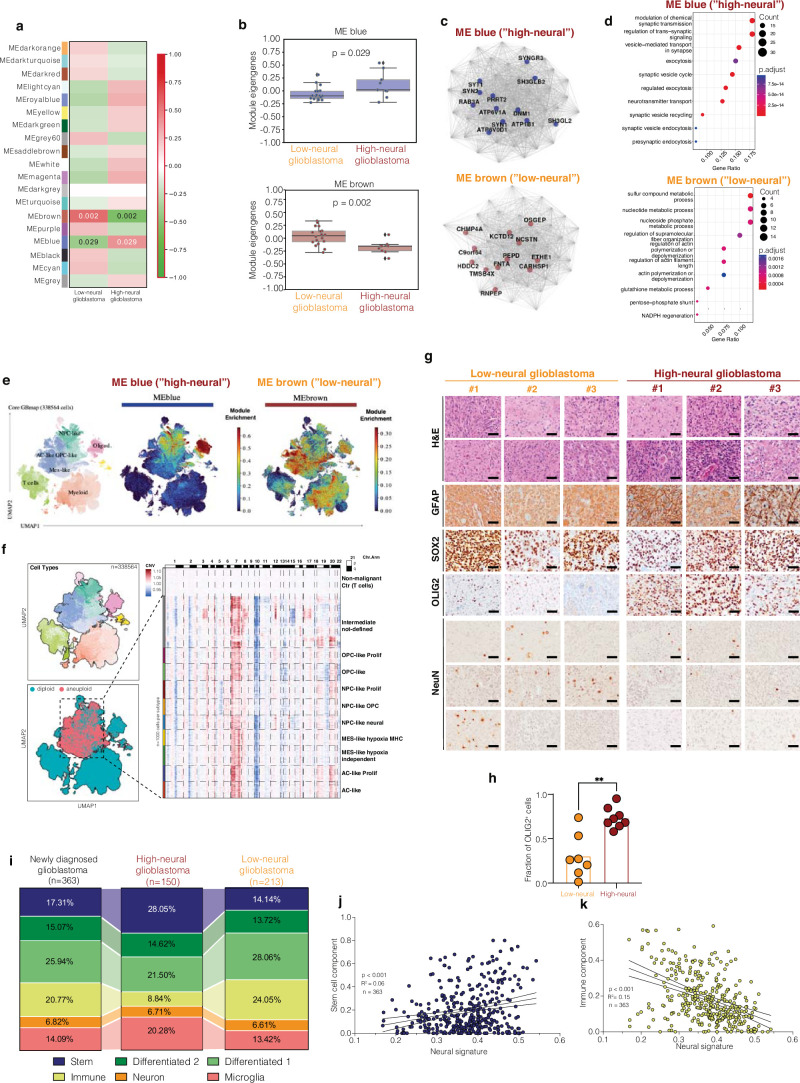
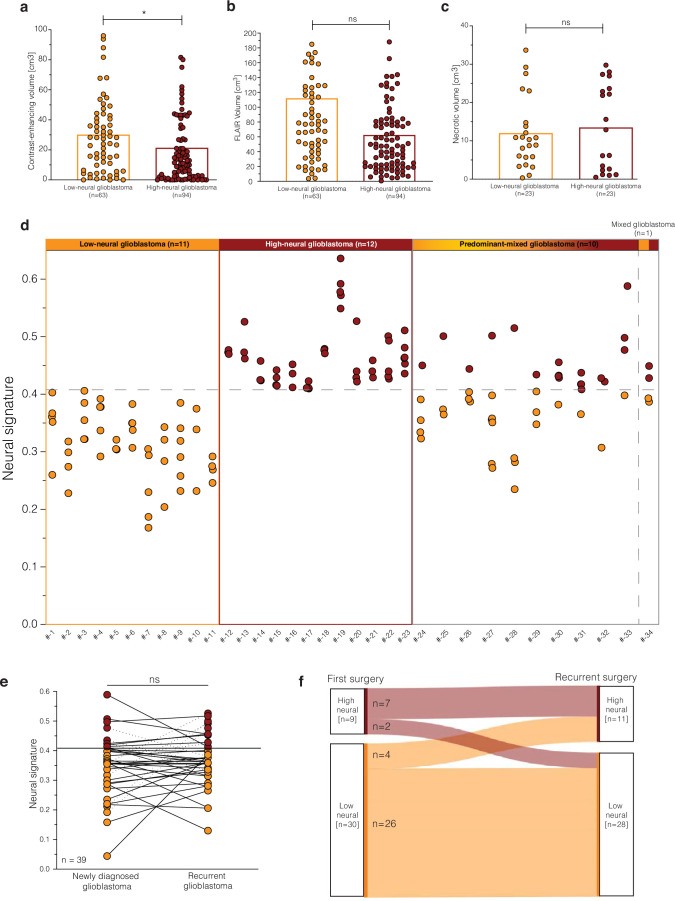
Neural-tumor interactions drive glioma growth as evidenced in preclinical models, but clinical validation is limited. We present an epigenetically defined neural signature of glioblastoma that independently predicts patients' survival. We use reference signatures of neural cells to deconvolve tumor DNA and classify samples into low- or high-neural tumors. High-neural glioblastomas exhibit hypomethylated CpG sites and upregulation of genes associated with synaptic integration. Single-cell transcriptomic analysis reveals a high abundance of malignant stemcell-like cells in high-neural glioblastoma, primarily of the neural lineage. These cells are further classified as neural-progenitor-cell-like, astrocyte-like and oligodendrocyte-progenitor-like, alongside oligodendrocytes and excitatory neurons. In line with these findings, high-neural glioblastoma cells engender neuron-to-glioma synapse formation in vitro and in vivo and show an unfavorable survival after xenografting. In patients, a high-neural signature is associated with decreased overall and progression-free survival. High-neural tumors also exhibit increased functional connectivity in magnetencephalography and resting-state magnet resonance imaging and can be detected via DNA analytes and brain-derived neurotrophic factor in patients' plasma. The prognostic importance of the neural signature was further validated in patients diagnosed with diffuse midline glioma. Our study presents an epigenetically defined malignant neural signature in high-grade gliomas that is prognostically relevant. High-neural gliomas likely require a maximized surgical resection approach for improved outcomes.


Conflict of interest statement

M.L.S. is an equity holder, scientific co-founder and advisory board member of Immunitas Therapeutics. M.M. holds equity in MapLight Therapeutics. The other authors declare no competing interests.

Figures

Fig. 1
Fig. 1. Epigenetic neural classification predicts outcome of patients with glioblastoma.
a, Schematic of the study workflow. In humans (n = 5,047) diagnosed with a CNS tumor we performed deconvolution using DNA methylation arrays (850k or 450k) for determining the neural signature. IDH-wild-type glioblastomas were stratified into subgroups with a low- or high-neural signature for further analyses. b, Epigenetic neural signature in all CNS tumor entities (n = 5,047). c, Dichotomization of the combined dataset from Capper et al. and three institutional cohorts (Hamburg, Berlin and Frankfurt, all Germany) into low- and high-neural glioblastomas. The black line indicates a median neural score of all included patients with glioblastoma (n = 1,058) and represents the cutoff (0.41) for stratification into low- and high-neural glioblastoma. d, External validation of the cutoff value using the TCGA-GBM dataset (n = 187). The black line indicates the median neural score. ei, Survival analysis of patients with low- and high-neural glioblastoma treated by radiochemotherapy after surgery. e, Overall survival (OS) of 363 patients with glioblastoma of the internal clinical cohort. log-rank test, P = 0.000005. Error bands represent 95% CI. f, PFS of 226 patients with glioblastoma of the internal clinical cohort. log-rank test, P = 0.0233. Error bands represent 95% CI. g, Overall survival of 187 patients with glioblastoma of the TCGA-GBM cohort. log-rank test, P = 0.0017. Error bands represent 95% CI. h,i, Forest plots illustrating multivariate analysis of patients with glioblastoma from the internal clinical cohort. Means are shown by closed circles and whiskers represent 95% CI. GTR, gross total resection; PR, partial resection; MGMT, O6-methylguanine-DNA-methyltransferase. Source data
Fig. 2
Fig. 2. Integrated epigenetic and transcriptomic analysis reveals synaptic functions and a malignant NPC/OPC-like character in high-neural glioblastoma.
a, Illustration of the workflow to integrate epigenetic and transcriptional data. Gene co-regulation networks are correlated to the epigenetic deconvolution signature. b, Hierarchical dendrogram of the gene expression modules derived from the weighted correlation network analysis. Dot-plot of the neural signature with gene expression models using Pearson correlation (bottom). Size and color indicate the correlation coefficient, nonsignificant correlation is marked. c, Bar-plot of the differential gene expression of module eigengenes (log2-transformed fold change) in low- and high-neural glioblastoma (cutoff 0.41). d, Dimensional reduction (UMAP) of the gene expression modules (named by colors). e, A detailed visualization of the modules: green, cyan and midnight blue (significantly associated with high-neural tumors). f, Gene Ontology analysis of gene expression modules in low- and high-neural tumors. g, UMAP dimensional reduction of the GBMap reference dataset. Colors indicate the different cell types. h, Module eigengene expression of low- and high-neural glioblastoma in the GBMap reference dataset. i, Gene expression enrichment of low- and high-neural-associated module eigengenes across glioblastoma cell states. AC, astrocytes; DC, dendritic cells; GBM, glioblastoma; NK, natural killer; OGD, oligodendrocytes; TAM, tumor-associated macrophages. Source data
Fig. 3
Fig. 3. Spatially resolved architecture of low- and high-neural glioblastoma.
a, Illustration of the workflow. Spatial transcriptomic data were used to identify neighborhoods defined as subgraphs. A GNN was trained to predict the neural score based on the spatial arrangements of transcripts. b, Scatter-plot of the mean sample predictions and the ground truth values. c, Illustration of the variance of neural score (predictions) compared to the threshold of 0.41. Bar plot indicates the Heidelberg classifier values of the glioblastoma subclasses (n = 24) (right). The dashed black line indicates the neural score threshold of 0.41. d, Example of a high-neural glioblastoma sample with a large blend of low- and high-neural predicted scores. The hematoxylin and eosin (H&E) image demonstrate the histology of the sample. Spatial neighborhoods derived from subgraphs with high- and low-neural scores are demonstrated (bottom). The single-cell maps are generated through single-cell deconvolution (Cell2Location) and CytoSpace spatial deconvolution. wt, wild type. e, Overview of the cell-type abundance correlated with the neural score.
Fig. 4
Fig. 4. High-neural glioblastomas are integrated into neuron-to-glioma networks.
a, Experimental workflow. b, Quantification of the colocalization of presynaptic and postsynaptic markers in low-neural (n = 22 regions, five mice) and high-neural (n = 21 regions, five mice) glioblastoma xenografts. P = 0.0008, two-tailed Student’s t-test. Data are mean ± s.e.m. c, Confocal image of infiltrated whiter matter of high-neural glioblastoma xenograft. White box and arrowheads highlight magnified view of synaptic puncta colocalization. Blue, synapsin-1 (presynaptic puncta); white, neurofilament heavy and medium (axon); red, nestin (glioma cell processes); green, PSD95 (postsynaptic puncta). Scale bars, 500 μm (top) and 250 μm (bottom). d, Electron microscopy of red fluorescent protein (RFP)-labeled glioblastoma cells. Quantification of neuron-to-glioma synaptic structures as a percentage of all visualized glioma cell processes (left) and image of neuron-to-glioma process in a high-neural glioblastoma xenograft (right). Asterix denotes immunogold particle labeling of RFP. Postsynaptic density in RFP+ tumor cell (green), synaptic cleft and vesicles in presynaptic neuron (red) identify synapses. **P < 0.01, two-tailed Student’s t-test. Scale bar, 200 nm. Data are mean ± s.e.m. n = 3 biological replicates. e, Colocalization of PSD95 and synapsin-1 in low- and high-neural glioblastoma cells in co-cultures with neurons. P = 0.0007, not significant (NS), P > 0.05, two-tailed Student’s t-test, n = 3 biological replicates. Data are mean ± s.e.m. f, Neural signature categorized into low functional connectivity (LFC) and high functional connectivity (HFC) as defined by magnetoencephalography. P = 0.0327, two-tailed Student’s t-test. g, Overlap between samples classified to the functional connectivity by Krishna et al. and the epigenetic-based neural classification of our study. h, Correlation of neural signature with degree of peritumoral connectivity as defined by resting-state functional magnetic resonance imaging (rs-fMRI). Simple linear regression P = 0.05, error bands representing the 95% CI. i, Peritumoral functional connectivity (defined by rs-fMRI) in low- and high-neural glioblastoma. P = 0.0416, two-sided Mann–Whitney U-test. j, Functional connectivity to the contralateral hemisphere (defined by rs-fMRI) in low- and high-neural glioblastoma groups. NS, P > 0.05, two-sided Mann–Whitney U-test. k, Examples showing the region of interest (ROI)-to-voxel functional connectivity of the contrast-enhancing area to its peritumoral surrounding. Peritumoral connectivity of a high-neural glioblastoma (0.457) and mean functional connectivity to its peritumoral area of 0.837 (left). By contrast, a low-neural glioblastoma (0.347) is shown with mean functional connectivity to its peritumoral area of 0.294 (right).
Fig. 5
Fig. 5. Neural classification is conserved in cell culture and correlates with survival as well as proliferation.
a, Comparison of neural signature between patient’s tumor tissue and cell culture in 17 glioblastomas. b,c, Survival after xenografting of patient-derived low- and high-neural glioblastoma cells in our internal cohort (b) and two combined external cohorts (c). log-rank test, P = 0.0009 (b), P = 0.001 (c). Error bands represent 95% CI. d, Primary patient-derived low- and high-neural glioblastoma cell suspensions (n = 1 per group) were implanted into premotor cortex (M2) of adult NSG mice (n = 5 mice per group). Mice were perfused after 8 weeks of tumor growth and brains sectioned in the coronal plane for further immunofluorescence analyses. e, Proliferation index (measured by total number of HNA+ cells co-labeled with Ki67 divided by the total number of HNA+ tumor cells counted across all areas quantified) in low- and high-neural glioblastoma-bearing mice (n = 5 mice per group). P = 0.00819, two-tailed Student’s t-test. Data are mean ± s.e.m. f, Representative confocal images of proliferation index in low-neural (top) and high-neural glioblastoma (bottom) xenografts. Human nuclear antigen (HNA), red; Ki67, green. Scale bars, 1 μm (overview images) and 200 μm (magnified images). g, Experimental workflow. h, EdU proliferation index (measured by total number of DAPI+ cells co-labeled with EdU divided by the total number of DAPI+ tumor cells counted across all areas quantified) in low-neural (P = 0.418) and high-neural (P = 0.0000172) glioblastoma as monocultures and co-cultured with neurons. Two-tailed Student’s t-test, n = 3 biological replicates. Data are mean ± s.e.m. i,j, 3D migration assay analysis comparing distance of migration 72 h after seeding (i) and representative images at time 0 h (left) and 72 h (right) of low- and high-neural glioblastoma cells (j). P = 0.0115, two-tailed Student’s t-test, n = 3 biological replicates. Scale bars, 1 μm. Data are mean ± s.e.m. k, In vivo spread of tumor cells into corpus callosum in low- and high-neural glioblastoma. P < 0.0004, two-tailed Student’s t-test. Data are mean ± s.e.m. EdU, 5-ethynyl-2′-deoxyuridine; DAPI, 4,6-diamidino-2-phenylindole.
Fig. 6
Fig. 6. Neural classification predicts benefit of EOR and MGMT promoter methylation status and can be detected in serum of patients with glioblastoma.
a,b, Survival outcome categorized after EOR in patients with glioblastoma treated by radiochemotherapy with a low-neural (a) and high-neural (b) tumor. log-rank test, P = 0.0003 (a), P = 0.005 (b). Error bands represent 95% CI. c, Survival outcome categorized by MGMT promoter methylation status in patients with glioblastoma treated by radiochemotherapy with a low- and high-neural tumor. log-rank test, P = 2.719 × 10⁻¹¹. Error bands represent 95% CI. d,e, Immunoassay quantification of serum BDNF concentration of 94 patients with glioblastoma and healthy donors as well as patients with meningioma as control groups at the time of diagnosis. **P < 0.01, ***P < 0.001, two-tailed Student’s t-test; error bands represent 95% CI. f, Cell composition analysis in glioblastoma with low and high BDNF serum levels. g,h, Seizure outcome of patients with glioblastoma considering BDNF serum levels at the time of surgery (g) and during follow-up (h). *P < 0.05, ***P < 0.001, two-tailed Student’s t-test. i, Transcriptomic analysis of BDNF expression. j, Western blotting of BDNF in various healthy brain tissue samples and low- as well as high-neural glioblastoma. n = 3 biological replicates.
Extended Data Fig. 1
Extended Data Fig. 1. Implementation of the epigenetic neural signature and validation of low- and high-neural subclassification of glioblastoma samples.
a). Epigenetic neural signature in healthy brain tissues obtained from the Capper dataset. b, c). Analysis of different number of neural clusters that can predict differential survival outcome in the clinical cohort (n=363) by using 10-fold cross-validation with Kmeans. The figure displays Kaplan–Meier curves of the clusters in the validation set of the 5th fold. The survival curves demonstrate that the best results are obtained with two clusters (low- versus high-neural). Log rank test was used for the survival difference between the clusters. Error bands representing the 95% confidence interval. d). Validation of the cut off for the neural signature across multiple cohorts used in the manuscript. Beta-values for CpGs differentially methylated between the low-neural and high-neural groups. The selection was made using the clinical cohort (n=363). e). Using the clinical cohort as the training set, a logistic regression model was trained. The logistic regression model trained on the clinical cohort on the identified signature classifies across cohorts with overall AUC of 0.944 and > 0.84 in all cohorts. f). Same as in e.) but a threshold on the prediction score was set (0.9) to keep only high confidence predictions. The AUC of the classifier is > 0.91 in the external cohorts when using only high probability predictions. g, j). Survival analysis of patients with glioblastoma applying brain tumor-related cell signatures of the Moss signature. Log-rank test, g) P = 0.2415, h.) P = 0.2703, i) P = 0.9010, j) P = 0.6646. Error bands representing the 95% confidence interval. OS: overall survival.
Extended Data Fig. 2
Extended Data Fig. 2. Differentially methylated CpG sites of high- and low-neural glioblastomas.
a). Volcano plot showing differentially methylated CpG sites of genes of the invasivity signature, neuronal signature, and trans-synaptic signaling signature in high-neural glioblastoma. b). Gene set enrichment analysis of differentially methylated CpG sites in high-neural glioblastoma compared to low-neural glioblastoma samples.
Extended Data Fig. 3
Extended Data Fig. 3. Quality measurements and reliability of the epigenetic neural signature in glioblastoma samples.
a). Integrated analysis of the individual patients' neural scores and the corresponding cell proportions obtained from RNA sequencing deconvolution. b). Correlation between the neural signature and DNA tumor purity. Simple linear regression P = 0.000000000063765, error bands representing the 95% confidence interval. c). Correlation between the microglia signature and DNA tumor purity. Simple linear regression P = 0.00000000041872, error bands representing the 95% confidence interval. d). Correlation between the immune cell signature and DNA tumor purity. Simple linear regression P = 0.000000000019814, error bands representing the 95% confidence interval. e). Correlation between the DKFZ calibrated score for the diagnosis ‘IDH-wild-type glioblastoma’ and the neural signature. Simple linear regression P = 0.2803, error bands representing the 95% confidence interval. f, g). Single-cell deconvolution of DNA methylation profiles compare f). stem cell-like and g). neuron-like signatures in NeuN+ cells, healthy cortex, glioblastoma tissue samples, and glioblastoma cell cultures. h). Overlap between the epigenetic neural classification and TCGA subtypes after integrated RNA sequencing analysis. i). Comparison of neural signature between patient’s tumor tissue and cell culture in 17 glioblastomas. Two-sided t-test P = 0.2593. j). Stability of the epigenetic neural signature during long-term cell culturing. Data were obtained from a publicly available dataset (n =6, GSE181314) and in-house (n = 1). Two-sided t-test P = 0.8471. k). Demonstration of NeuN+ staining in glioblastoma neurospheres. n=15 biological replicates.
Extended Data Fig. 4
Extended Data Fig. 4. High-neural glioblastoma is linked with synapse formation and trans-synaptic signaling from proteomic profiling.
ae) Proteomic profiling of low- (n=19) and high-neural (n=9) glioblastoma. a). WGCNA analysis showed differentially abundant proteome modules between both neural subgroups. b). High-neural glioblastomas are clustered to module ‘blue’ (top figure), while low-neural glioblastomas have a higher abundance in module ‘brown’ (bottom figure). Data are mean ± s.e.m. Two-sided t-test P = 0.0.029 (top figure) and P = 0.002 (bottom figure). c, d). Network analysis revealed e). most expressed proteins and f). associated gene ontology terms for each neural subgroup (high-neural: top, low-neural: bottom). e). Integrating transcriptomic single-cell data showed an OPC-/NPC-like character in high-neural tumors (‘ME blue’). f). Transcriptomic single-cell copy number variation plot analysis of glioblastomas with a high-neural signature. g). Immunohistostaining of representative low- and high-neural glioblastoma samples. n=10 biological replicates. h). Analysis of OLIG2+ cells between low- and high-neural glioblastoma samples. **P < 0.01, two-tailed Student’s t-test. i). Comparison of abundance of cell states analyzed by reference-free deconvolution between newly diagnosed, high-neural, and low-neural glioblastomas. j). Stem cell-like state significantly correlated with an increase of the neural signature in glioblastoma samples. Simple linear regression, P = 0.000003024480. Error bands representing the 95% confidence interval. k). An anticorrelation was seen between the abundance of the immune compartment and the neural signature. Simple linear regression, P = 0.000000000005. Error bands representing the 95% confidence interval.
Extended Data Fig. 5
Extended Data Fig. 5. Copy number variations and next-generation sequencing of gene mutations between low- and high-neural glioblastoma samples.
a). Copy number variation plots for all samples stratified into low- and high-neural glioblastoma. b, c). Oncoprint illustrating clinical characteristics and gene mutational status of b). low-neural and c). high-neural glioblastoma samples of our internal cohort. Of note, rarely detectable IDH mutations did not include the pathogenic R132H mutation. d, e). Oncoprint illustrating clinical characteristics and gene mutational status of d). low-neural and e). high-neural glioblastoma samples of the TCGA dataset.
Extended Data Fig. 6
Extended Data Fig. 6. Radiographic parameters and spatiotemporal tumor sampling.
a – c). Association of neural glioblastoma group with volume of a). contrast enhancement, b). FLAIR, and c). tumor necrosis measured by preoperative magnetic resonance imaging. A) P = 0.0374, b) P = 0.1767, and c) P = 0.6373, two-tailed Student’s t-test. d). Analysis of intertumoral difference of neural signature within 34 newly diagnosed glioblastomas with spatial collection of 3 to 7 samples per tumor. 23 (67.6 %) of these tumors had a pure low- or high-neural signature in all individual biopsies with additional 10 (29.4 %) tumors being predominantly low or high. e). Neural signature in 39 patients with matched tumor tissue obtained from surgery at first diagnosis and recurrence. ns: P > 0.05, two-tailed Student’s t-test. f). Sankey plot illustrating a potential switch of the neural subgroup between first diagnosis and recurrence.
Extended Data Fig. 7
Extended Data Fig. 7. Drug sensitivity analysis of low- and high-neural glioblastoma cells.
a). Representative microscopic images for high- (left image) and low-neural (right image) glioblastoma cells. Green: Vimentin, yellow: cleaved caspase 3, TUBB3: red, DAPI: blue. Scale bars: 10μm. n=9 biological replicates. b). Drug sensitivity of low- and high-neural glioblastoma cells measured by cleaved caspase 3. *P < 0.05, Mann–Whitney test. c). Drug sensitivity of low- and high-neural glioblastoma cells measured by average cell area. *P < 0.05, Mann–Whitney test. d). Statistical difference of sensitivity to various drugs between low- and high-neural glioblastoma cells. Mann–Whitney test.
Extended Data Fig. 8
Extended Data Fig. 8. Clinical prognostic and circulating biomarkers of epigenetic neural glioblastomas.
a). Neural signature in DNA methylation subclasses of newly diagnosed IDH-wild-type glioblastoma. *P < 0.05, two-tailed Student’s t-test. b). Forest plot illustrating the multivariate analysis of low-neural patients with glioblastoma. Means are shown by closed circles and whiskers representing the 95% confidence interval. Cox proportional hazards regression model. c). Forest plot illustrating the multivariate analysis of high-neural patients with glioblastoma. Means are shown by closed circles and whiskers representing the 95% confidence interval. Cox proportional hazards regression model. d – e). Survival outcome categorized after RANO categories for extent of resection in patients with glioblastoma treated by radiochemotherapy with a low- and high-neural signature. Class 1: 0 cm3 CE + ≤5 cm3 nCE tumor, Class 2: ≤1 cm3 CE, Class 3A: ≤5 cm3 CE, Class 3B: ≥5 cm3. Log-rank test, d) P = 0.0002, and e) P = 0.0011. f.) Correlation of neural signature and number of extracellular vesicles in patient serum at time of diagnosis. Simple linear regression P = 0.01. Error bands representing the 95% confidence interval. g.) Comparison of neural signature in healthy individuals, patients with glioblastoma, and meningeoma patients between matched tumor tissue, extracellular vesicle-associated DNA in serum, and cell-free DNA in serum. *P < 0.05, two-tailed Student’s t-test. h.) Comparison of patients with no detectable (left panel) and detectable (right panel) extracellular vesicle levels in serum stratified to their epigenetic neural glioblastoma type. i.) Illustration of the neural signature in different types of sampling in patients with glioblastoma.
Extended Data Fig. 9
Extended Data Fig. 9. Relevance of neural classification in pediatric and adolescent patients diagnosed with H3K27-altered diffuse midline glioma (DMG).
a). Association of tumor location with neural signature. Two-tailed Student’s t-test. b). Volcano plot showing differentially methylated CpG sites of genes of the invasivity signature, neuronal signature, and trans-synaptic signaling signature. c). Cell state composition analysis in low- and high-neural DMG. d). Synaptic gene expression (PTPRS, ARHGEF2, GRIK2, DNM3, LRRTM2, GRIK5, NLGN4X, NRCAM, MAP2, INA, TMPRSS9) is significantly correlated with the stem cell-like state of DMG cells calculated by an overlap of single-cell DNA methylation and single-cell RNA sequencing (599 cells from 3 study participants) measurements. Simple linear regression. e – h). Kaplan–Meier survival analysis of 72 DMG patients under 18 years of age with a low- and high-neural DMG. Error bands representing the 95% confidence interval. Log-rank test, e) P = 0.0017, f) P = 0.0022, g) P = 0.0882, and h) P = 0.3236.

References

    1. Winkler F, et al. Cancer neuroscience: state of the field, emerging directions. Cell. 2023;186:1689–1707. - PMC - PubMed
    1. Taylor KR, Monje M. Neuron-oligodendroglial interactions in health and malignant disease. Nat. Rev. Neurosci. 2023;4:733–746. - PMC - PubMed
    1. Monje M. Synaptic communication in brain cancer. Cancer Res. 2020;80:2979–2982. - PMC - PubMed
    1. Venkatesh HS, et al. Electrical and synaptic integration of glioma into neural circuits. Nature. 2019;573:539–545. - PMC - PubMed
    1. Taylor KR, et al. Glioma synapses recruit mechanisms of adaptive plasticity. Nature. 2023;623:366–374. - PMC - PubMed

MeSH terms

Grants and funding