Clinical Trial
. 2024 Jun;30(6):1761-1770.
doi: 10.1038/s41591-024-02977-w. Epub 2024 May 17.

p75 neurotrophin receptor modulation in mild to moderate Alzheimer disease: a randomized, placebo-controlled phase 2a trial

Affiliations
Clinical Trial

p75 neurotrophin receptor modulation in mild to moderate Alzheimer disease: a randomized, placebo-controlled phase 2a trial

Hayley R C Shanks et al. Nat Med. 2024 Jun.

Abstract

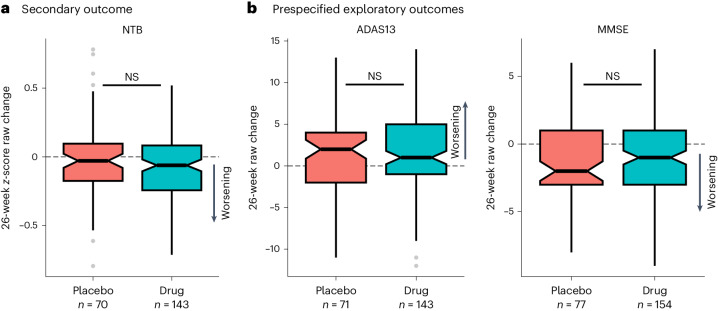
p75 neurotrophin receptor (p75NTR) signaling pathways substantially overlap with degenerative networks active in Alzheimer disease (AD). Modulation of p75NTR with the first-in-class small molecule LM11A-31 mitigates amyloid-induced and pathological tau-induced synaptic loss in preclinical models. Here we conducted a 26-week randomized, placebo-controlled, double-blinded phase 2a safety and exploratory endpoint trial of LM11A-31 in 242 participants with mild to moderate AD with three arms: placebo, 200 mg LM11A-31 and 400 mg LM11A-31, administered twice daily by oral capsules. This trial met its primary endpoint of safety and tolerability. Within the prespecified secondary and exploratory outcome domains (structural magnetic resonance imaging, fluorodeoxyglucose positron-emission tomography and cerebrospinal fluid biomarkers), significant drug-placebo differences were found, consistent with the hypothesis that LM11A-31 slows progression of pathophysiological features of AD; no significant effect of active treatment was observed on cognitive tests. Together, these results suggest that targeting p75NTR with LM11A-31 warrants further investigation in larger-scale clinical trials of longer duration. EU Clinical Trials registration: 2015-005263-16 ; ClinicalTrials.gov registration: NCT03069014 .


Conflict of interest statement

K.C. is a consultant to ADM Diagnostics. E.M.R. is a compensated scientific advisor to Alzheon, Aural Analytics, Cognition Therapeutics, Denali, Enigma, Retromer Therapeutics and Vaxxinity and a cofounder and advisor of ALZPath. K.B. has provided consultation to Abbvie, AC Immune, AriBio, ALZpath, BioArctic, Biogen, Eisai, Lilly, Ono Pharma, Prothena, Roche Diagnostics and Siemens Healthineers. K.B. has participated in a data safety monitoring board or advisory board for Julius Clinical and Novartis. K.B. has given lectures, produced educational materials and participated in educational programs for AC Immune, Biogen, Celdara Medical, Eisai and Roche Diagnostics. K.B. is a cofounder of and has stock in Brain Biomarker Solutions in Gothenburg AB (BBS), which is a part of the GU Ventures Incubator Program. J.L.C. has provided consultation to Acadia, Actinogen, Acumen, AlphaCognition, Aprinoia, Artery, Biogen, Biohaven, BioXcel, Bristol-Myers Squib, Cassava, Cerecin, Eisai, GAP Foundation, Janssen, Karuna, Lighthouse, Lilly, Lundbeck, EQT (formerly LSP), Merck, NervGen, New Amsterdam, Novo Nordisk, Oligomerix, Optoceutics, Ono, Otsuka, Oxford Brain Diagnostics, PharmatrophiX, Prothena, ReMYND, Roche, Sage Therapeutics, Scottish Brain Science, Signant Health, Simcere, sinaptica, Suven, TrueBinding, Vaxxinity and Wren pharmaceutical, assessment and investment companies. F.M.L. and S.M.M. are listed as inventors on patents related to LM11A-31 that are assigned to the University of North Carolina, University of California, San Francisco and the Department of Veterans Affairs. They are also entitled to royalties distributed by UC and the VA per their standard agreements. F.M.L. is a principal of and has financial interest in PharmatrophiX, a company focused on the development of small-molecule ligands for neurotrophin receptors, with licensing of several related patents. M.W. is the vice president for research and development of NeuroScios. The other authors declare no competing interests.

Figures

Fig. 1
Fig. 1. Participant flow diagram for the phase 2a LM11A-31 clinical trial.
Examples of major protocol violations included failure to meet inclusion or exclusion criteria (data changed or violation was not detected before dosing), use of prohibited medication that began during the treatment period (Methods), incomplete treatment (<80% compliance over the treatment period), final visit outside prespecified acceptable visit window (182 ± 7 days after baseline visit) or early withdrawal. PK population, pharmacokinetic study population. *Discontinued due to randomization failure.
Fig. 2
Fig. 2. Secondary and prespecified exploratory CSF biomarker endpoints.
a,b, Box plots show the annual percent change values of secondary (a) and prespecified exploratory (b) CSF biomarkers in the placebo group (salmon) and the drug group (teal). Black horizontal lines in the box plots represent the median of each distribution. Notches provide the 95% CIs of the median, which represent the reliability of within-group change. The lower and upper hinges of the box plot correspond to the first and third quartiles of the distribution and the whiskers (vertical lines) extend from the hinge to the largest or smallest value, no further than ±1.5 times the interquartile range from the hinge. Two-sided Wilcoxon rank sum tests were used to compare longitudinal changes in the placebo and LM11A-31 groups. Participant numbers across the groups vary due to the availability of test results for a given participant and variation in the outlier number (3–12 per variable across all trial participants). The number of participants included in each comparison is presented below each box plot. Given the exploratory nature of the trial, all P values are uncorrected. NS, not significant; Aβ42/40, ratio of Aβ42 to Aβ40.
Fig. 3
Fig. 3. Secondary and prespecified exploratory cognitive measures under placebo and LM11A-31.
a,b, Box plots showing the change in score between the first and last assessments on the NTB z-score (a), ADAS-Cog-13 (left) and MMSE (right) (b) in the pooled LM11A-31 (teal) and placebo (salmon) groups. Note that y axes are scaled differently in each panel. Horizontal lines on box plots represent the median of the distribution. Notches provide the 95% CIs of the median, which represent the reliability of within-group change. The lower and upper hinges of the box plot correspond to the first and third quartiles of the distribution and the whiskers (vertical lines) extend from the hinge to the largest or smallest value, no further than ±1.5 times the interquartile range from the hinge. Differences between the drug and placebo groups were not significant using a two-sided Wilcoxon rank sum test for any cognitive test (PNTB = 0.185; PADAS = 0.789; PMMSE = 0.492). Given the exploratory nature of the trial, all P values are uncorrected. ADAS13, ADAS-Cog-13.
Fig. 4
Fig. 4. Longitudinal changes in gray matter volume and glucose metabolism in AD-vulnerable brain regions.
a, Factorial mixed-effects analyses of covariance models examined the two-way interactions between treatment (drug or placebo) and time (before or after treatment). A one-sided t-contrast examining the hypothesis-consistent interaction (drug slowing progression over time relative to placebo) revealed that treatment with LM11A-31 slowed longitudinal degeneration (left panels) and glucose hypometabolism (right panels) in the drug group (sMRI, n = 127; PET, n = 121) compared to the placebo group (sMRI, n = 66; PET, n = 62). Voxels exhibiting this interaction effect are shown at an uncorrected P < 0.05 threshold (magenta) on a population-specific cortical surface. Left and right hemispheres are in the top and bottom rows, respectively. Brain areas exhibiting hypothesis-inconsistent interaction effects are displayed in Extended Data Fig. 7. b, The total number of voxels in the a priori AD vulnerability brain areas (total area of pie charts) exhibiting either a hypothesis-consistent (magenta) or a hypothesis-inconsistent (yellow) interaction in each imaging modality (sMRI, left panel; FDG PET, right panel) at increasingly liberal thresholds of uncorrected P < 0.01 and P < 0.05. Monte Carlo simulations determined that the ratios of voxels exhibiting hypothesis-consistent versus hypothesis-inconsistent effects were significantly higher than those observed on the basis of randomly simulated data for both sMRI and PET (P < 0.001 for each; two-sided).
Extended Data Fig. 1
Extended Data Fig. 1. Baseline correlations between biomarker and cognitive endpoints.
Correlation matrix showing relationships between cognitive and biomarker measures before treatment (baseline) across all trial participants. The number of participants with data for each variable ranged from 194 to 241 and includes participants regardless of treatment group. Outliers were defined for each variable as datapoints which were more than three median absolute deviations from the median. These values were excluded from correlations. Circles in the correlation matrix represent Spearman’s Rho and are scaled in size based on the significance of the Spearman correlation. All P values are uncorrected and statistics were performed two-sided. Aβ42/40, ratio of Aβ42 to Aβ40; ADAS, ADAS-Cog-13.
Extended Data Fig. 2
Extended Data Fig. 2. Longitudinal changes in CSF biomarkers across treatment arms.
Box plots showing the annual percent change of a) secondary and b) pre-specified exploratory CSF biomarkers in the placebo (salmon), 200 mg LM11A-31 (green) and 400 mg LM11A-31 (blue) groups. Horizontal lines on box plots represent the median of the distribution. Notches provide 95% confidence intervals of the median, which represent the reliability of within-group change. The lower and upper hinges of the boxplot correspond to the first and third quartiles of the distribution, and the whiskers (vertical lines) extend from the hinge to the largest or smallest value, no further than ±1.5 times the interquartile range from the hinge. Significant Kruskal-Wallis tests (PAChE = 0.029; PAβ40 = 0.015; PAβ42 = 0.032; PSNAP25 = 0.035; PNG = 0.024) were followed by post hoc Dunn’s tests to determine which groups differed significantly from each other. The number of participants included in each statistical test varied due to availability of test results for a given subject and variation in outlier number (3-12 per variable across all trial participants). Sample sizes are indicated below each boxplot. All statistics were performed two-sided and were not adjusted for multiple comparisons, given the exploratory nature of the study. Aβ42/40, ratio of Aβ42 to Aβ40.
Extended Data Fig. 3
Extended Data Fig. 3. 26-week changes in cognitive test scores by dose group.
Box plots showing the change in score between the first and last assessment on the a) NTB z-score, b) ADAS-Cog-13 (ADAS13), and c) MMSE in the placebo (salmon), 200 mg LM11A-31 (green) and 400 mg LM11A-31 (blue) groups. Note that y axes are scaled differently in each panel. Horizontal lines on box plots represent the median of the distribution. Notches provide 95% confidence intervals of the median. The lower and upper hinges of the boxplot correspond to the first and third quartiles of the distribution, and the whiskers (vertical lines) extend from the hinge to the largest or smallest value, no further than ±1.5 times the interquartile range from the hinge. Kruskal-Wallis tests did not detect a significant difference between the three groups for any cognitive test (PNTB = 0.346; PADAS = 0.964; PMMSE = 0.651). All statistics were performed two-sided and were not adjusted for multiple comparisons, given the exploratory nature of the study. ADAS, ADAS-Cog-13.
Extended Data Fig. 4
Extended Data Fig. 4. Longitudinal changes in neuroimaging data by dose group.
Longitudinal changes in grey matter volume (a) or [18F]-FDG PET SUVr (b) in the placebo (salmon), 200 mg LM11A-31 (green) and 400 mg LM11A-31 (blue) groups within AD-vulnerability region of interest masks (Extended Data Fig. 6). Note that y axes are scaled differently in each panel. Horizontal lines on box plots represent the median of the distribution. Notches provide 95% confidence intervals of the median. The lower and upper hinges of the boxplot correspond to the first and third quartiles of the distribution, and the whiskers (vertical lines) extend from the hinge to the largest or smallest value, no further than ±1.5 times the interquartile range from the hinge. Two-sided Kruskal-Wallis tests did not detect a significant difference between the three groups for MRI (P = 0.847) or PET (P = 0.649). The number of participants included in each statistical test varied due to availability of test results for a given subject and variation in outlier number. Given the exploratory nature of the study, P values were not corrected for multiple comparisons.
Extended Data Fig. 5
Extended Data Fig. 5. Longitudinal changes in cognitive data at 12-weeks.
Box plots show the raw change in cognitive test scores between study baseline and the 12-week visit in the placebo (salmon) and LM11A-31 (teal) groups. Black horizontal lines on the box plots represent the median of the distribution. Notches provide 95% confidence intervals of the median. The lower and upper hinges of the boxplot correspond to the first and third quartiles of the distribution, and the whiskers (vertical lines) extend from the hinge to the largest or smallest value, no further than ±1.5 times the interquartile range from the hinge. a) The between-group difference in longitudinal cognitive decline on the NTB was not significant (P = 0.156) according to a Wilcoxon rank sum test. b) Placebo and drug groups did not differ in their median change scores on the ADAS-Cog-13 (Wilcoxon rank sum P = 0.422). All statistics were performed two-sided and were not adjusted for multiple comparisons, given the exploratory nature of the study. ADAS13, ADAS-Cog-13.
Extended Data Fig. 6
Extended Data Fig. 6. Brain regions vulnerable to AD pathology in the ADNI cohort.
Vulnerable brain regions were defined using sMRI and [18F]-FDG PET data from an independent sample of participants from the ADNI cohort (n = 54) who met key trial inclusion criteria (see Methods). a) Longitudinal patterns of grey matter degeneration were assessed in ADNI over a mean interval of 1 ± 0.2 years. Voxels showing a significant (FWER corrected P < 0.05) longitudinal reduction in grey matter volume based on a paired-sample one-sided voxel-wise t test are shown in red. Voxels in red were used as an explicit mask for sMRI analyses of clinical trial data. b) Longitudinal reductions in glucose metabolism in the ADNI population over a mean interval of 2.39±   1.96 years. Voxels showing longitudinal reductions in [18F]-FDG PET SUVr based on a paired-sample one-sided voxel-wise t-test are shown in red (FWER corrected P< 0.05). Voxels shown in red were used as a mask for statistical comparisons of the clinical trial PET data. For both a) and b), the medial and lateral views shown on the left half of the figure correspond to the left hemisphere of the brain. FWER, family-wise error rate.
Extended Data Fig. 7
Extended Data Fig. 7. Hypothesis-inconsistent interactions in trial sMRI and [18F]-FDG PET Data.
Drug group-by-time interactions from voxel-wise factorial mixed ANCOVA models assessing where decline in gray matter volumes (a) and glucose metabolism (b) is greater in the drug group (sMRI n = 127; PET n = 121) compared to the placebo group (sMRI n = 66; PET n = 62). Voxels exhibiting this effect are shown in yellow (post hoc t contrast; one-sided). Given the exploratory nature of the trial, all P values are uncorrected. Hypothesis-consistent interactions (that is, where drug treatment slowed progression of pathology) in sMRI and PET data are shown in Fig. 4. For both a) and b), the medial and lateral views shown on the left half of the figure correspond to the left hemisphere of the brain.

References

    1. Knopman DS, et al. Alzheimer disease. Nat. Rev. Dis. Prim. 2021;7:33. - PMC - PubMed
    1. Long JM, Holtzman DM. Alzheimer disease: an update on pathobiology and treatment strategies. Cell. 2019;179:312–339. - PMC - PubMed
    1. Frisoni GB, et al. The probabilistic model of Alzheimer disease: the amyloid hypothesis revised. Nat. Rev. Neurosci. 2022;23:53–66. - PMC - PubMed
    1. Selkoe DJ. Alzheimer’s disease is a synaptic failure. Science. 2002;298:789–791. - PubMed
    1. Mummery CJ, et al. Tau-targeting antisense oligonucleotide MAPTRx in mild Alzheimer’s disease: a phase 1b, randomized, placebo-controlled trial. Nat. Med. 2023;29:1437–1447. - PMC - PubMed

Publication types

Associated data