. 2024 Jun;56(6):1121-1133.
doi: 10.1038/s41588-024-01747-1. Epub 2024 May 17.

Spatial genomic, biochemical and cellular mechanisms underlying meningioma heterogeneity and evolution

Affiliations

Spatial genomic, biochemical and cellular mechanisms underlying meningioma heterogeneity and evolution

Calixto-Hope G Lucas et al. Nat Genet. 2024 Jun.

Abstract

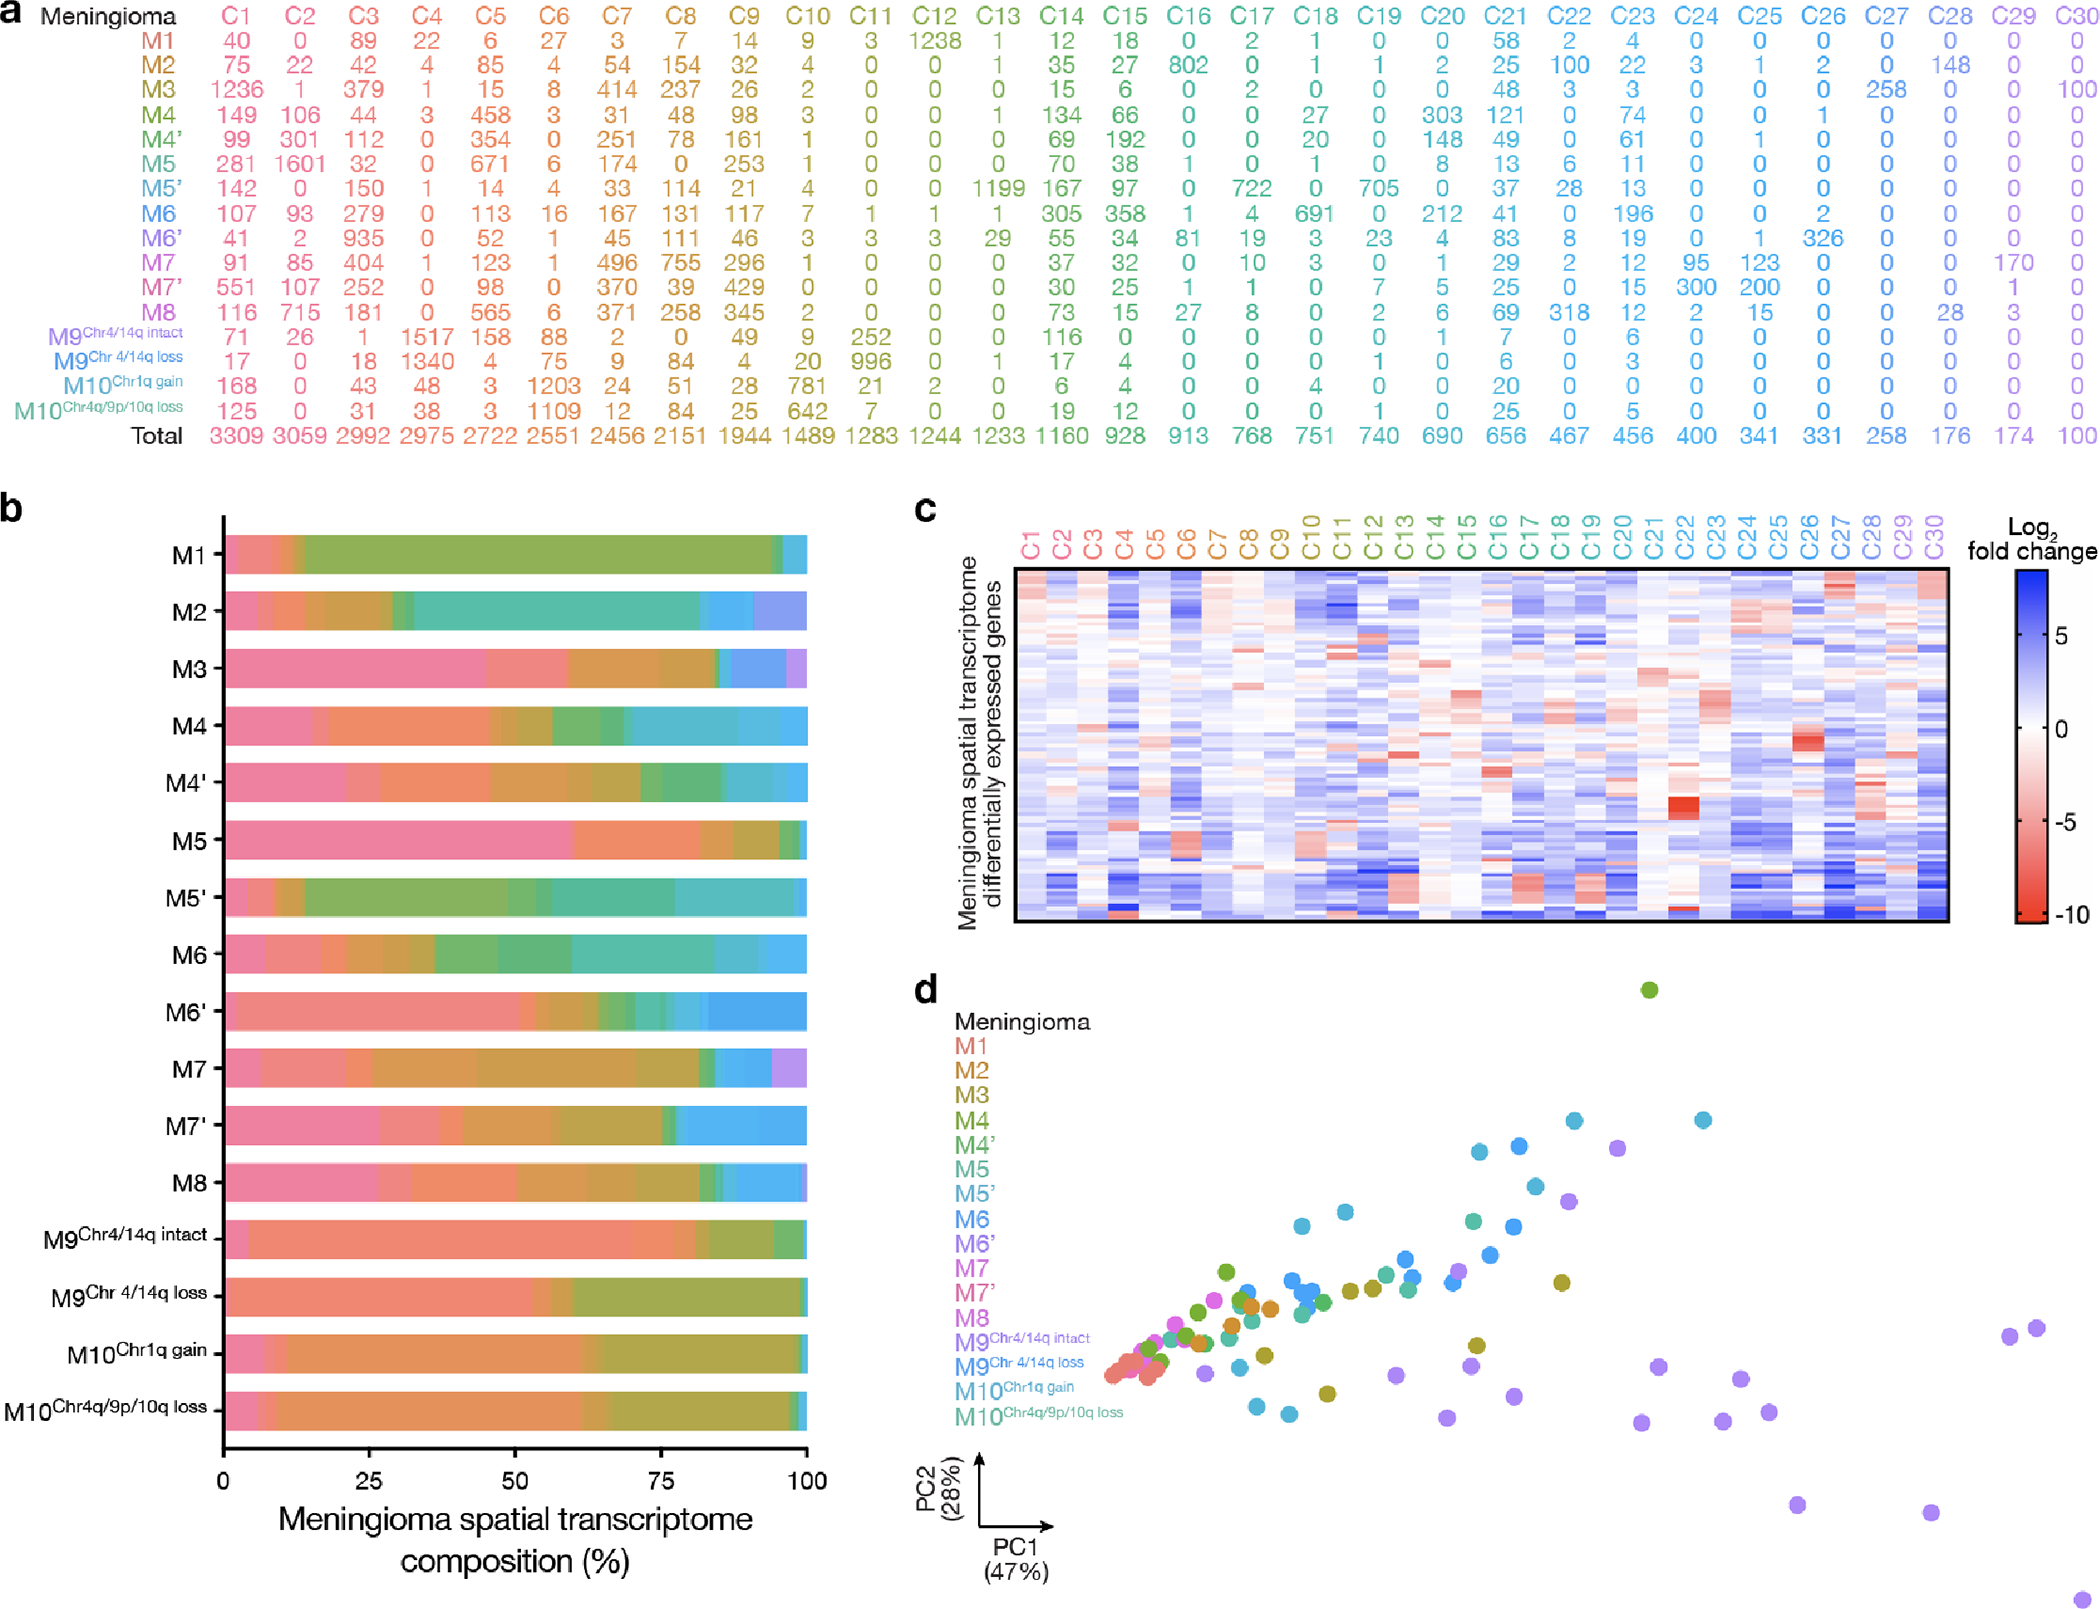
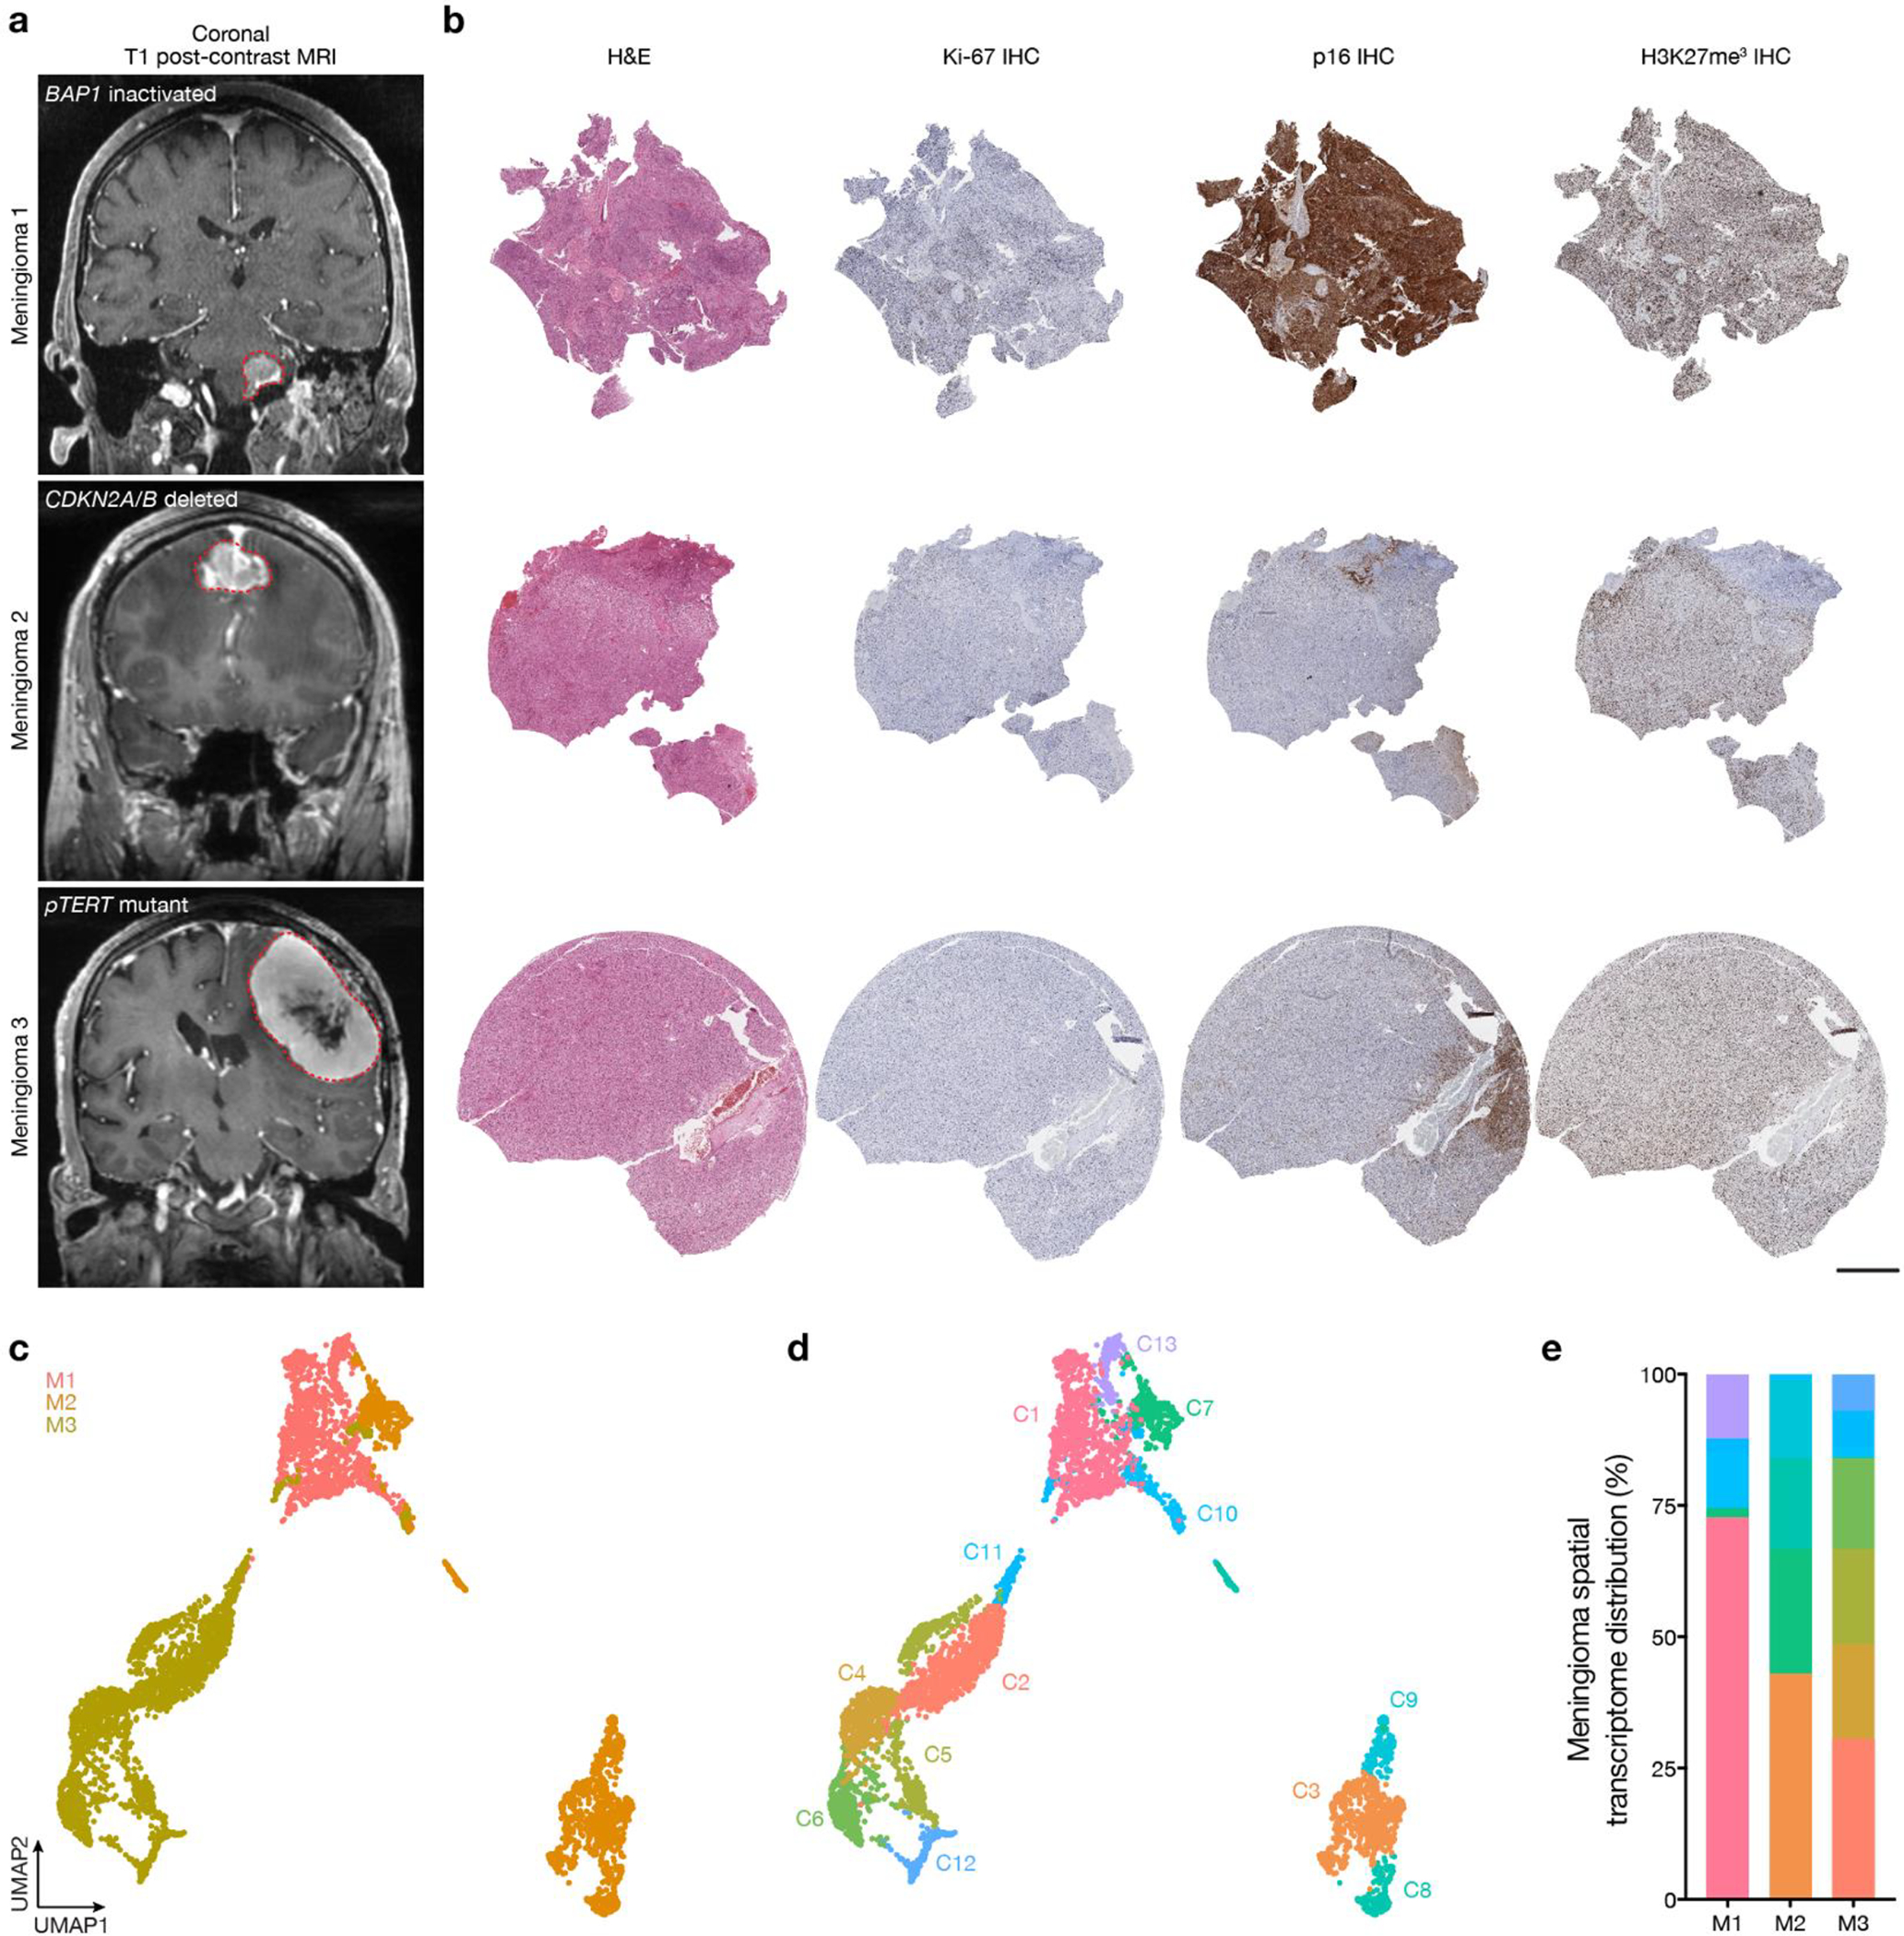
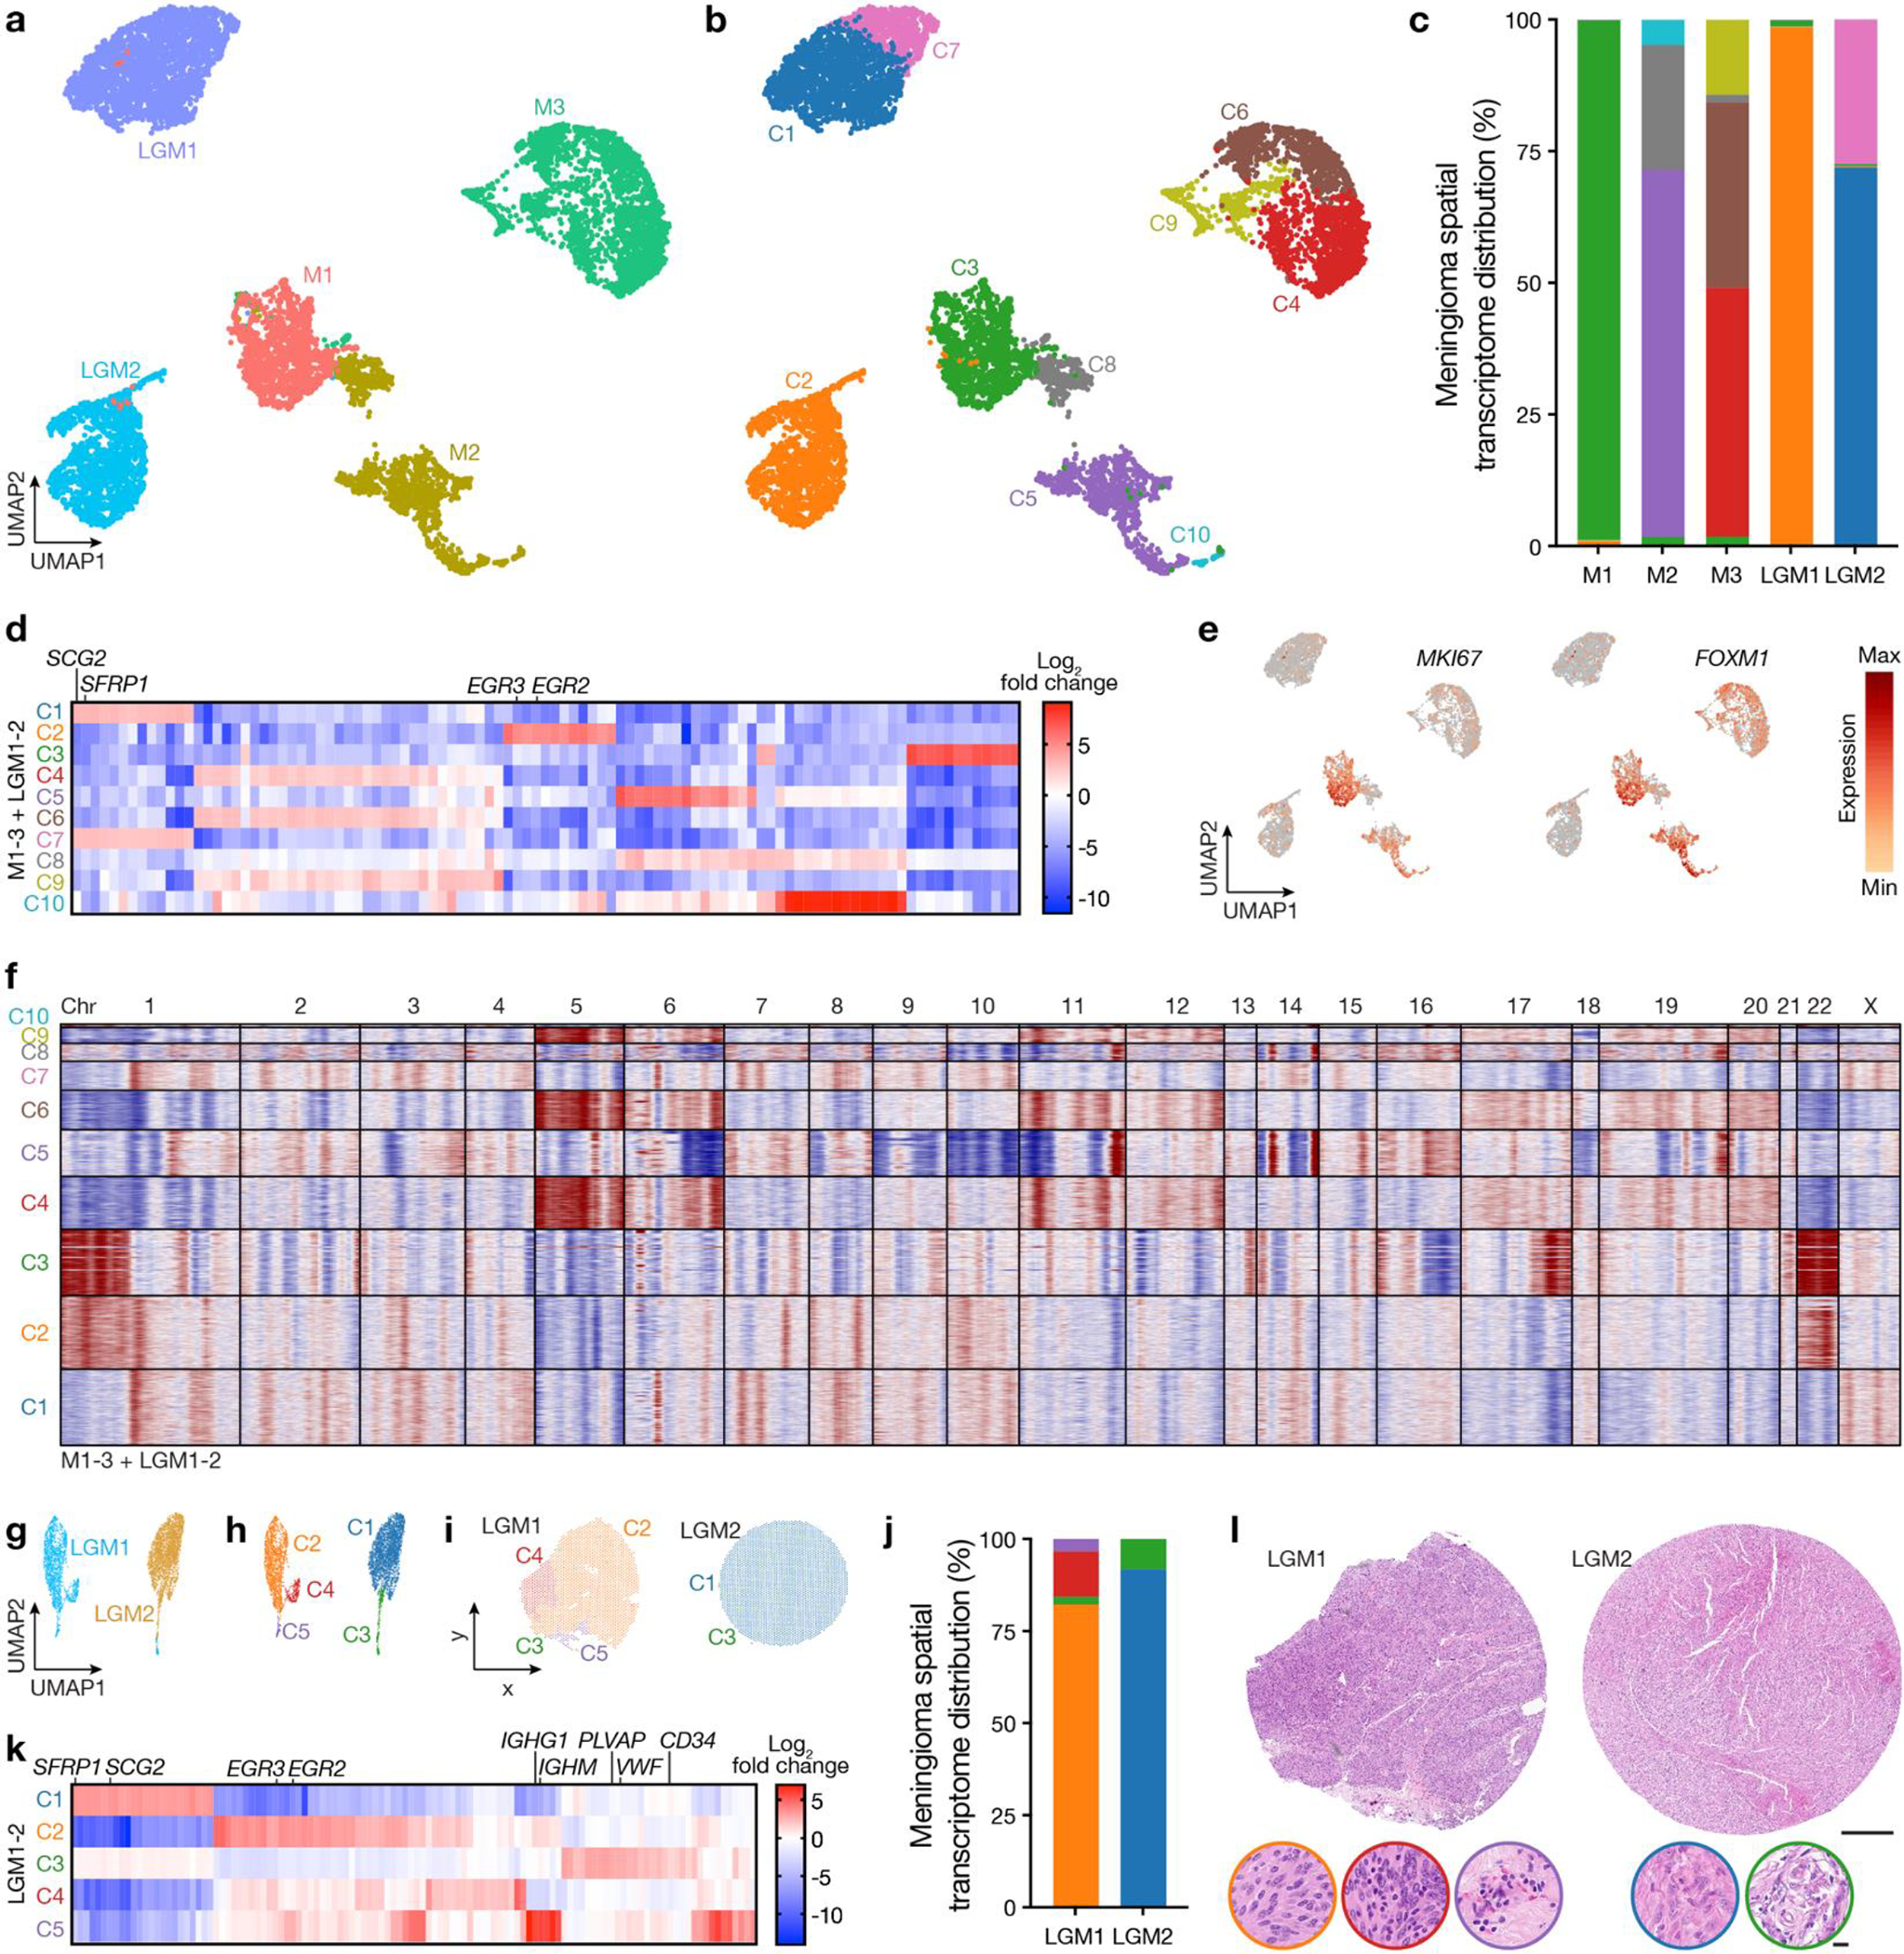
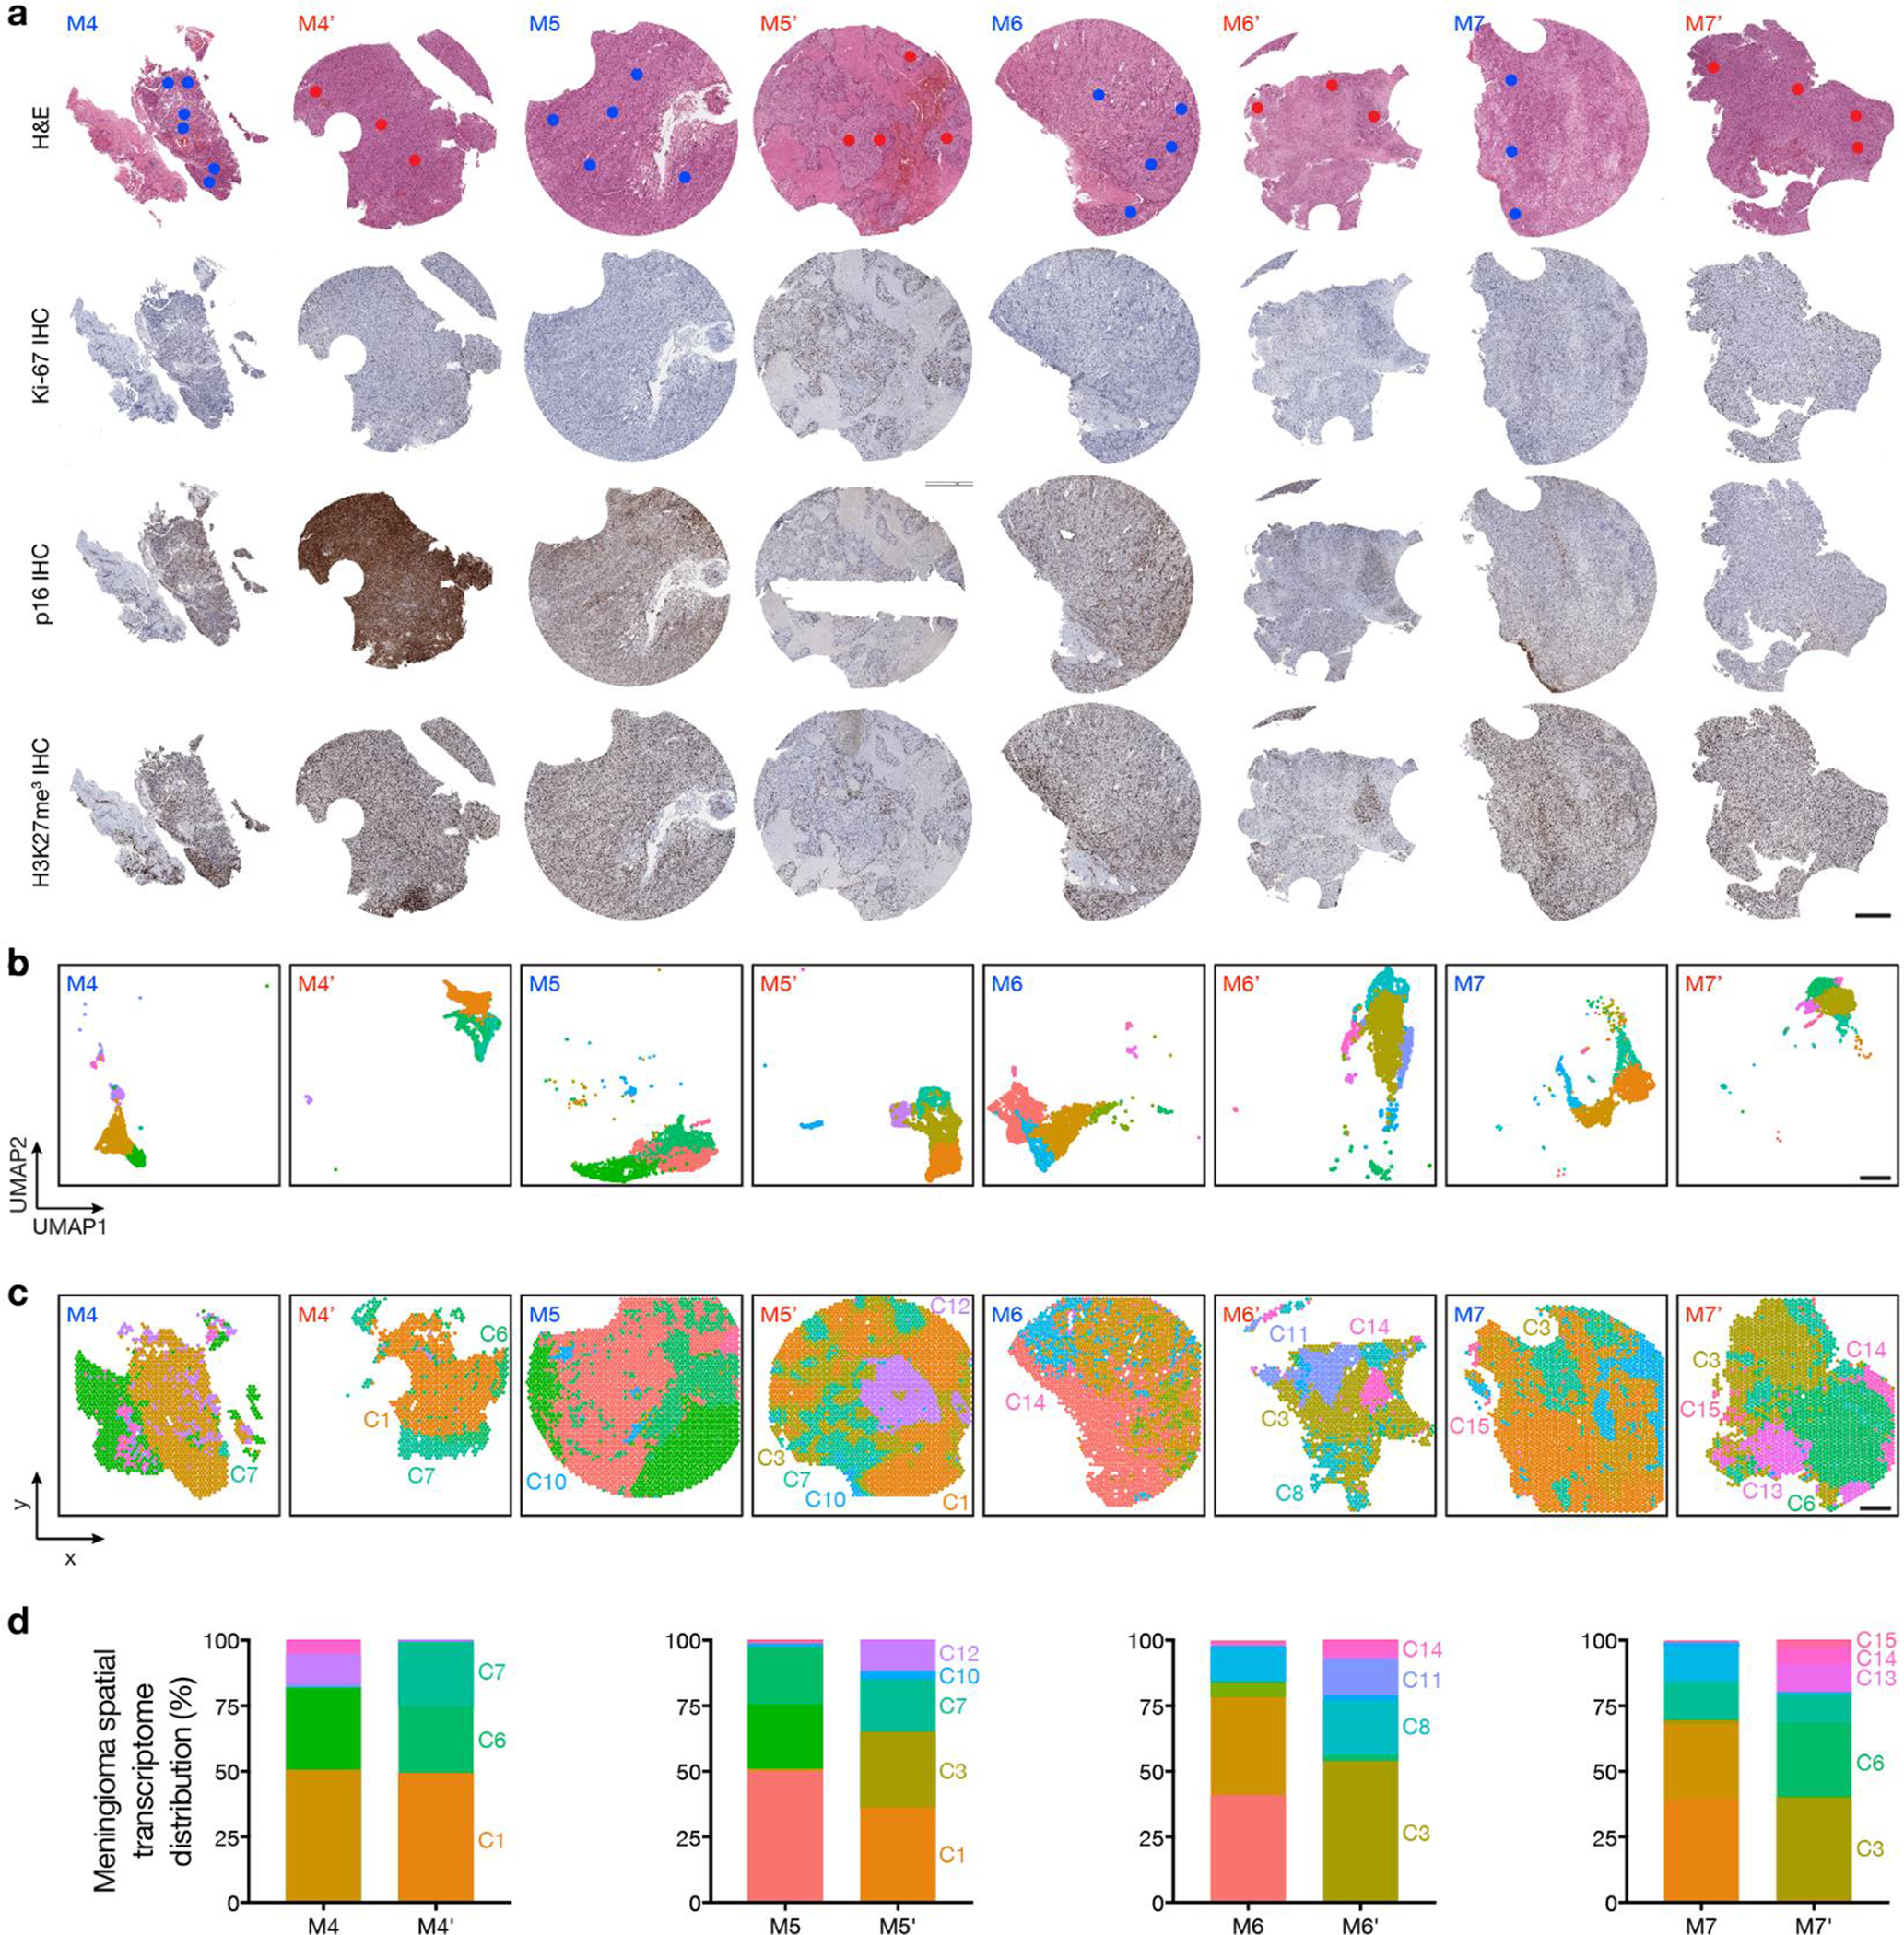
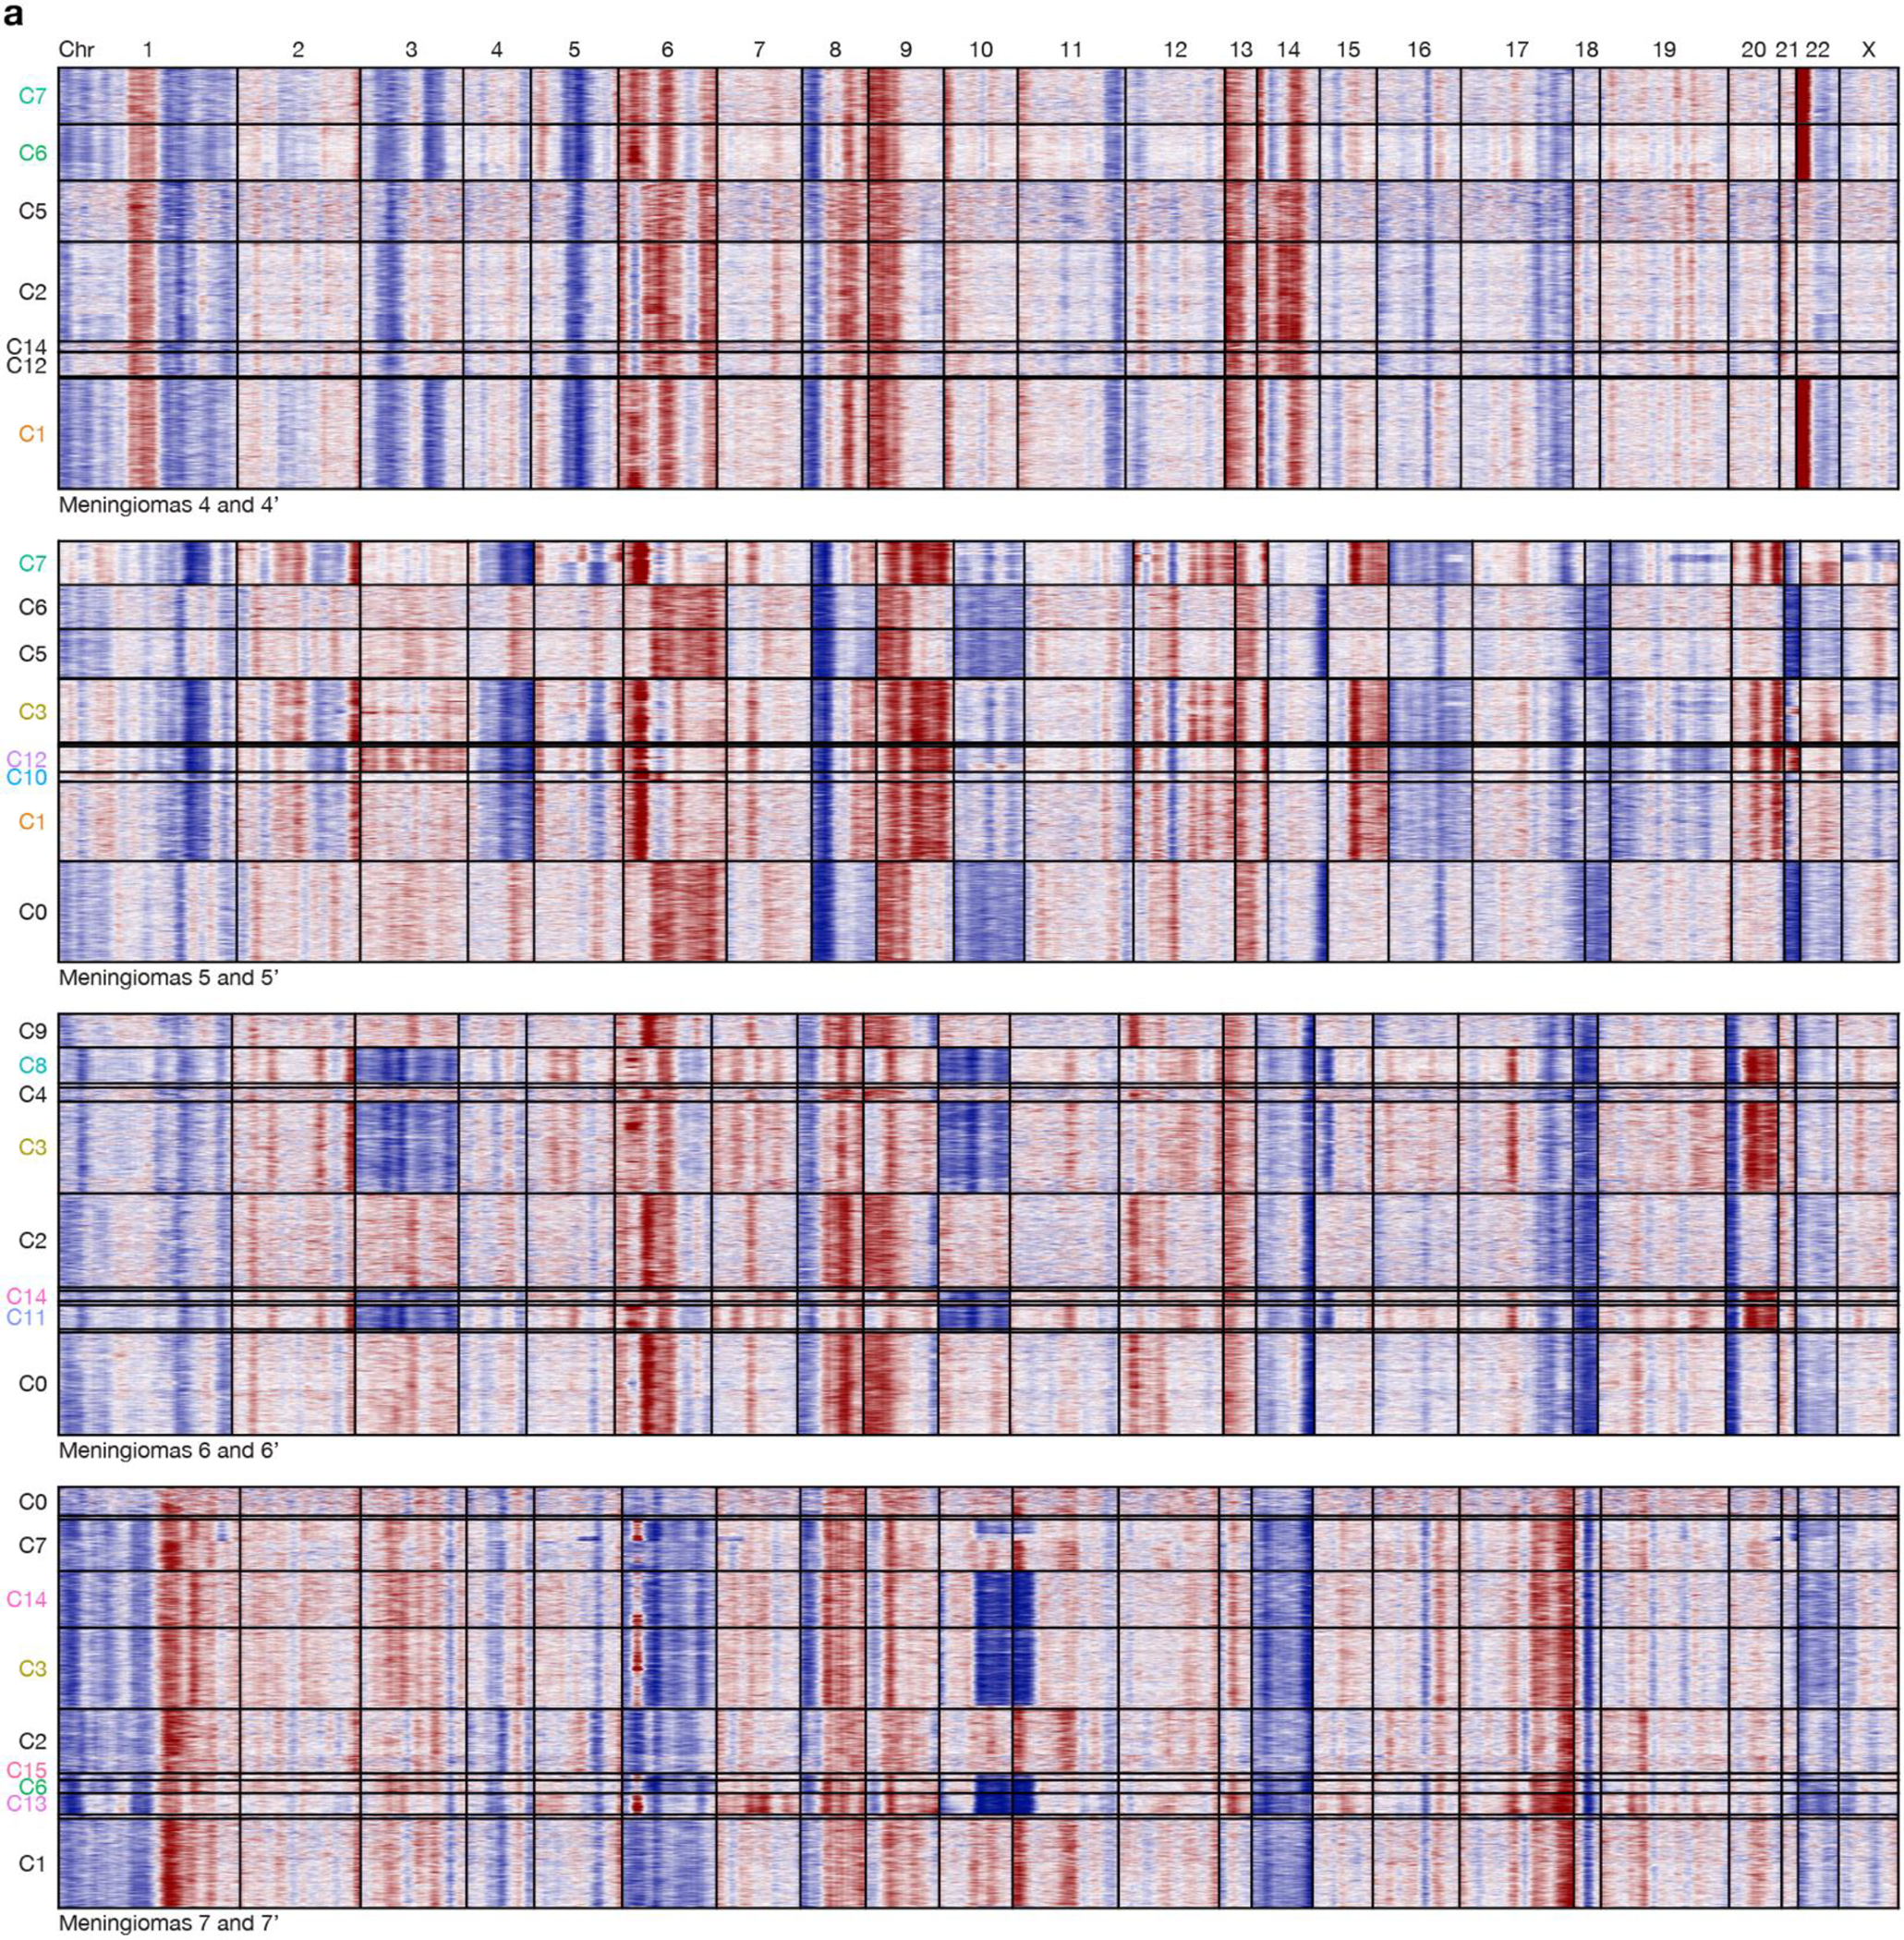
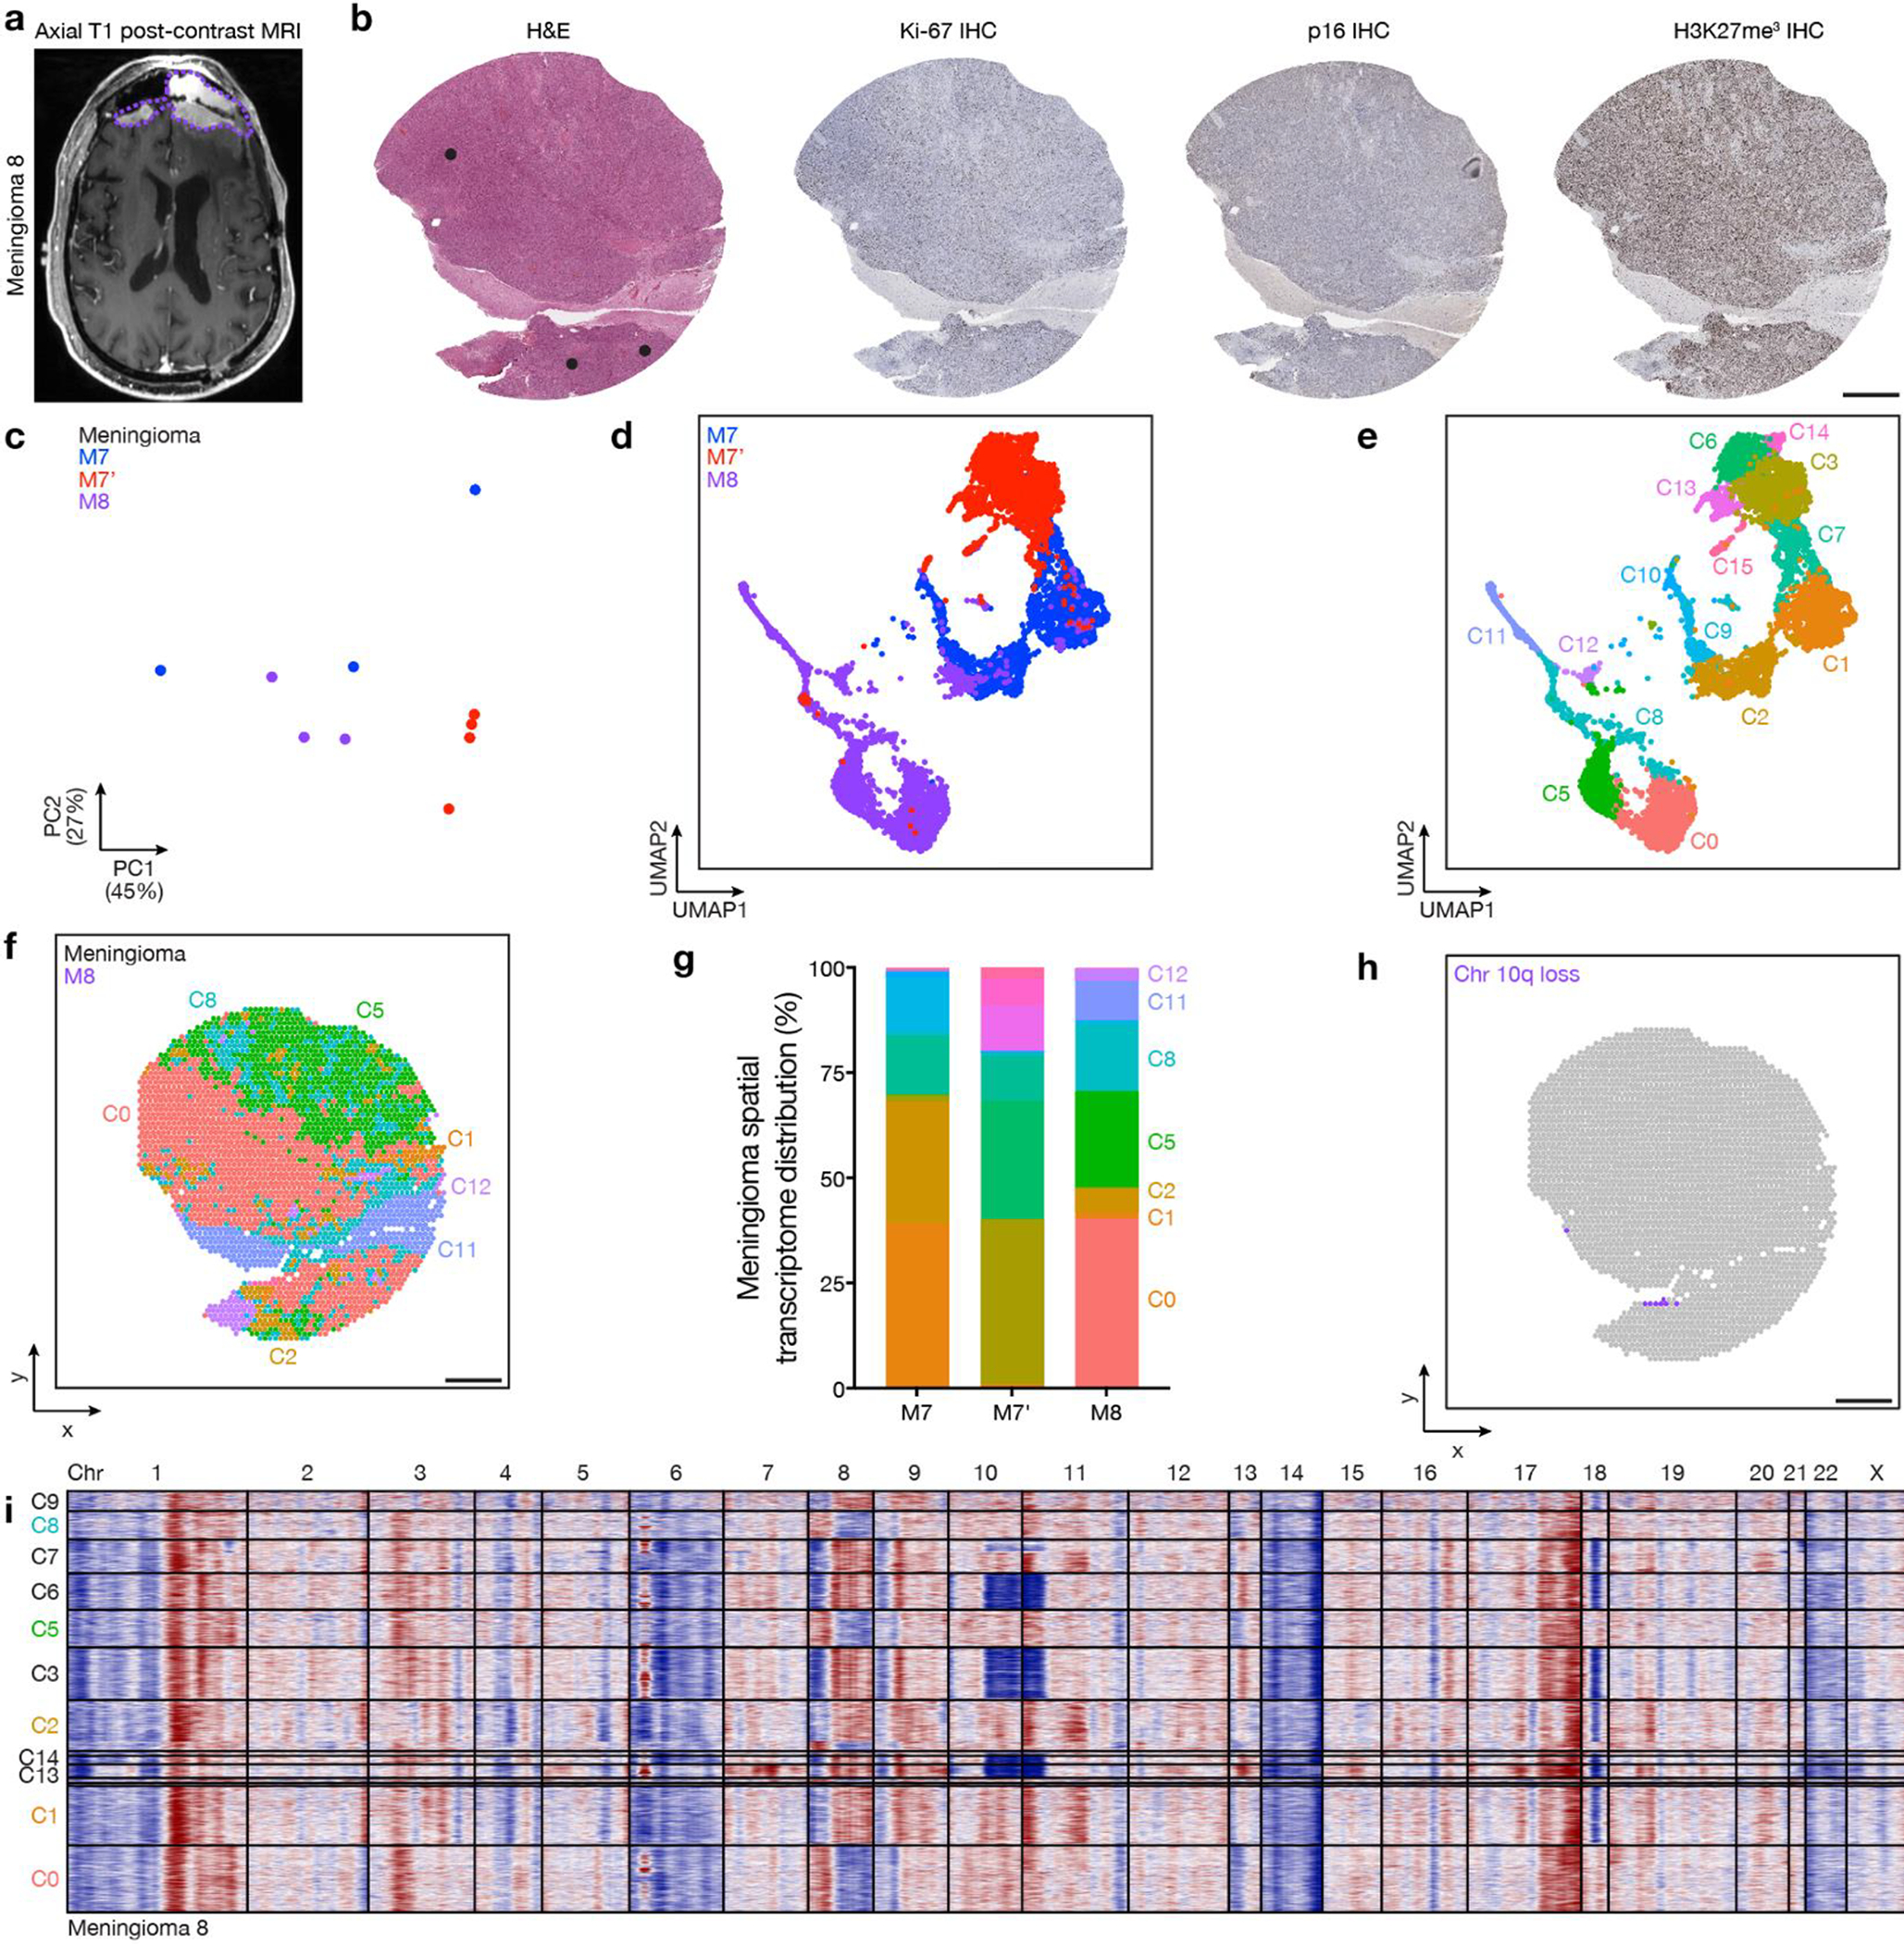
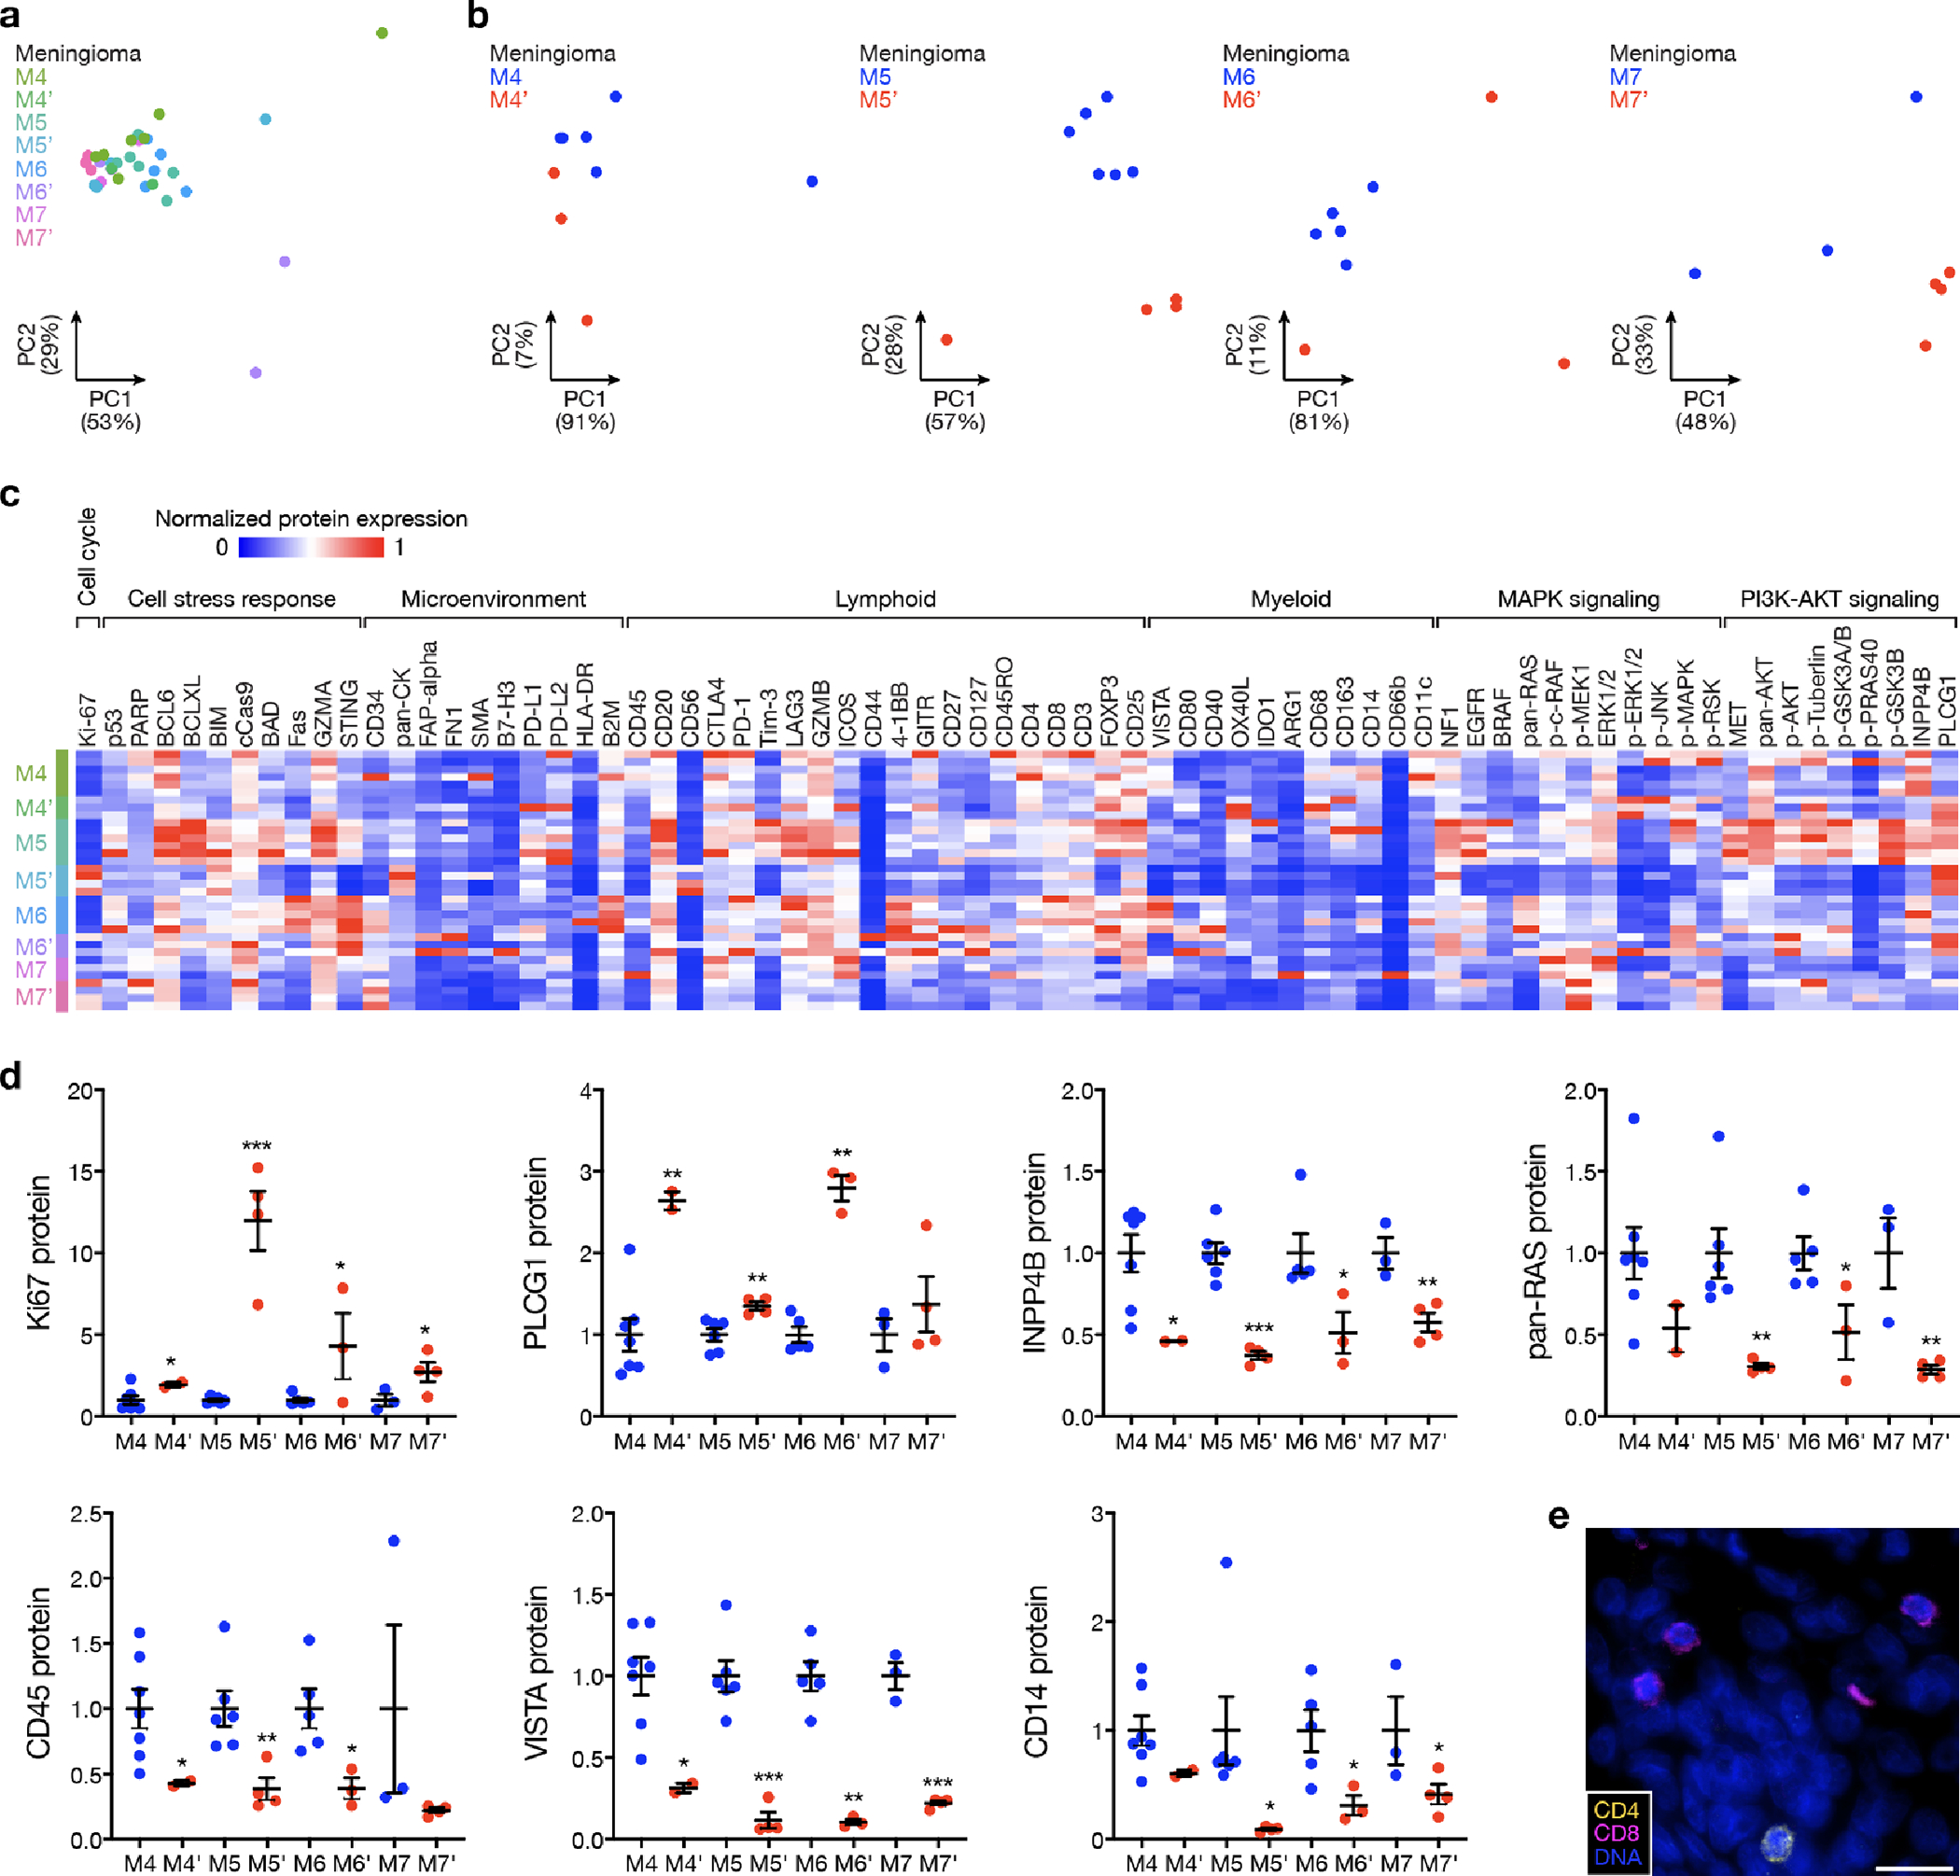
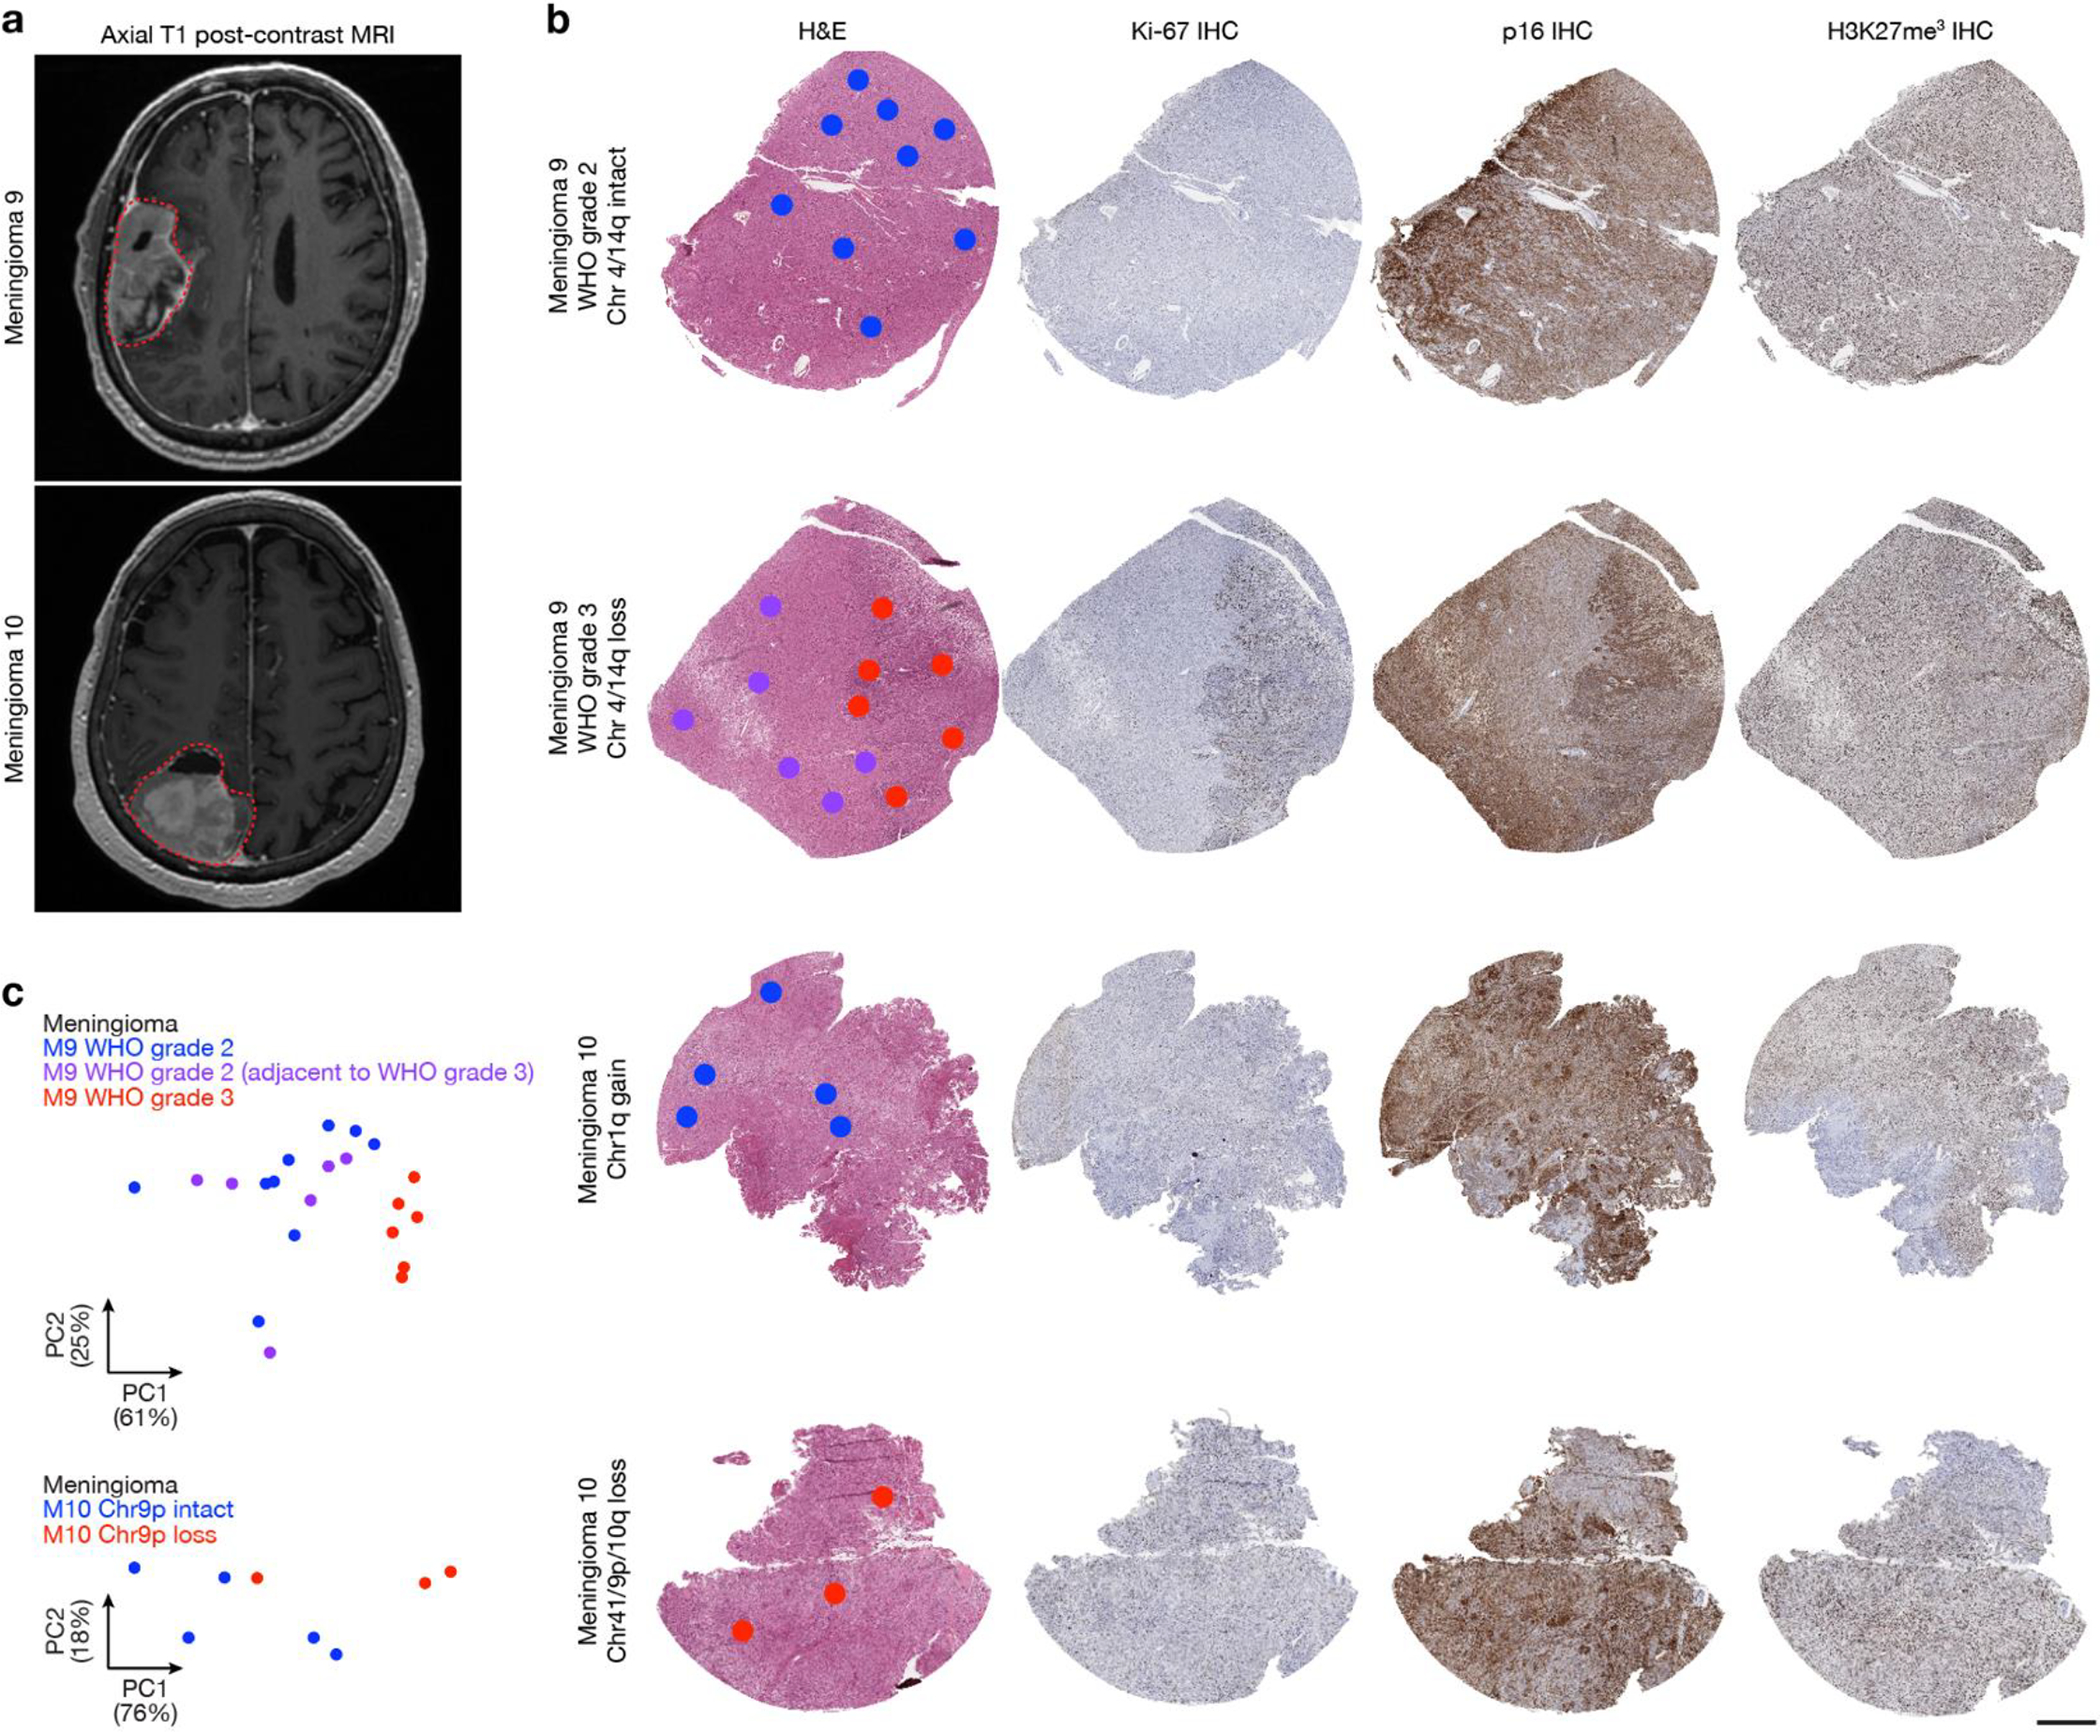
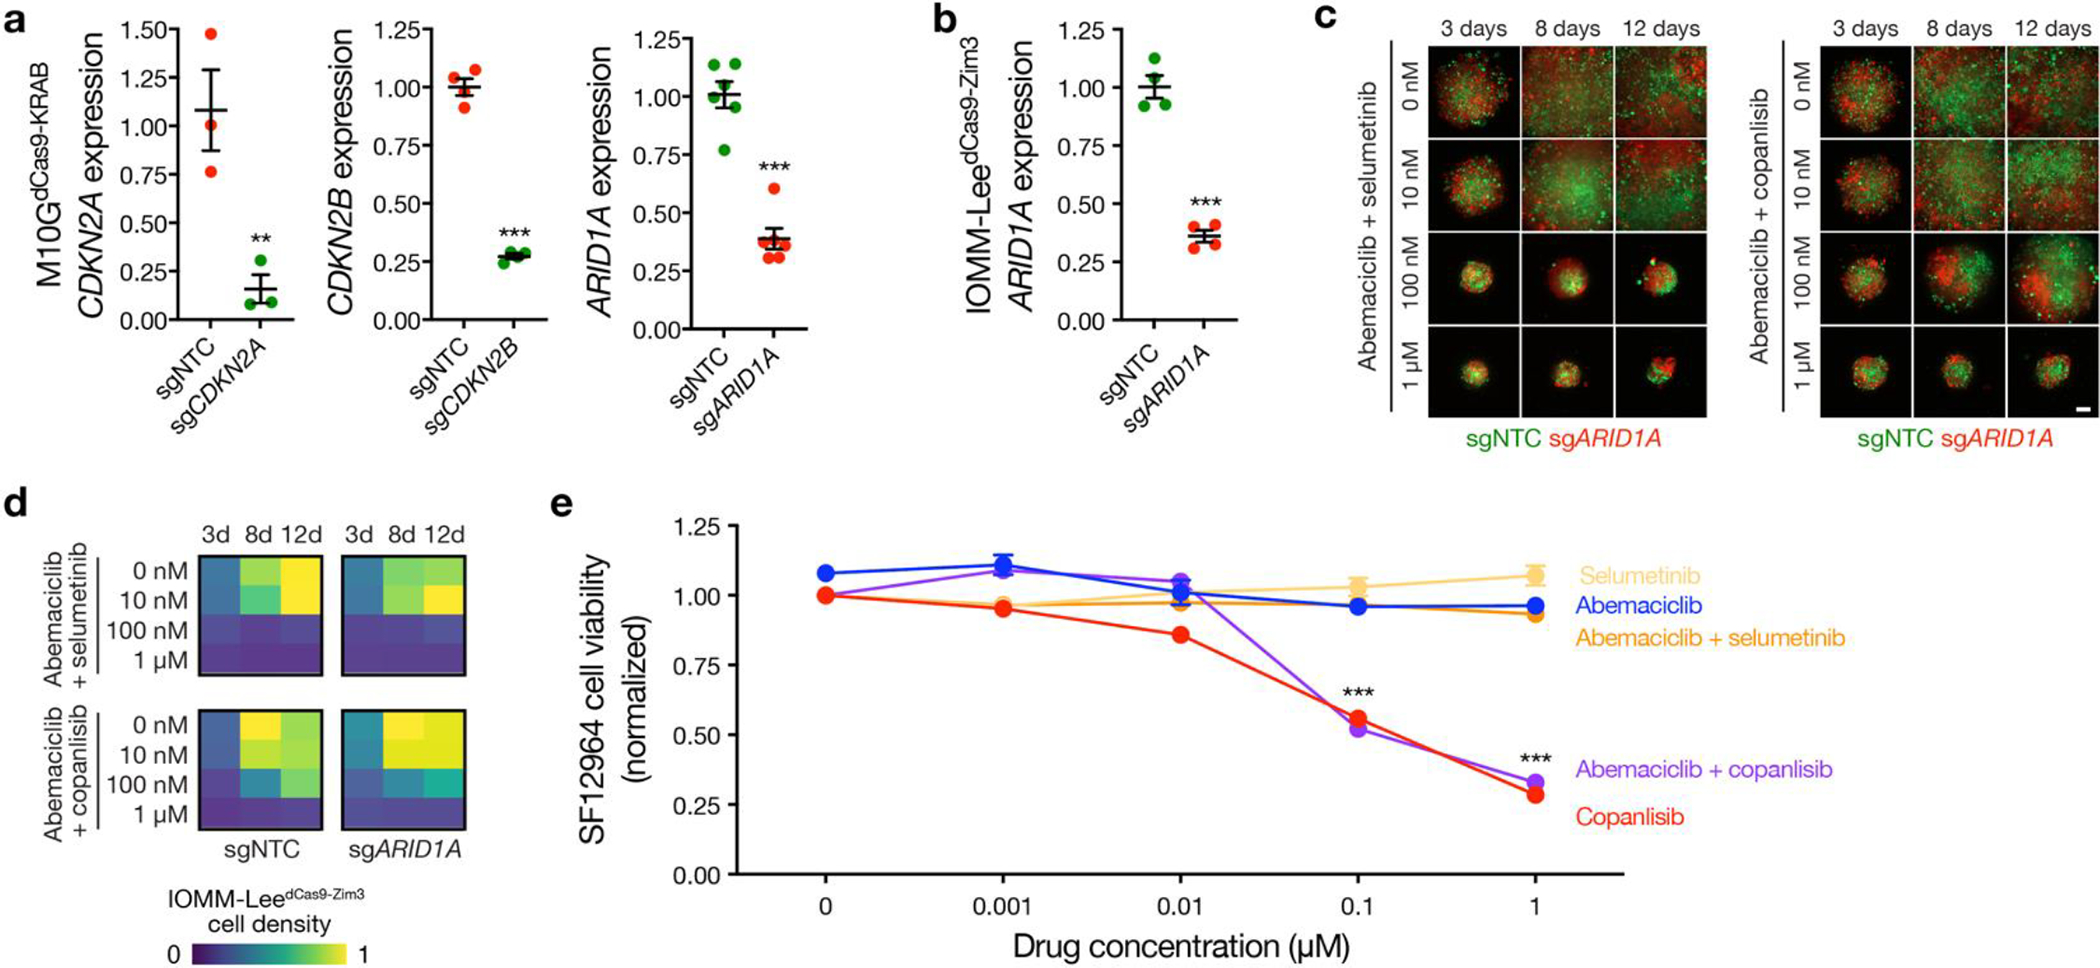
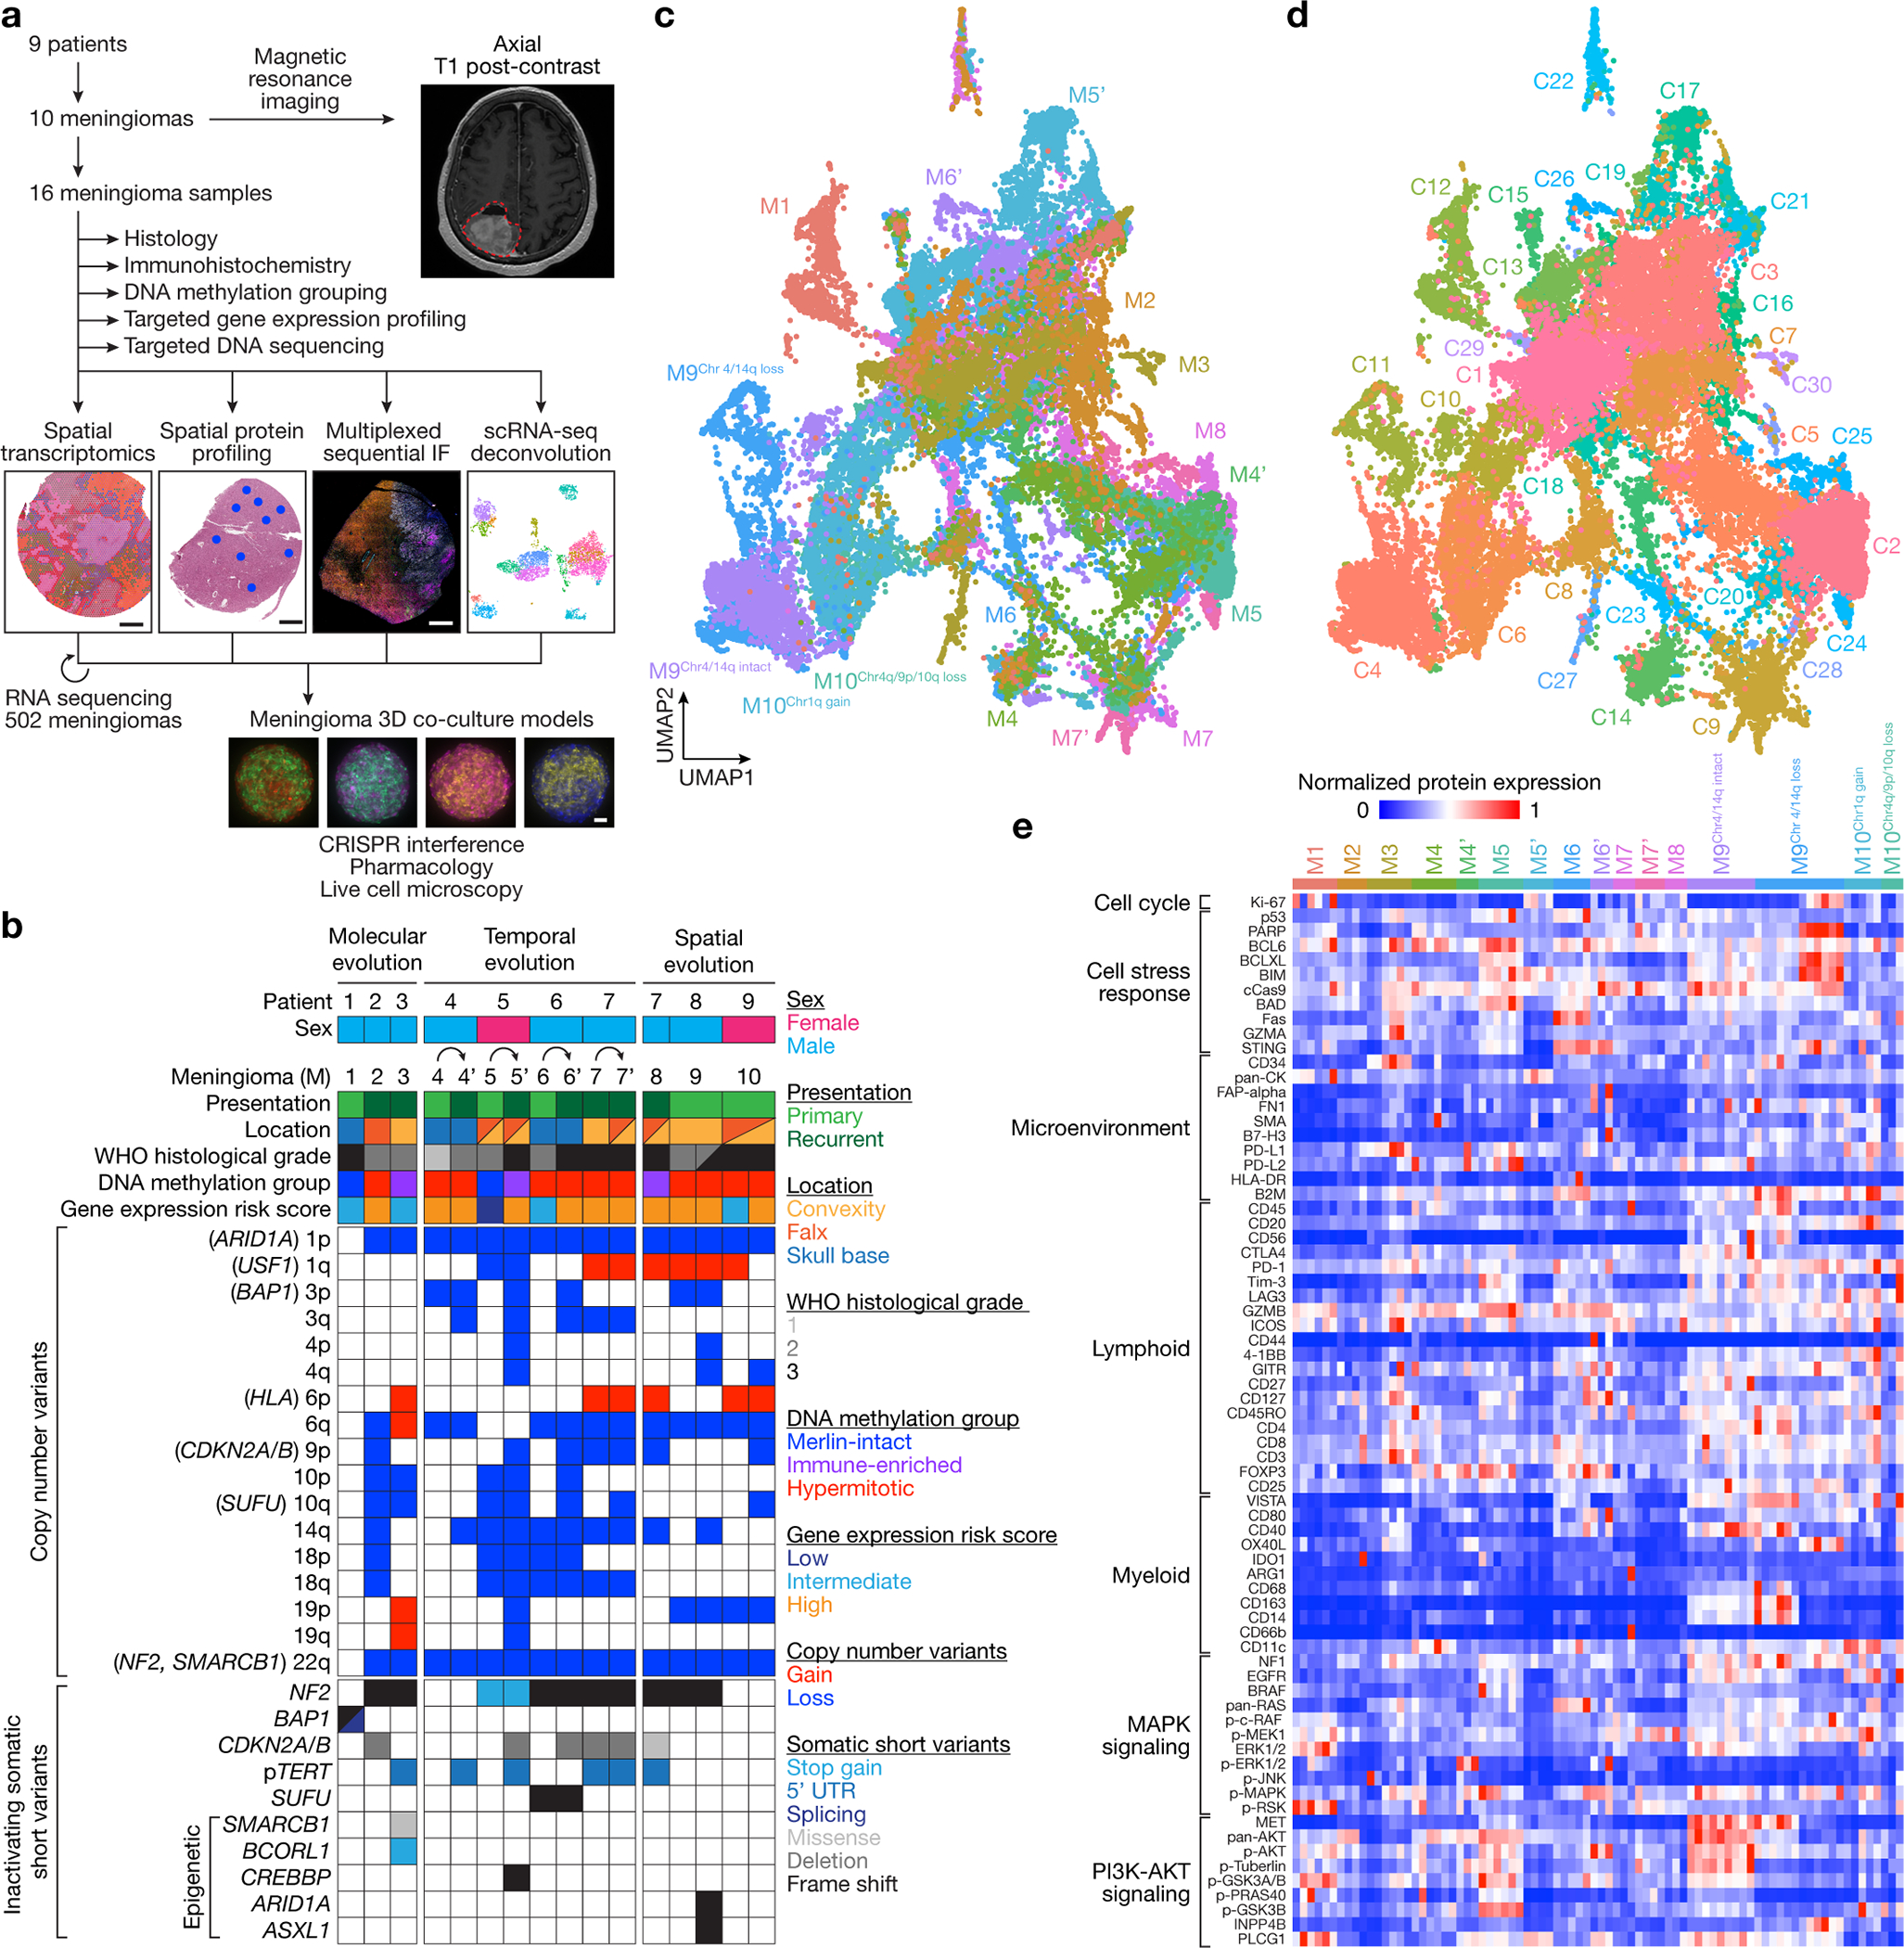
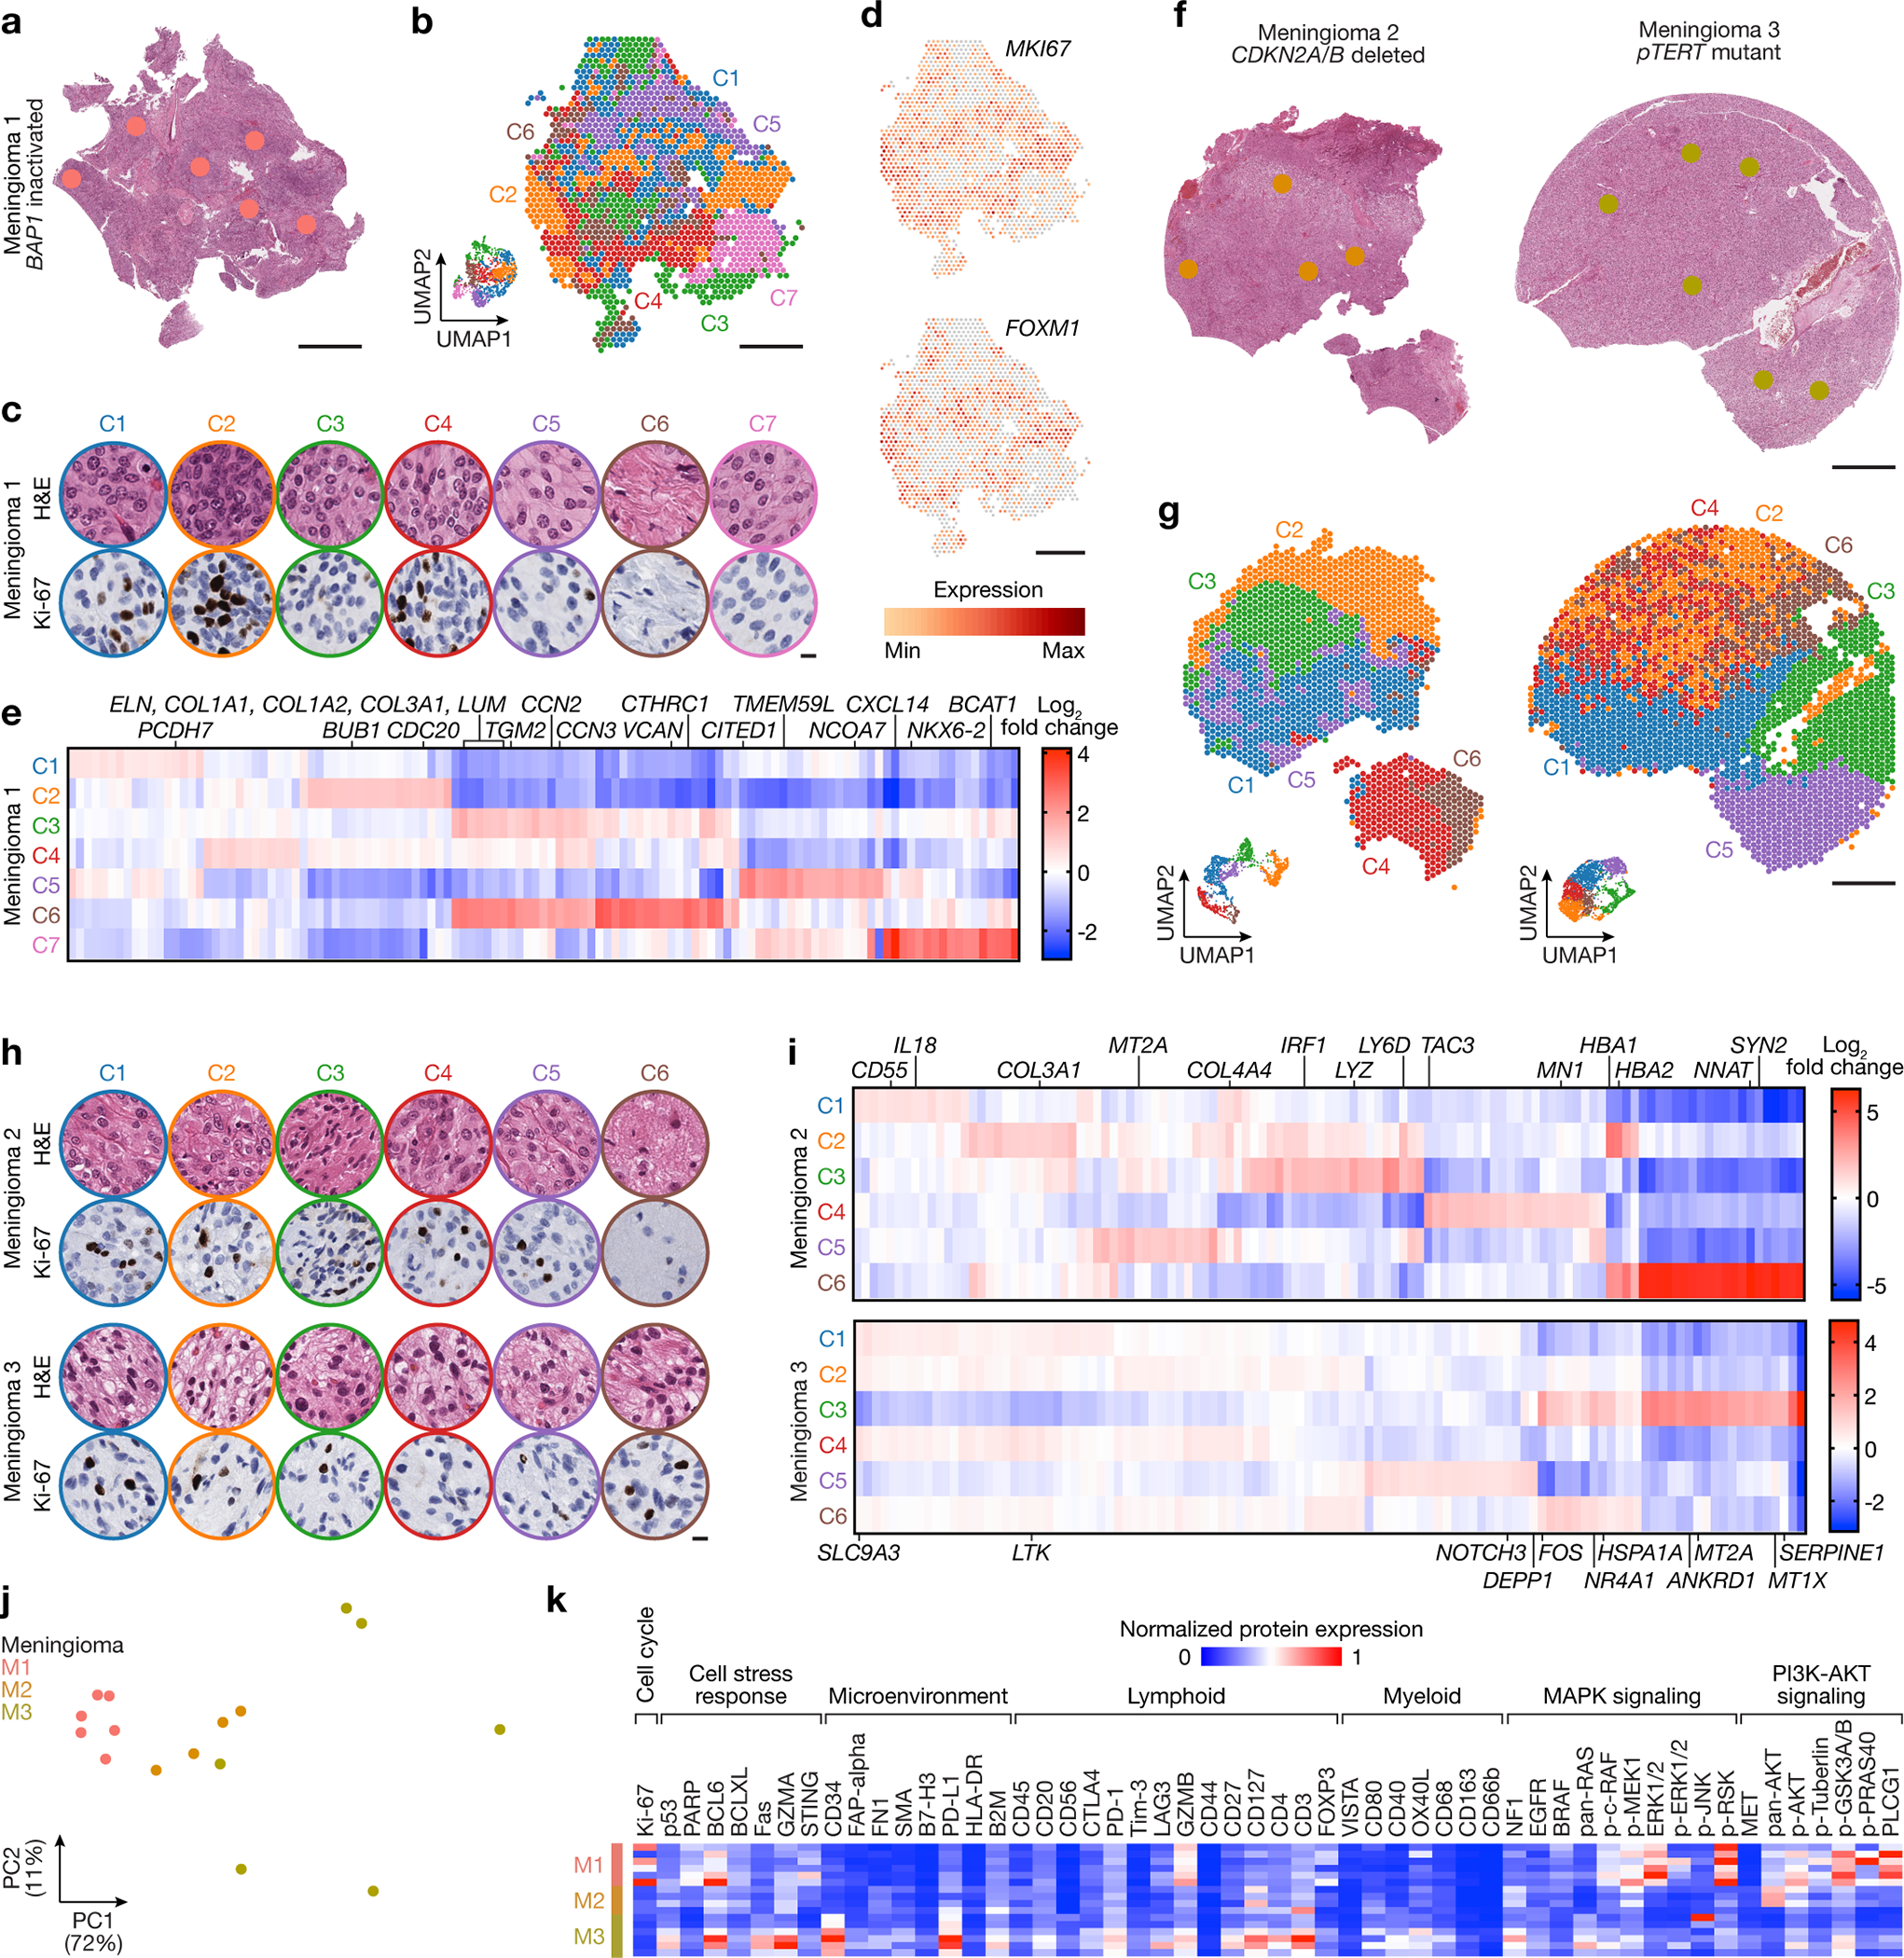
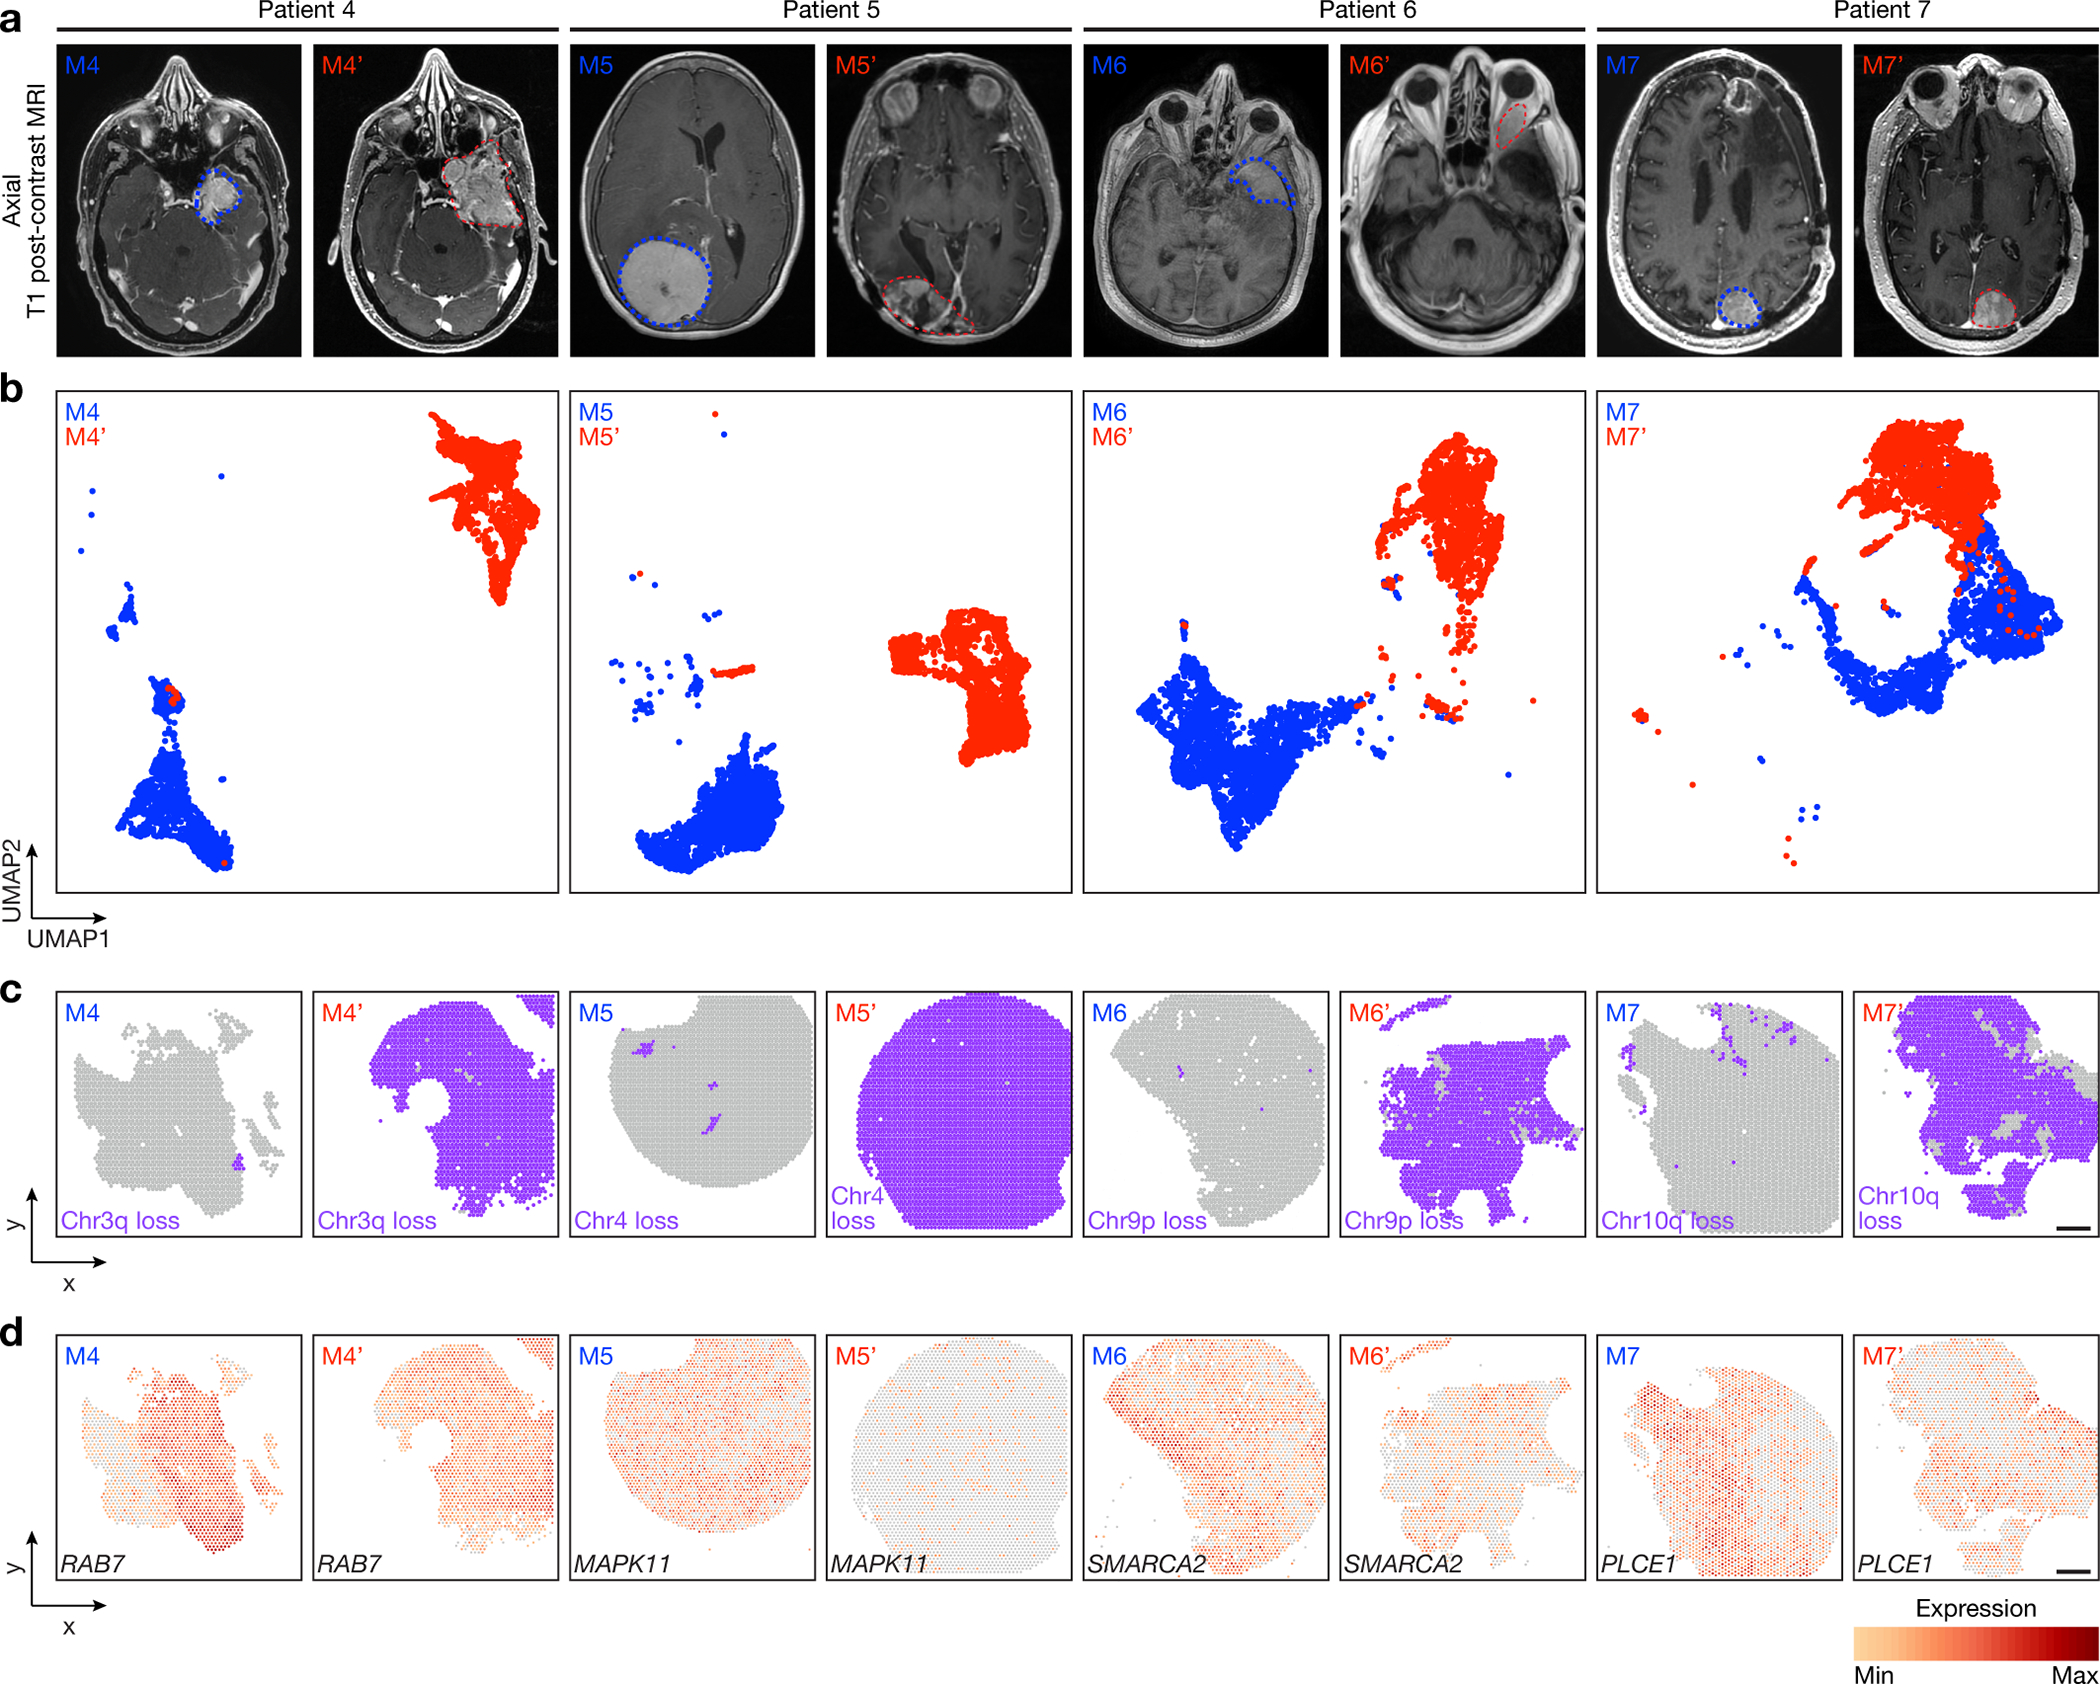
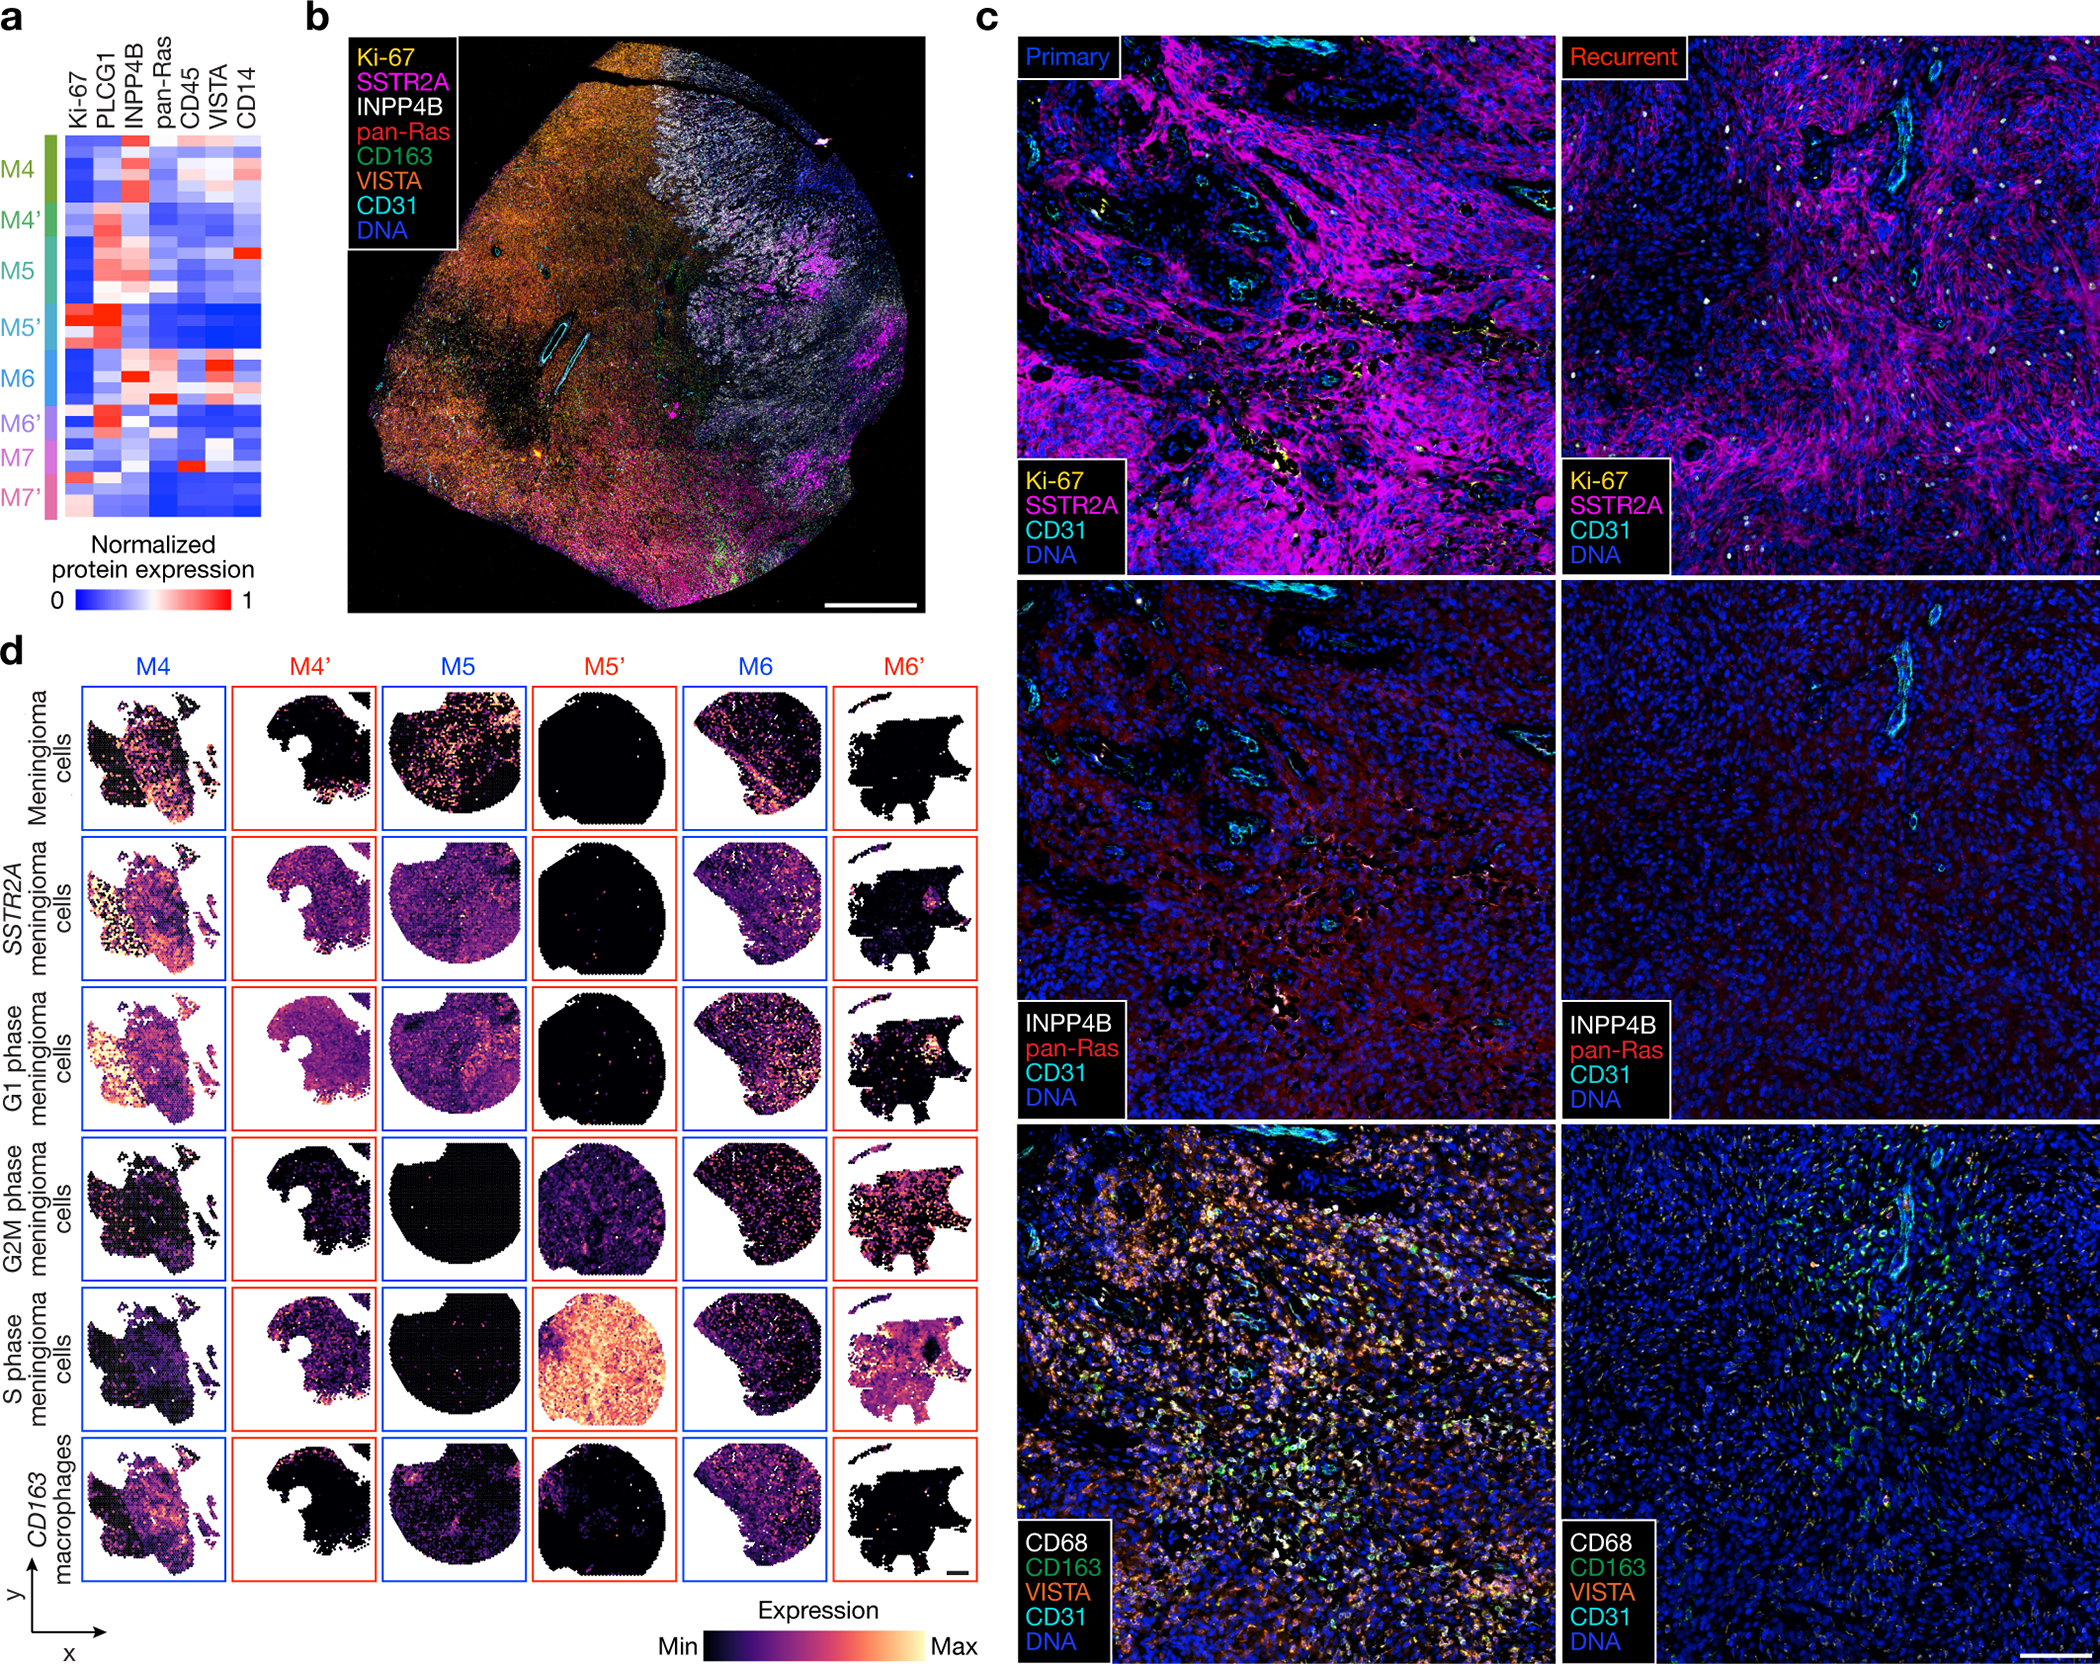
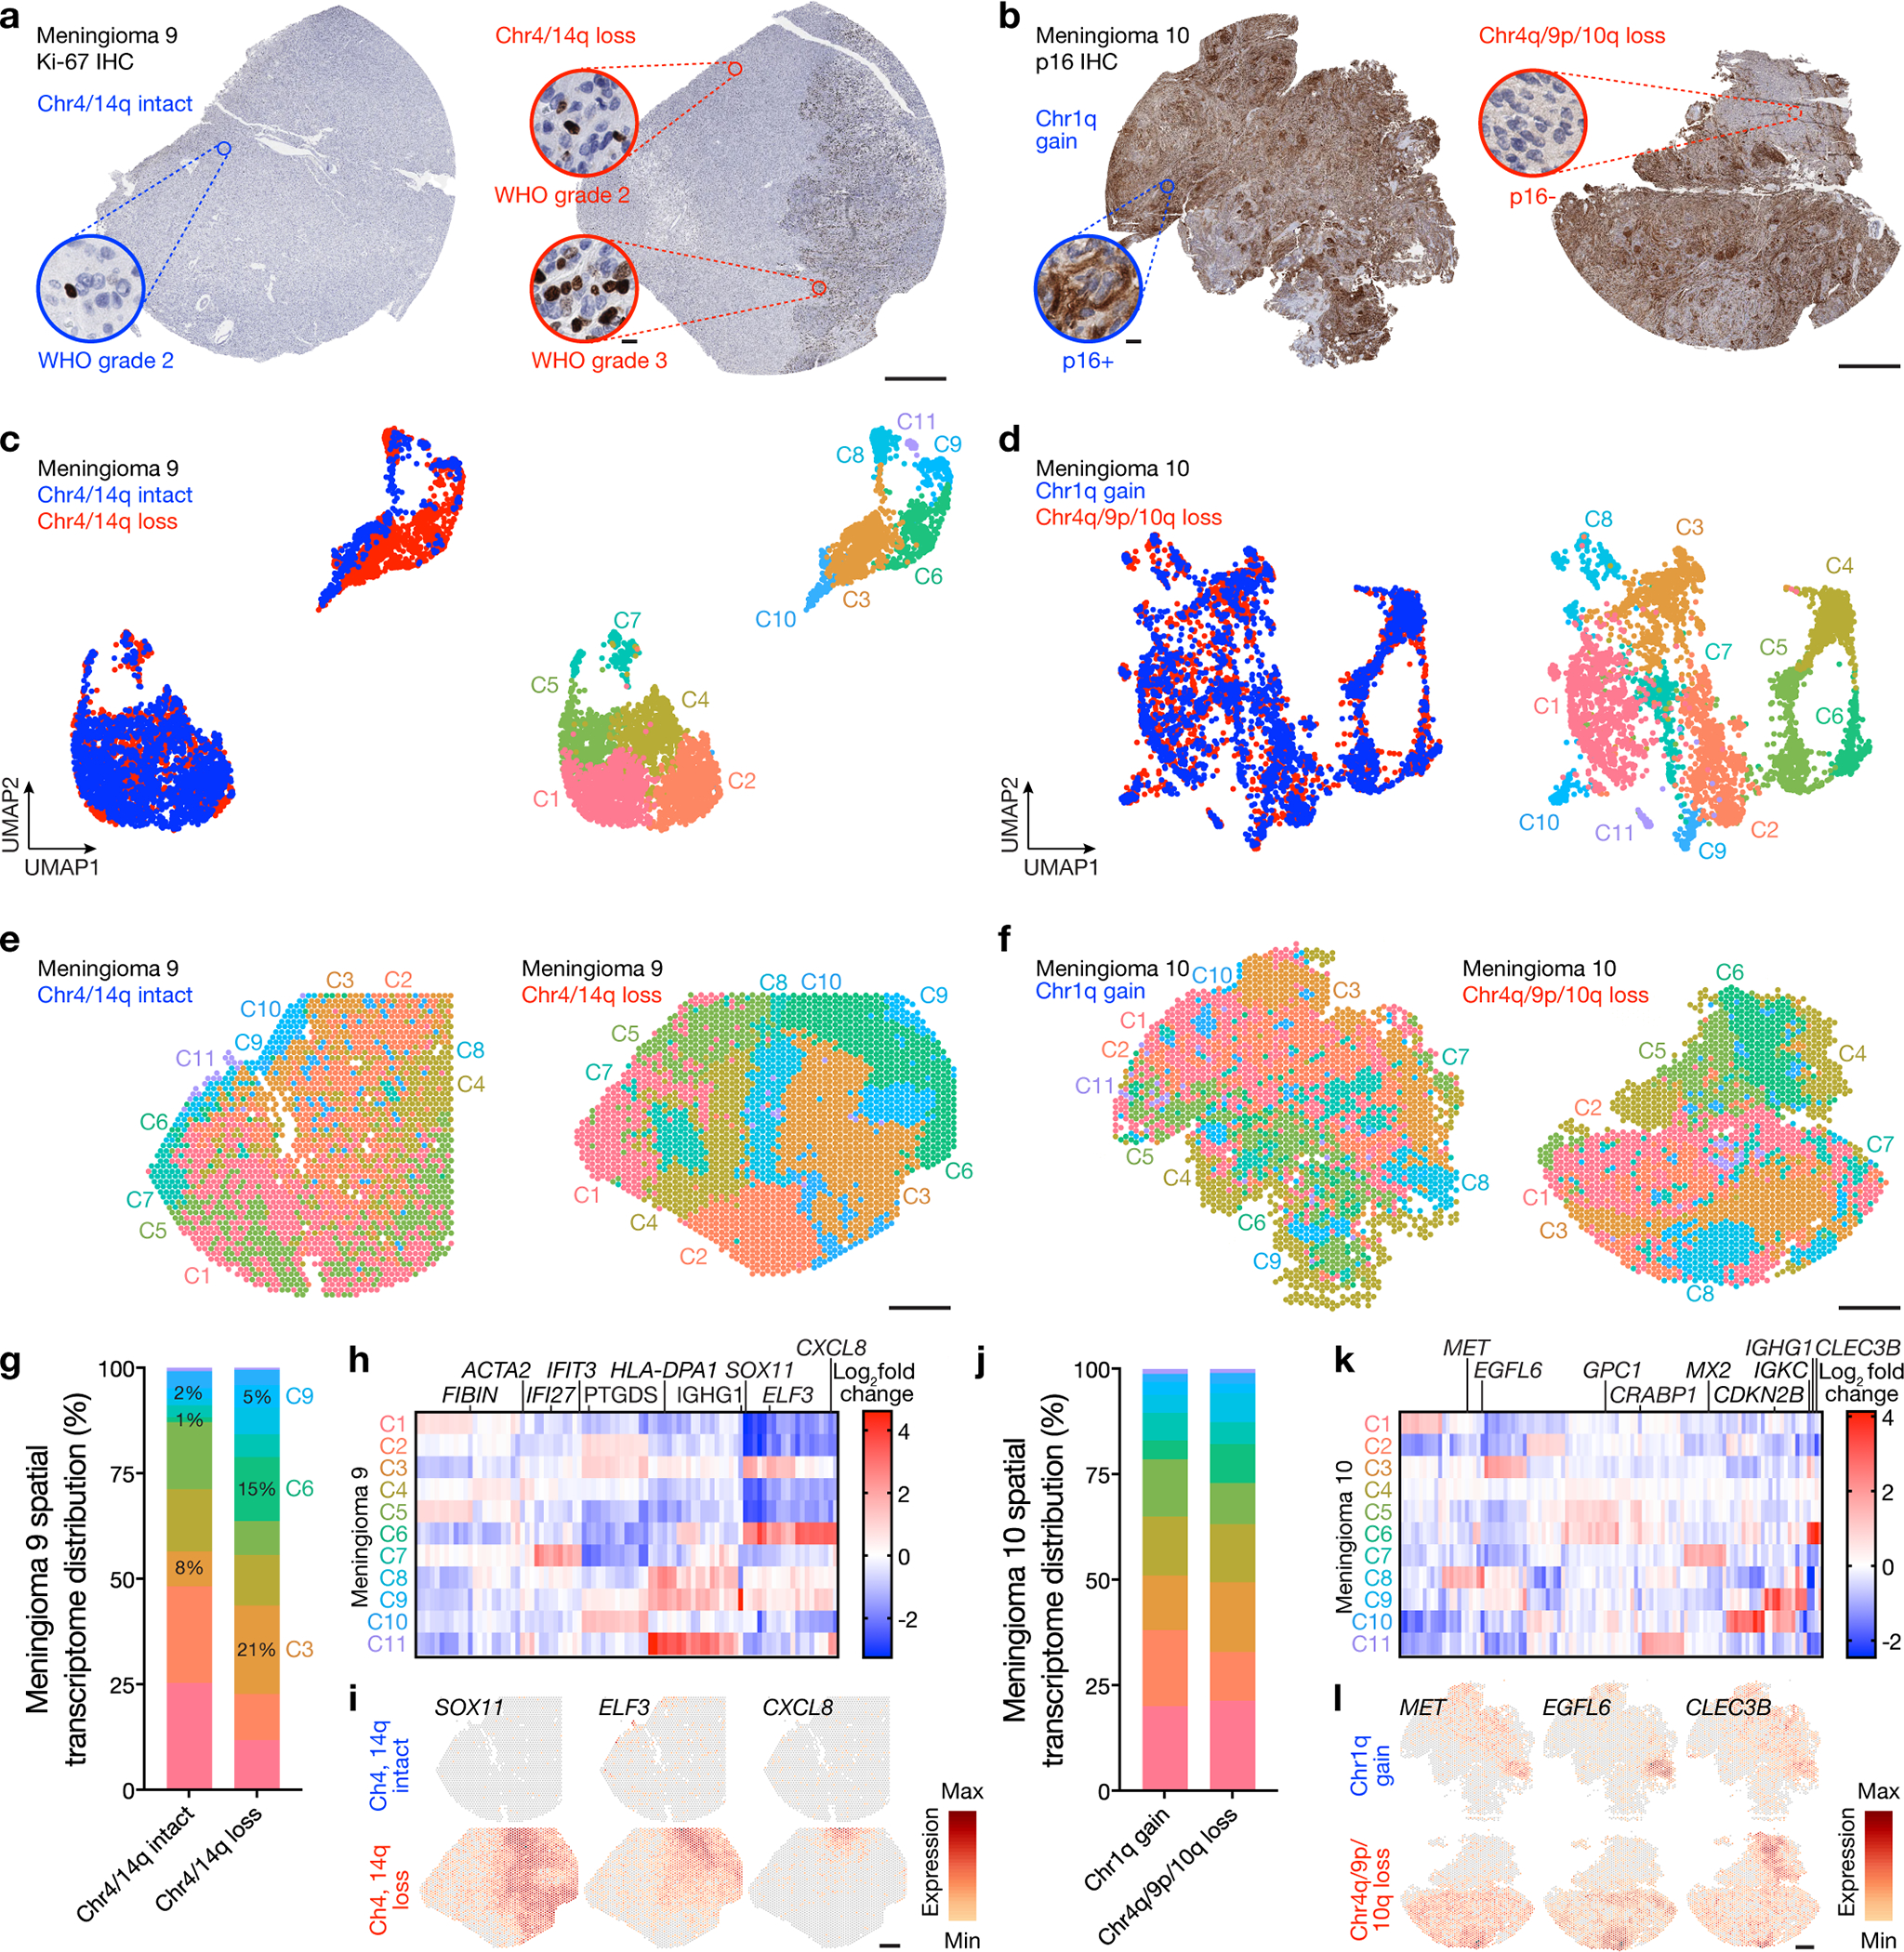
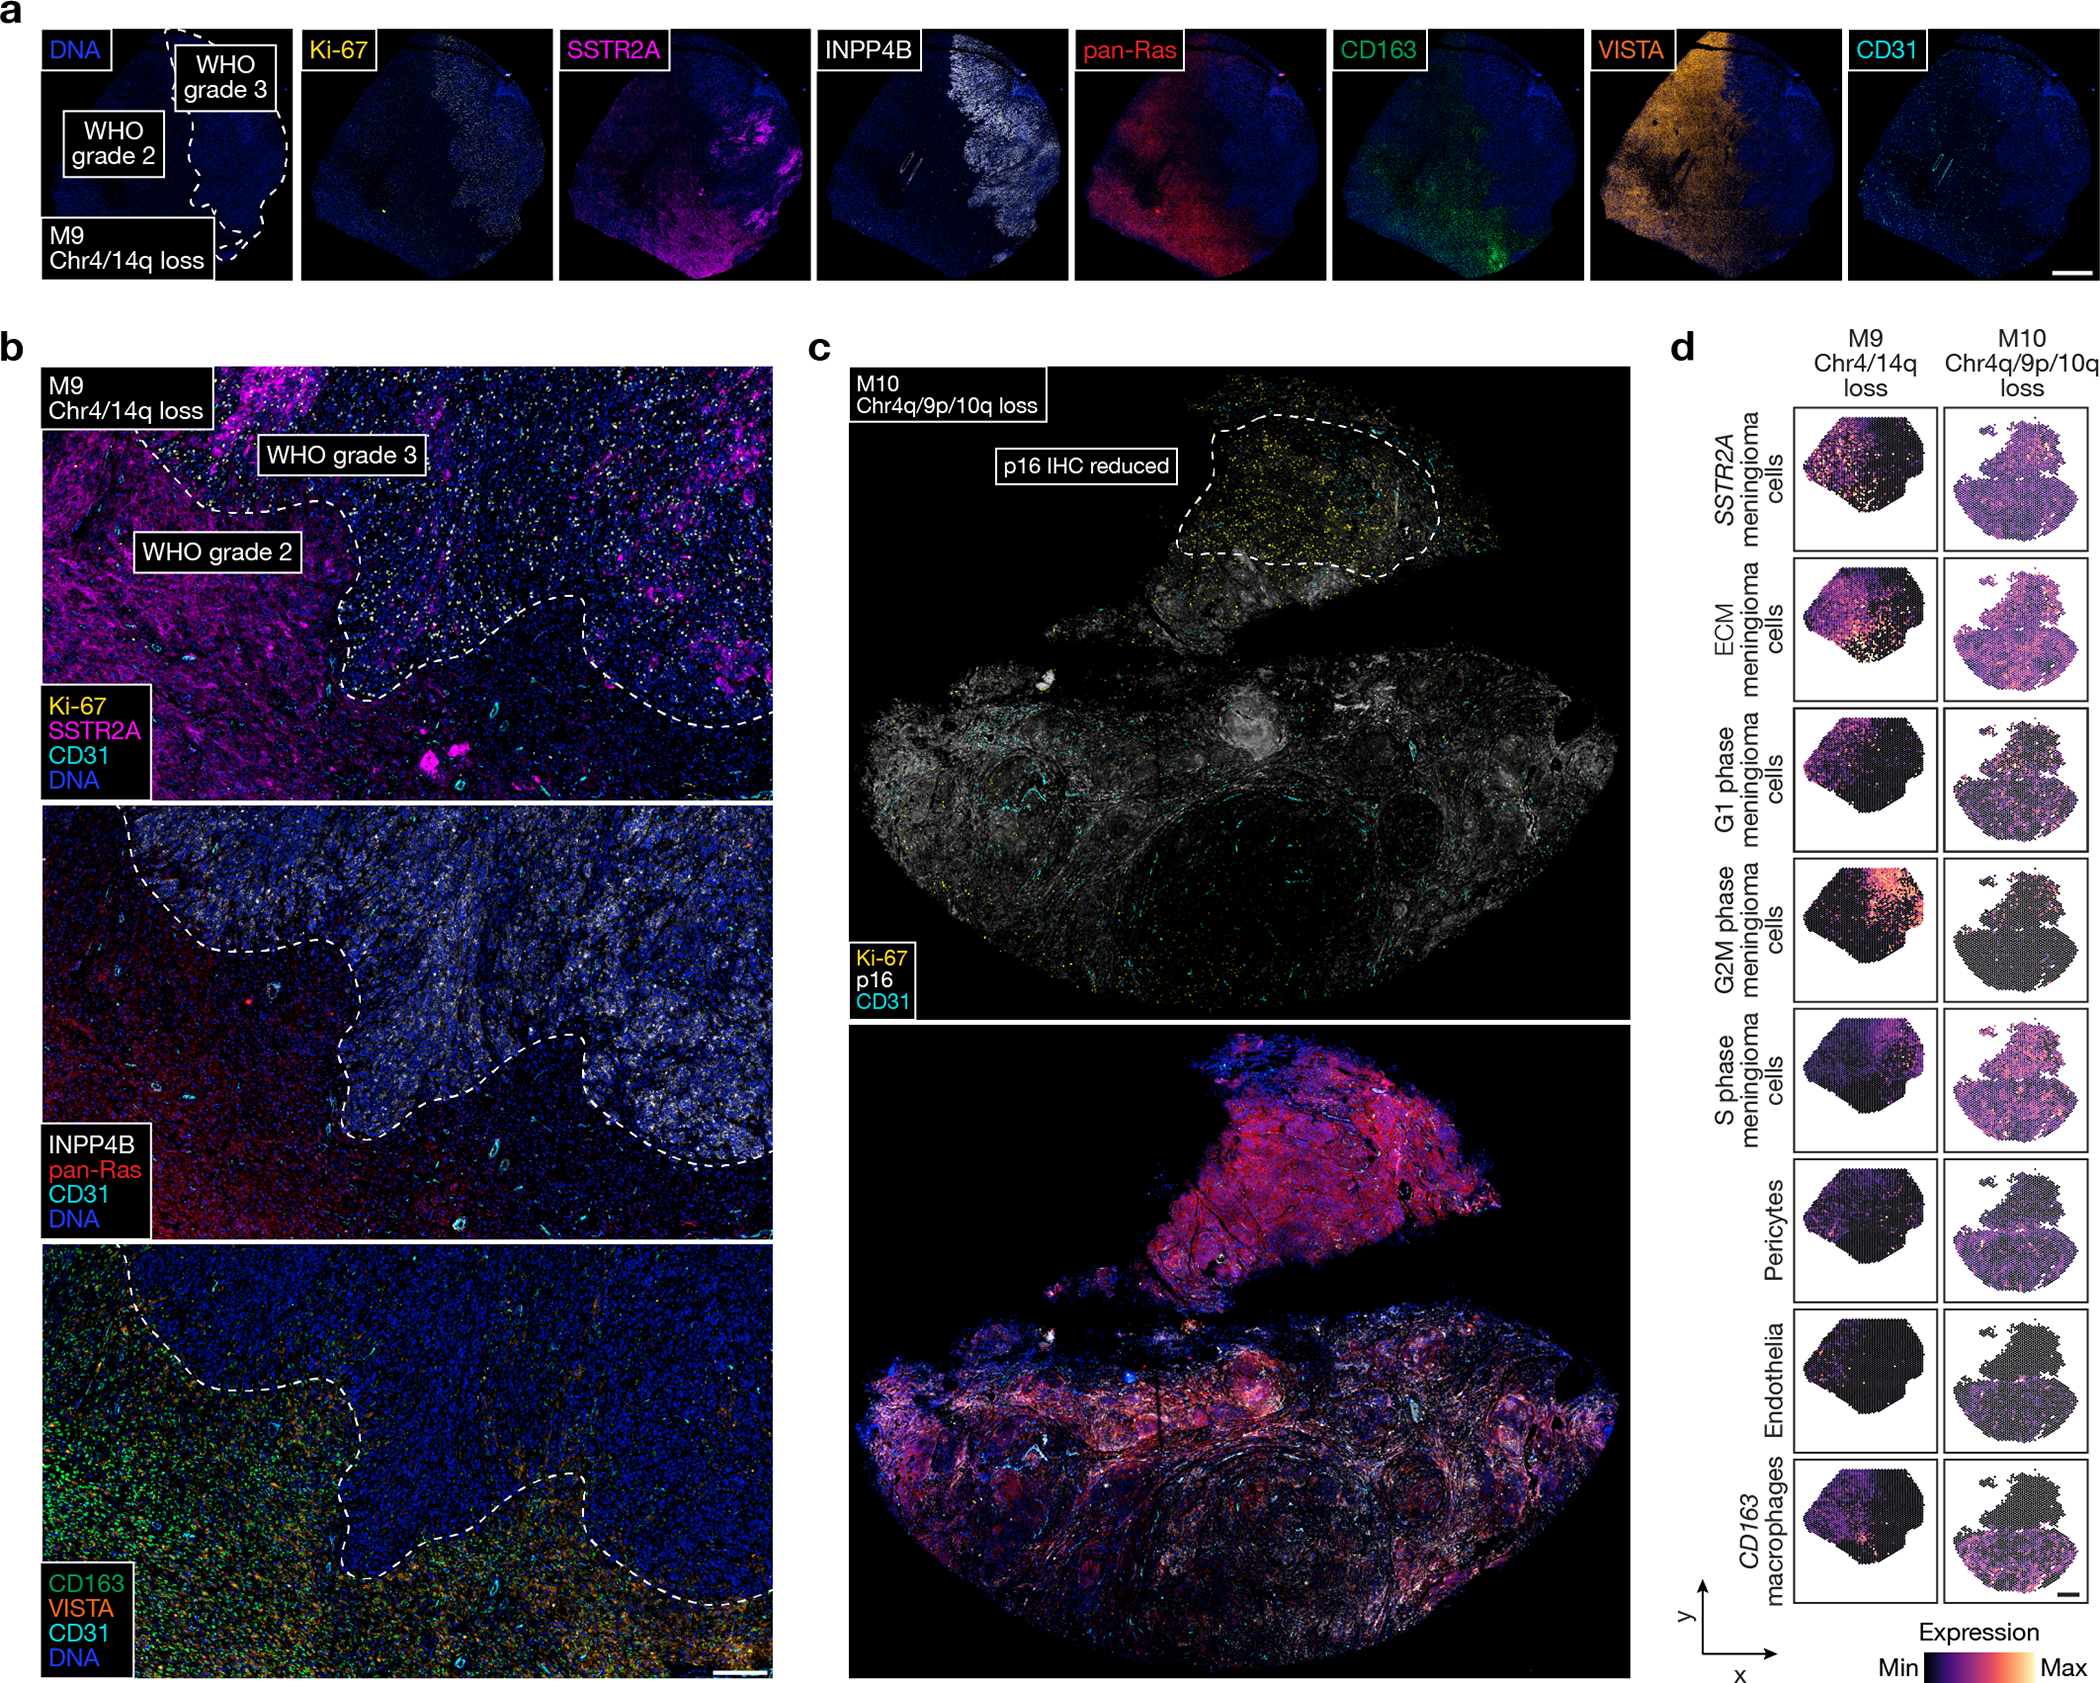
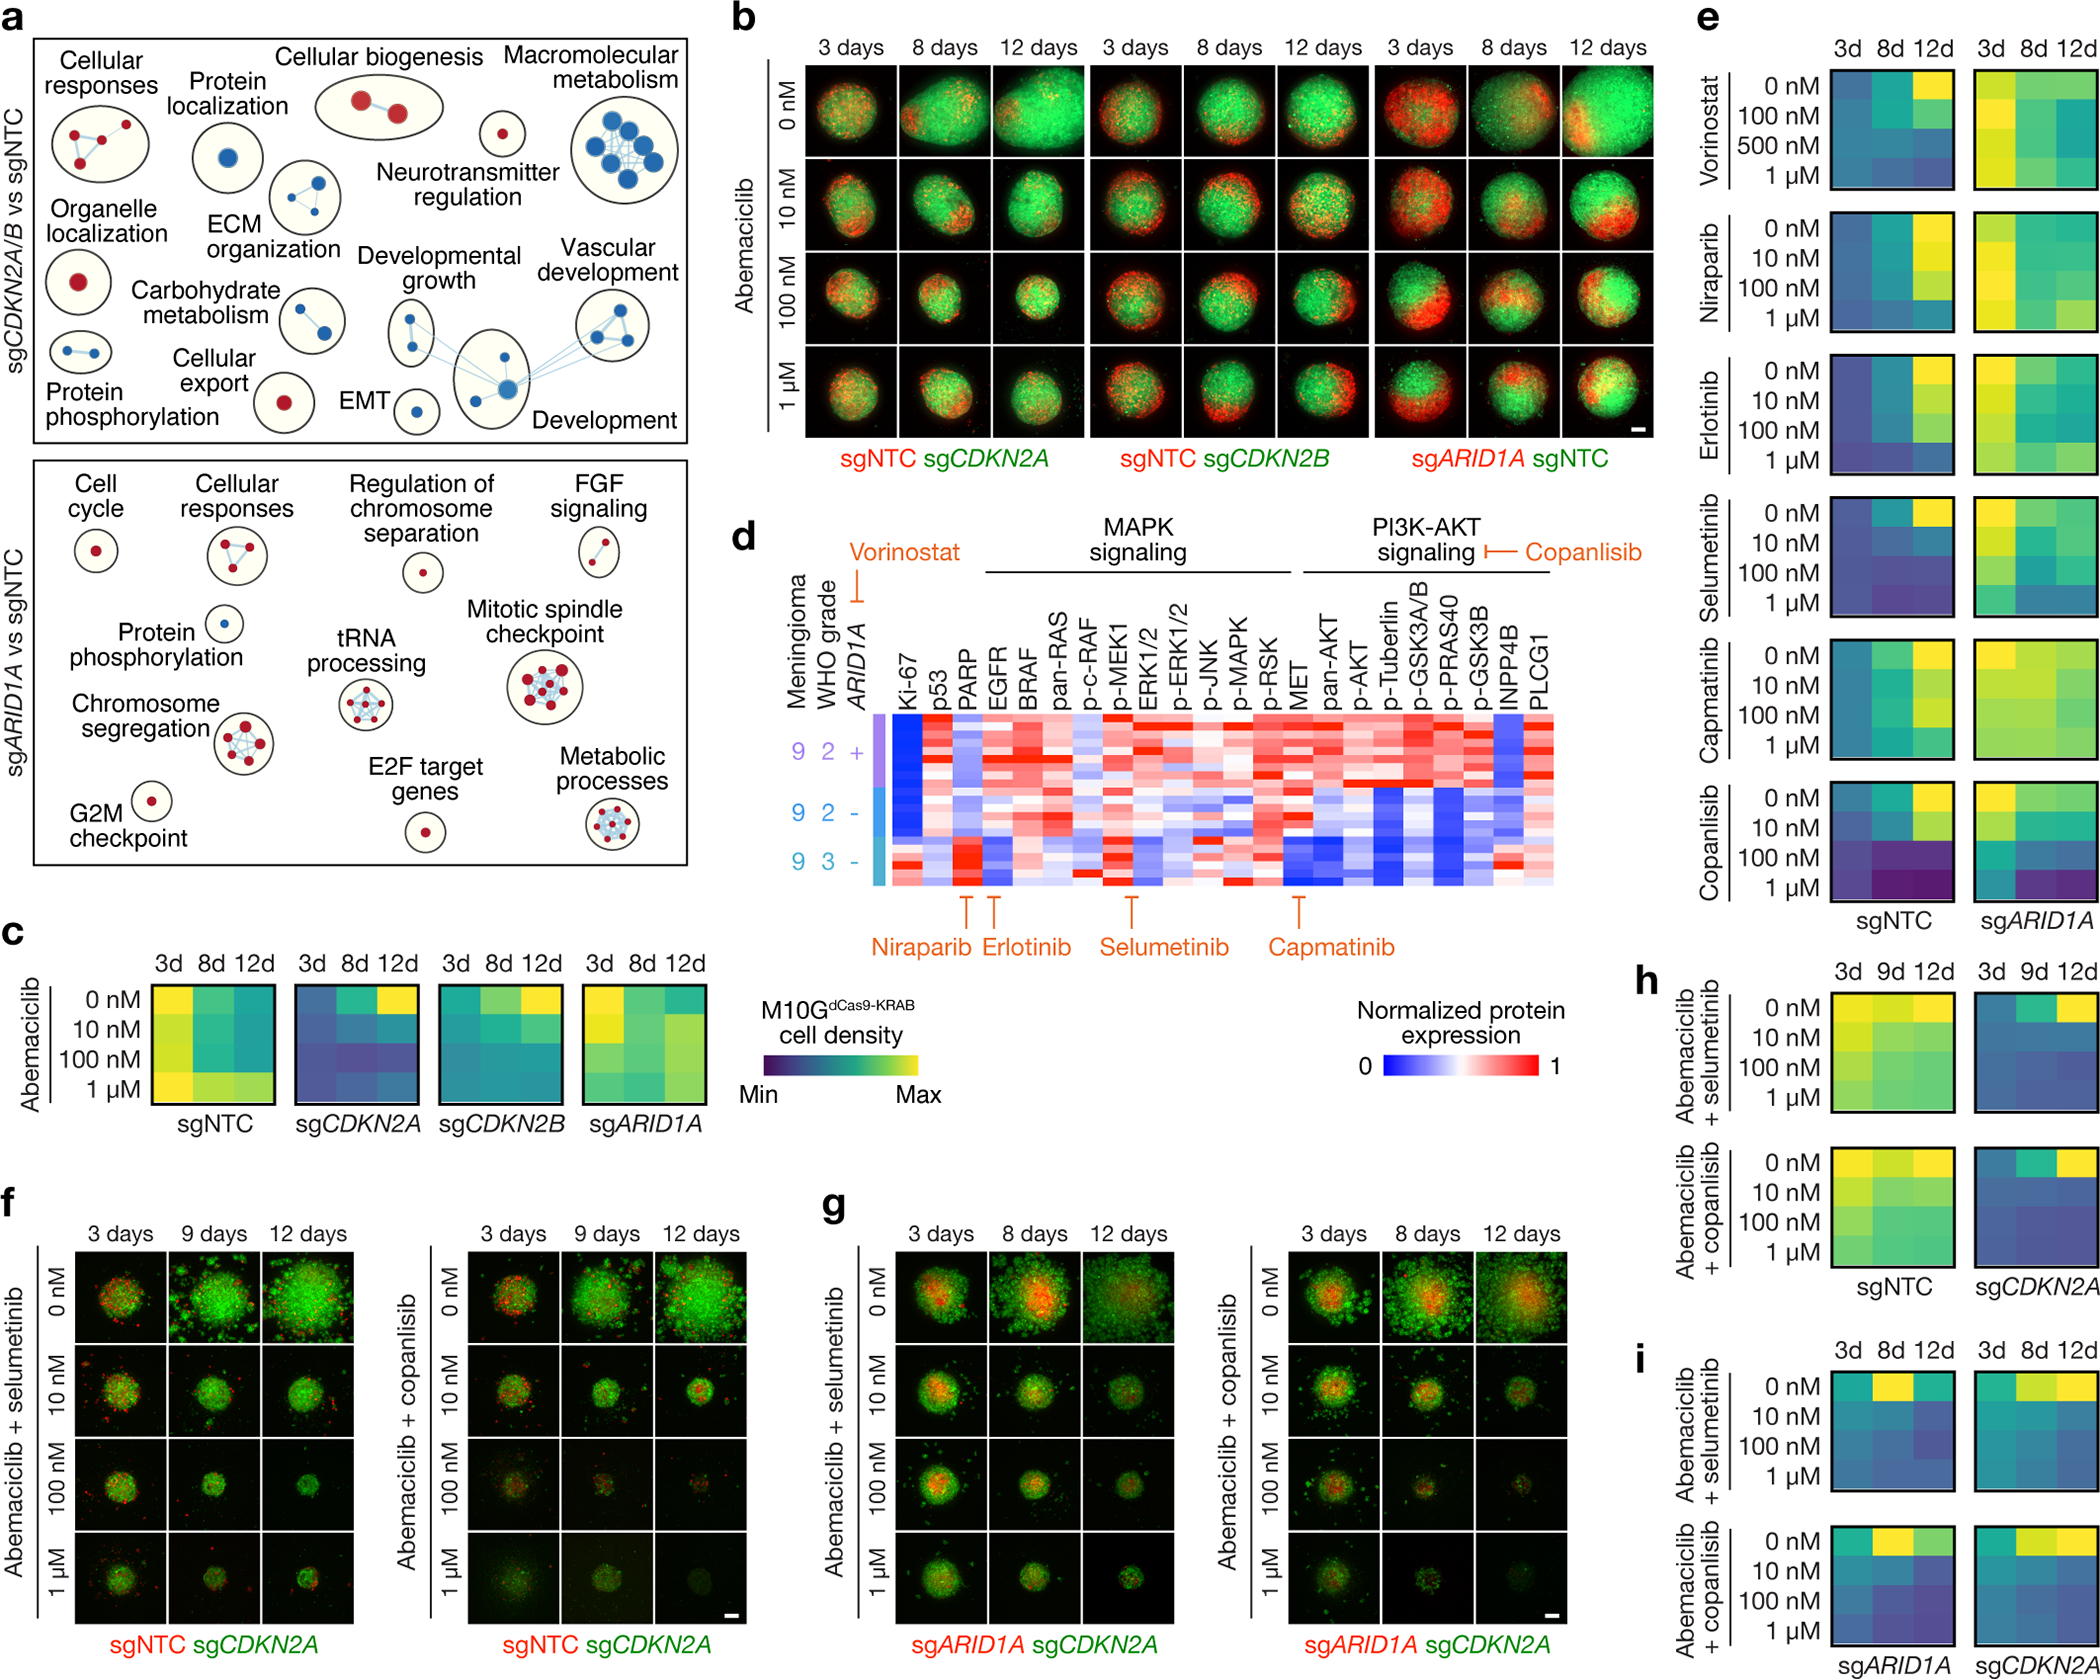
Intratumor heterogeneity underlies cancer evolution and treatment resistance, but targetable mechanisms driving intratumor heterogeneity are poorly understood. Meningiomas are the most common primary intracranial tumors and are resistant to all medical therapies, and high-grade meningiomas have significant intratumor heterogeneity. Here we use spatial approaches to identify genomic, biochemical and cellular mechanisms linking intratumor heterogeneity to the molecular, temporal and spatial evolution of high-grade meningiomas. We show that divergent intratumor gene and protein expression programs distinguish high-grade meningiomas that are otherwise grouped together by current classification systems. Analyses of matched pairs of primary and recurrent meningiomas reveal spatial expansion of subclonal copy number variants associated with treatment resistance. Multiplexed sequential immunofluorescence and deconvolution of meningioma spatial transcriptomes using cell types from single-cell RNA sequencing show decreased immune infiltration, decreased MAPK signaling, increased PI3K-AKT signaling and increased cell proliferation, which are associated with meningioma recurrence. To translate these findings to preclinical models, we use CRISPR interference and lineage tracing approaches to identify combination therapies that target intratumor heterogeneity in meningioma cell co-cultures.


Conflict of interest statement

Competing interests statement

The authors declare no competing interests.

Figures

Extended Data Fig. 1.
Extended Data Fig. 1.. Meningioma spatial transcriptome analysis.
a, Uniform manifold approximation and projection (UMAP) analysis of spatial transcriptomes from the 16 meningioma samples in this study shaded by unsupervised hierarchical clusters in each sample. b, Distribution of unsupervised hierarchical meningioma spatial transcriptome clusters overlayed onto H&E-stained sections of each sample. Scale bar, 1mm. c, UMAP analysis of meningioma spatial transcriptomes shaded by sample of origin without Harmony batch correction suggesting significant batch effects across meningioma spatial transcriptomes.
Extended Data Fig. 2.
Extended Data Fig. 2.. Meningioma spatial transcriptome clusters and spatial protein analysis.
a, Spatial transcriptomes in reduced dimensionality clusters from each meningioma sample after Harmony batch correction. b, Stacked bar showing spatial transcriptomes from each meningioma sample after Harmony batch correction. Colors as in a. c, Top 92 differentially expressed genes (Supplementary Table 4) across 30 unsupervised hierarchical spatial transcriptome clusters from all meningiomas after Harmony batch correction. d, Principal component (PC) analysis of spatial protein profiling from all meningioma samples (72 proteins, 82 regions).
Extended Data Fig. 3.
Extended Data Fig. 3.. High-grade meningiomas are distinguished by divergent intratumor gene and protein expression programs.
a, Preoperative T1 post-contrast magnetic resonance imaging (MRI) of meningiomas with driver mutations associated with adverse clinical outcomes, such as BAP1 loss (M1), CDKN2A/B loss (M2), or TERT promoter mutation (M3). b, Representative H&E-stained sections and immunohistochemistry (IHC) for Ki-67, p16, or H3K27me3 from M1–3. Scale bar, 1mm. c, Uniform manifold approximation and projection (UMAP) of M1–3 spatial transcriptomes after Harmony batch correction shaded by sample of origin. d, UMAP of M1–3 spatial transcriptomes after Harmony batch correction shaded by unsupervised hierarchical clusters. e, Distribution of unsupervised hierarchical spatial transcriptome clusters from M1–3 after Harmony batch correction.
Extended Data Fig. 4.
Extended Data Fig. 4.. WHO grade 1 meningiomas demonstrate reduced diversity and number of spatial transcriptomes compared to high-grade meningiomas.
a, Uniform manifold approximation and projection (UMAP) of M1–3 and LGM1–2 spatial transcriptomes after Harmony batch correction shaded by sample of origin. b, UMAP of M1–3 and LGM1–2 spatial transcriptomes after Harmony batch correction shaded by unsupervised hierarchical clusters. c, Distribution of unsupervised hierarchical spatial transcriptome clusters from M1–3 and LGM1–2 after Harmony batch correction. d, Top 101 differentially expressed genes across unsupervised hierarchical spatial transcriptome clusters from M1–3 and LGM1–2 after Harmony batch correction. e, Spatial transcriptome expression of MKI67, FOXM1, or CCN3 across M1–3 and LGM1–2. f, InferCNV traces of copy number variants across unsupervised hierarchical transcriptome clusters from M1–3 and LGM1–2 after Harmony batch correction, revealing no significant CNVs in C2 comprising LGM1, and relative loss of chromosomes 1p and 22q in C1 and C7 comprising LGM2. g, UMAP of LGM1–2 spatial transcriptomes after Harmony batch correction shaded by sample of origin. h, UMAP of LGM1–2 spatial transcriptomes after Harmony batch correction shaded by unsupervised hierarchical clusters. i, Spatial distribution of unsupervised hierarchical spatial transcriptome clusters from LGM1–2. Scale bar, 1mm. j, Distribution of unsupervised hierarchical spatial transcriptome clusters from LGM1–2 after Harmony batch correction. k, Top 116 differentially expressed genes across unsupervised hierarchical spatial transcriptome clusters from LGM1–2 after Harmony batch correction. l, Representative H&E morphology of spatial transcriptome clusters from LGM1 and LGM2. Colors correspond to spatial transcriptomes from h-j. Scale bars, 1mm and 10μm.
Extended Data Fig. 5.
Extended Data Fig. 5.. Primary and recurrent meningiomas are distinguished by divergent intratumor gene expression programs.
a, Representative H&E-stained sections and immunohistochemistry (IHC) for Ki-67, p16, or H3K27me3 from matched pairs of primary and recurrent meningiomas. Dots show regions of spatial protein profiling. Scale bar, 1mm. b, UMAP analysis of matched pairs of primary and recurrent meningioma spatial transcriptomes after Harmony batch correction shaded by unsupervised hierarchical clusters. Scale bar, 1mm. c, Spatial distribution of unsupervised hierarchical spatial transcriptome clusters from matched pairs of primary and recurrent meningiomas after Harmony batch correction. Scale bar, 1mm. d, Distribution of unsupervised hierarchical spatial transcriptome clusters from matched pairs of primary and recurrent meningiomas after Harmony batch correction.
Extended Data Fig. 6.
Extended Data Fig. 6.. Primary and recurrent meningiomas are distinguished by divergent copy number variants.
a, InferCNV traces of copy number variants across unsupervised hierarchical transcriptome clusters from matched pairs of primary and recurrent meningiomas after Harmony batch correction.
Extended Data Fig. 7.
Extended Data Fig. 7.. Regionally distinct meningiomas are distinguished by divergent intratumor gene and protein expression programs and copy number variants.
a, Preoperative T1 post-contrast magnetic resonance imaging (MRI) of meningioma M8 from patient 7, which was regionally distinct compared to M7 and M7’ (Fig. 3a). b, Representative H&E-stained sections and immunohistochemistry (IHC) for Ki-67, p16, or H3K27me3 from M8. Dots show regions of spatial protein profiling. Scale bar, 1mm. c, Principal component (PC) analysis of spatial protein profiling from M7, M7’, and M8. d, Uniform manifold approximation and projection (UMAP) of M7, M7’, and M8 spatial transcriptomes after Harmony batch correction shaded by sample of origin. e, UMAP of M7, M7’, and M8 spatial transcriptomes after Harmony batch correction shaded by unsupervised hierarchical clusters. f, Spatial distribution of unsupervised hierarchical spatial transcriptome clusters from M7, M7’, and M8 after Harmony batch correction. Scale bar, 1mm. g, Distribution of unsupervised hierarchical spatial transcriptome clusters from M7, M7’, and M8 after Harmony batch correction. h, Spatial distribution of unsupervised hierarchical transcriptome clusters harboring chromosome 10q loss in M8 from InferCNV (Fig. 3c). Scale bar, 1mm. i, InferCNV traces of copy number variants across unsupervised hierarchical transcriptome clusters from M8 after Harmony batch correction.
Extended Data Fig. 8.
Extended Data Fig. 8.. Primary and recurrent meningiomas are distinguished by divergent intratumor protein expression programs.
a and b, Principal component (PC) analysis of spatial protein profiling from matched pairs of primary and recurrent meningiomas. c, Spatial proteins from matched pairs of primary and recurrent meningiomas. d, Quantification of differentially expressed spatial proteins from at least 3 of 4 matched pairs of primary (M4 n=7, M5 n=6, M6 n=5, M7 n=3) and recurrent (M4’ n=2, M5’ n=4, M6’ n=3, M7’ n=4) meningiomas. Lines represent means and error bars represent standard error of the means. Student’s t tests, one-sided, *≤0.05, **p≤0.01, ***p≤0.0001. e, Multiplexed seqIF microscopy showing sparse lymphocytes in the meningioma microenvironment. Scale bar, 20μm, similar across 3 high-power field replicates per tumor.
Extended Data Fig. 9.
Extended Data Fig. 9.. High-grade meningiomas are distinguished by regionally distinct intratumor protein expression programs.
a, Preoperative T1 post-contrast magnetic resonance imaging (MRI) of meningiomas M9 and M10. b, Representative H&E-stained sections and immunohistochemistry (IHC) for Ki-67, p16, or H3K27me3 from regionally distinct meningioma samples. Dots show regions of spatial protein profiling. Scale bar, 1mm. c, Principal component (PC) analysis of spatial protein profiling from M9 and M10.
Extended Data Fig. 10.
Extended Data Fig. 10.. Validation of pharmacological strategies to overcome intratumor heterogeneity in high-grade meningiomas.
a, M10G patient-derived meningioma cells stably expressing CRISPRi machinery (dCas9-KRAB) and sgRNAs suppressing CDKN2A (sgCDKN2A, n=3), CDKN2B (sgCDKN2B, n=4), ARID1A (sgARID1A, n=6), or non-targeted control sgRNAs (sgNTC, n=3, 4, 6, respectively). Cells were labeled with red or green fluorescence proteins and integrated into 3D co-cultures for pharmacologic and live cell imaging experiments. b, IOMM-Lee meningioma cells that lack endogenous CDKN2A/B stably expressing CRISPRi machinery (dCas9-Zim3) and sgARID1A (n=4) or sgNTC (n=4). Cells were labeled with red or green fluorescence proteins and integrated into 3D co-cultures for pharmacologic and live cell imaging experiments. c, Combination molecular therapy treatments of 3D co-cultures of IOMM-LeedCas9-Zim3 meningioma cells expressing sgARID1A or sgNTC. Scale bar, 100μm. d, Quantification of combination molecular therapy treatments of 3D co-cultures of IOMM-LeedCas9-Zim3 meningioma cells expressing sgARID1A or sgNTC. Representative of 8 biological replicates per condition. e, MTT cell viability results normalized to vehicle control after 5 days of molecular therapy of SF12964, a patient-derived meningioma cell line from a WHO grade 3 meningioma (Hypermitotic DNA methylation group, NF2 p.Q165* mutation, chromosome 1p and 22q deletion, CDKN2A/B homozygous deletion, chromosome 1q amplification) that underwent reoperation after 5 months of abemaciclib treatment following prior surgeries and prior radiotherapy treatments. Representative of 8 biological replicates per condition. Lines represent means and error bars represent standard error of the means. Student’s t tests, one-sided, **p≤0.01, ***p≤0.0001.
Fig. 1.
Fig. 1.. Experimental design and workflow.
a, 16 high-grade meningioma samples from 10 meningiomas that were resected from 9 patients were analyzed using comprehensive histologic, immunohistochemical, and bulk and spatial bioinformatic techniques, including spatial transcriptomics, spatial protein profiling, multiplexed sequential immunofluorescence microscopy, and spatial deconvolution of meningioma single-cell RNA sequencing. Results were validated using RNA sequencing from 502 meningiomas, and CRISPR interference, pharmacology, and live cell imaging of meningioma 3D co-culture models. Scale bars, 1mm for meningiomas and 100μm for meningioma 3D co-cultures. b, Oncoprint comprised of the clinical, histologic, genetic, epigenetic, and gene expression features of the meningioma samples in this study. c, Uniform manifold approximation and projection (UMAP) of 38,718 meningioma spatial transcriptomes after Harmony batch correction shaded by sample of origin. d, UMAP of meningioma spatial transcriptomes after Harmony batch correction shaded by unsupervised hierarchical clusters. e, Heatmap of meningioma spatial protein profiling comprised of 72 proteins from 82 regions revealing significant inter- and intratumor heterogeneity. Sub-analyses of protein profiling across high-grade meningiomas based on this heatmap and Supplementary Table 5 are provided in Fig. 2k, 4a, 7d, and Extended Data Fig. 8c.
Fig. 2.
Fig. 2.. High-grade meningiomas are distinguished by divergent intratumor gene and protein expression programs.
Spatial transcriptomics and protein profiling of meningiomas 1–3 (M1–3) with driver mutations associated with adverse clinical outcomes, such as BAP1 loss (M1), CDKN2A/B loss (M2), or TERT promoter mutation (M3). a, M1 H&E-stained section showing regions of spatial protein profiling. Scale bar, 1mm. b, Spatial distribution of unsupervised hierarchical spatial transcriptome clusters from M1. Insert shows Uniform manifold approximation and project (UMAP) analysis of M1 spatial transcriptomes. Scale bar, 1mm. c, Representative H&E morphology and Ki-67 immunohistochemistry (IHC) of spatial transcriptome clusters from M1. Colors correspond to spatial transcriptomes from b. Scale bar, 10μm. d, Spatial distribution and expression of MKI67 or FOXM1 transcripts from M1. Scale bar, 1mm. e, Top 119 differentially expressed genes across unsupervised hierarchical spatial transcriptome clusters from M1. f, M2 (left) or M3 (right) H&E-stained sections showing regions of spatial protein profiling. Scale bar, 1mm. g, Spatial distribution of unsupervised hierarchical spatial transcriptome clusters from M2 (left) or M3 (right). Inserts show UMAP analyses of M2 or M3 spatial transcriptomes. Scale bar, 1mm. h, Representative H&E morphology and Ki-67 IHC of spatial transcriptome clusters from M2 (top) or M3 (bottom). Colors correspond to spatial transcriptomes from g. Scale bar, 10μm. i, Top differentially expressed genes across unsupervised hierarchical spatial transcriptome clusters from M2 (top, 115 genes) or M3 (bottom, 110 genes). j, Principal component (PC) analysis of spatial protein profiling from M1–3. k, Differentially expressed spatial proteins from M1–3 (all with Student’s t test, one-sided, p≤0.05 for head-to-head comparisons of one meningioma to at least one other meningioma).
Fig 3.
Fig 3.. Spatial expansion of sub-clonal copy number variants underlies high-grade meningioma recurrence.
Spatial transcriptomics and protein profiling of matched pairs of primary and recurrent meningiomas from patients 4–7 (M4 and M4’, M5 and M5’, M6 and M6’, and M7 and M7’). a, Preoperative T1 post-contrast magnetic resonance imaging (MRI) of matched pairs of primary (blue, M4, M5, M6, M7) and recurrent (red, M4’, M5’, M6’, M7’) meningiomas. b, UMAP analysis of matched pairs of primary and recurrent meningioma spatial transcriptomes after Harmony batch correction. Scale bar, 1mm. c, Spatial distribution of unsupervised hierarchical spatial transcriptome clusters harboring divergent copy number variants from InferCNV. Scale bar, 1mm. d, Spatial distribution of differentially expressed genes associated with copy number variants across matched pairs of primary and recurrent meningiomas. Scale bar, 1mm.
Fig. 4.
Fig. 4.. Decreased immune infiltration, decreased MAPK signaling, increased PI3K-AKT signaling, and increased cell proliferation underlie high-grade meningioma recurrence.
a, Differentially expressed spatial proteins from M4–7’ (all with Student’s t test, one-sided, p≤0.05 for at least 3 of 4 primary versus recurrent meningioma comparisons). b, Representative image of multiplexed seqIF microscopy showing intratumor heterogeneity of signaling mechanisms and cell types in the region of M9 with WHO grade 2 (left) and WHO grade 3 (right) histology, as well as ARID1A and Chr4/14q loss. Scale bar, 1mm, single low power field provided. c, Multiplexed seqIF microscopy showing temporal evolution of signaling mechanisms and cell types in primary versus recurrent meningiomas. Images from M4 and M4’ that are representative of matched pairs of primary and recurrent meningiomas from patients 4–7 (M4 and M4’, M5 and M5’, M6 and M6’, and M7 and M7’). Scale bar, 100μm, similar across 3 high-power field replicates per tumor. d, Spatial deconvolution of meningioma single-cell RNA sequencing showing temporal evolution of cell types from matched pairs of primary (blue) and recurrent (red) meningiomas. Scale bar, 1mm.
Fig 5.
Fig 5.. Regionally distinct sub-clonal spatial transcriptomes underlie histological heterogeneity in high-grade meningioma.
a, Ki-67 immunohistochemistry (IHC) of regionally distinct samples from M9 demonstrating heterogeneous histological (WHO grade 2 or 3), mutational (ARID1A, ASXL1), and cytogenetic (chromosome 4, 14q) features (Fig. 1b). b, p16 IHC of regionally distinct samples from M10 demonstrating heterogeneous histological (p16, Ki-67) and cytogenetic (chromosome 1q, 4q, 9p, 10q) features (Fig. 1b). c, UMAP analysis of M9 spatial transcriptomes after Harmony batch correction shaded by region of origin (left) or unsupervised hierarchical clusters (right). Scale bar, 1mm. d, UMAP analysis of M10 spatial transcriptomes after Harmony batch correction shaded by region of origin (left) or unsupervised hierarchical clusters (right). Scale bar, 1mm. e, Spatial distribution of unsupervised hierarchical spatial transcriptome clusters from M9 after Harmony batch correction. Scale bar, 1mm. f, Spatial distribution of unsupervised hierarchical spatial transcriptome clusters from M10 after Harmony batch correction. Scale bar, 1mm. g, Distribution of unsupervised hierarchical spatial transcriptome clusters from M9 after Harmony batch correction. Spatial transcriptome clusters correlating with WHO grade 3 histology are annotated. h, Top 89 differentially expressed genes across unsupervised hierarchical spatial transcriptome clusters from M9. I, Spatial distribution of differentially expressed genes associated with histological variability across regionally distinct samples from M9. Scale bar, 1mm. j, Distribution of unsupervised hierarchical spatial transcriptome clusters from M10 after Harmony batch correction. k, Top 110 differentially expressed genes across unsupervised hierarchical spatial transcriptome clusters from M10. l, Spatial distribution of differentially expressed genes associated with histological variability across regionally distinct samples from M10. Scale bar, 1mm.
Fig. 6.
Fig. 6.. High-grade meningiomas are distinguished by regionally distinct intratumor immune infiltration, MAPK signaling, PI3K-AKT signaling, and cell proliferation.
a, Multiplexed seqIF microscopy showing intratumor heterogeneity of signaling mechanisms and cell types in the region of M9 with WHO grade 2 (left) and WHO grade 3 (right) histology, as well as ARID1A and Chr4/14q loss. Scale bar, 1mm. b, Multiplexed seqIF microscopy showing M9 from a at higher magnification. Scale bar, 200μmm, similar across 3 high-power field replicates. c, Multiplexed seqIF microscopy showing intratumor heterogeneity of signaling mechanisms in the region of M10 with reduced immunostaining for p16 (top) and Chr4q/9p/10q loss. Scale bar, 1mm, single low power field provided. d, Spatial deconvolution of meningioma single-cell RNA sequencing showing spatial evolution of cell types from in M9 in a and b (left) or M10 in c (right). Scale bar, 1mm.
Fig 7.
Fig 7.. A preclinical platform for testing personalized systemic therapies to overcome intratumor heterogeneity in high-grade meningiomas.
a, Network of gene circuits distinguishing M10GdCas9-KRAB meningioma cells expressing sgNTC (n=3), sgCDKN2A (n=3), sgCDKN2B (n=3), or sgARID1A (n=3) using RNA sequencing. Nodes represent pathways and edges represent shared genes between pathways (p≤0.05, FDR≤0.05). Red nodes are enriched and blue nodes are suppressed in experimental versus sgNTC control conditions. b, Abemaciclib treatments of 3D co-cultures of M10GdCas9-KRAB meningioma cells expressing sgNTC, sgCDKN2A, sgCDKN2B, or sgARID1A. Scale bar, 100μm. c, Quantification of abemaciclib treatments of 3D co-cultures of M10GdCas9-KRAB meningioma cells expressing sgNTC, sgCDKN2A, sgCDKN2B, or sgARID1A. Representative of 8–10 biological replicates per condition. d, Differentially expressed spatial proteins from M9 (all with Student’s t test, one-sided, p≤0.05 for at least 2 of 3 regionally distinct comparisons). e, Quantification of molecular therapy treatments of 3D co-cultures of M10GdCas9-KRAB meningioma cells expressing sgNTC or sgARID1A. Representative of 8–10 biological replicates per condition. Scale from c. f, Combination molecular therapy treatments of 3D co-cultures of M10GdCas9-KRAB meningioma cells expressing sgCDKN2A or sgNTC. Scale bar, 100μm. g, Combination molecular therapy treatments of 3D co-cultures of M10GdCas9-KRAB meningioma cells expressing sgCDKN2A or sgARID1A. Scale bar, 100μm. h, Quantification of combination molecular therapy treatments of 3D co-cultures of M10GdCas9-KRAB meningioma cells expressing sgCDKN2A or sgNTC. Representative of 8 biological replicates per condition. Scale from c. i, Quantification of combination molecular therapy treatments of 3D co-cultures of M10GdCas9-KRAB meningioma cells expressing sgCDKN2A or sgARID1A. Representative of 8 biological replicates per condition. Scale from c.

Update of

References

    1. Ostrom QT et al. CBTRUS Statistical Report: Primary Brain and Other Central Nervous System Tumors Diagnosed in the United States in 2015–2019. Neuro-oncology 24, v1–v95 (2022). - PMC - PubMed
    1. Goldbrunner R et al. EANO guideline on the diagnosis and management of meningiomas. Neuro-oncology 23, 1821–1834 (2021). - PMC - PubMed
    1. Lin D et al. Trends in intracranial meningioma incidence in the United States, 2004–2015. Cancer Med-us 8, 6458–6467 (2019). - PMC - PubMed
    1. Sahm F et al. DNA methylation-based classification and grading system for meningioma: a multicentre, retrospective analysis. Lancet Oncol. (2017) doi:10.1016/s1470-2045(17)30155-9. - DOI - PubMed
    1. Olar A et al. Global epigenetic profiling identifies methylation subgroups associated with recurrence-free survival in meningioma. Acta Neuropathol 133, 431–444 (2017). - PMC - PubMed

Methods-only references

    1. Zhou W, Triche TJ, Laird PW & Shen H SeSAMe: reducing artifactual detection of DNA methylation by Infinium BeadChips in genomic deletions. Nucleic Acids Res. 46, e123 (2018). - PMC - PubMed
    1. DOI: 10.5281/zenodo.10927737 - DOI