Comparative Study
. 2024 May 17;25(1):123.
doi: 10.1186/s13059-024-03250-6.

Comparative 3D genome analysis between neural retina and retinal pigment epithelium reveals differential cis-regulatory interactions at retinal disease loci

Affiliations
Comparative Study

Comparative 3D genome analysis between neural retina and retinal pigment epithelium reveals differential cis-regulatory interactions at retinal disease loci

Eva D'haene et al. Genome Biol. .

Abstract

Background: Vision depends on the interplay between photoreceptor cells of the neural retina and the underlying retinal pigment epithelium (RPE). Most genes involved in inherited retinal diseases display specific spatiotemporal expression within these interconnected retinal components through the local recruitment of cis-regulatory elements (CREs) in 3D nuclear space.

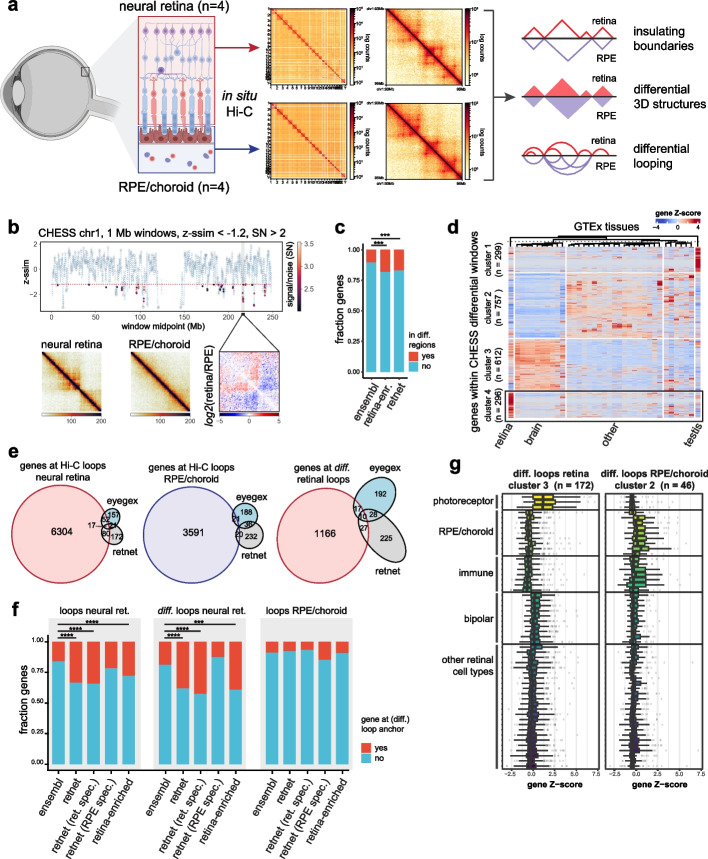
Results: To understand the role of differential chromatin architecture in establishing tissue-specific expression at inherited retinal disease loci, we mapped genome-wide chromatin interactions using in situ Hi-C and H3K4me3 HiChIP on neural retina and RPE/choroid from human adult donor eyes. We observed chromatin looping between active promoters and 32,425 and 8060 candidate CREs in the neural retina and RPE/choroid, respectively. A comparative 3D genome analysis between these two retinal tissues revealed that 56% of 290 known inherited retinal disease genes were marked by differential chromatin interactions. One of these was ABCA4, which is implicated in the most common autosomal recessive inherited retinal disease. We zoomed in on retina- and RPE-specific cis-regulatory interactions at the ABCA4 locus using high-resolution UMI-4C. Integration with bulk and single-cell epigenomic datasets and in vivo enhancer assays in zebrafish revealed tissue-specific CREs interacting with ABCA4.

Conclusions: Through comparative 3D genome mapping, based on genome-wide, promoter-centric, and locus-specific assays of human neural retina and RPE, we have shown that gene regulation at key inherited retinal disease loci is likely mediated by tissue-specific chromatin interactions. These findings do not only provide insight into tissue-specific regulatory landscapes at retinal disease loci, but also delineate the search space for non-coding genomic variation underlying unsolved inherited retinal diseases.

Keywords: ABCA4; Cis-regulatory element (CRE); 3D genome structure; Enhancer assay; Hi-C; HiChIP; Inherited retinal disease (IRD); Neural retina; Retinal pigment epithelium (RPE); UMI-4C.


Conflict of interest statement

The authors declare that they have no competing interests.

Figures

Fig. 1
Fig. 1
Comparative Hi-C analysis between human neural retina and RPE/choroid. a Generation of tissue-specific 3D contact matrices using in situ Hi-C on adult human donor neural retina and RPE/choroid samples (n = 4) and strategy for comparative 3D genome analysis. b Results of CHESS comparative analysis between the neural retina and RPE/choroid Hi-C contact matrices (z-ssim similarity scores obtained for chromosome 1 using 1-Mb window sizes, z-ssim <  − 1.2, signal/noise (SN) > 2). c Enrichment of retina-enriched genes from the EyeGEx database and RetNet IRD genes compared to Ensembl genes within CHESS differential regions (Fisher’s exact test, p = 0.000273 and p = 0.000658 respectively). d Clustered heatmap of genes within CHESS differential windows using GTEx tissue expression data. e Overlap between genes at (differential) Hi-C loop anchors identified in neural retina and RPE/choroid and EyeGEx retina-enriched genes and RetNet IRD genes. f Enrichment of RetNet IRD genes, retina-specific IRD genes, RPE/choroid-specific IRD genes, and retina-enriched genes from the EyeGEx database compared to Ensembl genes at Hi-C loops in neural retina (Fisher’s exact test, p = 4.312e − 13, p = 4.875e − 12, p = 0.2024 and p = 0.0001 respectively), differential Hi-C loops in the neural retina (Fisher’s exact test, p = 1.149e − 05, p = 1.254e − 06, p = 0.7515 and p = 3.826e − 13 respectively) and Hi-C loops in RPE/choroid (Fisher’s exact test, p = 0.4705, p = 0.2559, p = 0.0991 and p = 0.8237 respectively). g Single-cell RNA expression within adult human retina of clusters of genes identified at differential loops in neural retina and RPE/choroid. The figure in panel a was partly created using BioRender
Fig. 2
Fig. 2
Differential promoter looping between human neural retina and RPE/choroid. a Proportion of differential promoter-associated loops (at 5-kb resolution) in human neural retina (red) and RPE/choroid (blue) according to FitHiChIP (FDR < 0.05). b Aggregate peak analysis centered at HiChIP loops specific of neural retina, RPE/choroid, and stable loops. c Enrichment of RetNet IRD genes, retina-specific RetNet genes, RPE/choroid-specific RetNet genes, and retina-enriched genes from the EyeGEx database within genes specifically contacted in the neural retina (right; Fisher’s exact test, p = 7.713e − 06, p = 2.042e − 07, p = 0.8979, and p = 4.382e − 10, respectively) and RPE/choroid (left; Fisher’s exact test, p = 0.4856, p = 0.1584, p = 0.3647, and p = 0.0046, respectively). d Top-10 enriched GO Biological Process terms associated with differentially HiChIP-contacted promoters in neural retina and RPE/choroid. e Genomic tracks showing the 3D chromatin configuration of the RHO gene locus. For both tissues, HiChIP contact matrices, differential loops, and HiChIP-derived H3K4me3 ChIP-seq signals are represented from top to bottom. f Virtual 4C contact frequencies (viewpoints indicated by a green line) for all genes within the RHO locus derived from the neural retina and RPE/choroid binned HiChIP counts
Fig. 3
Fig. 3
The impact of differential 3D genomic interactions at retinal disease loci. a Number of inherited retinal disease (IRD) genes associated with differential interactions in neural retina vs. RPE/choroid through Hi-C differential regions (CHESS) or loops and HiChIP differential loops. b Single-cell RNA expression per cell type within the adult human retina of two clusters of IRD genes associated with differential interactions. Cell types: rod, L/M cone, S cone, retinal pigment epithelium (RPE), pericyte (PER), fibroblast (FB), endothelial (END), melanocyte (CM), T-cell, microglia (uG), monocyte (MO), mast cell (MAST), ON bipolar (DBC), rod bipolar (RBC), OFF bipolar (HBC), Müller cell (MC), GABA amacrine (ACB), horizontal cell (HC), GLY amacrine (ACY), astrocyte (AST), ganglion cell (GC). c Differential 3D interactions at the CFH and CRB1 locus. d Differential 3D interactions at the MAK locus. e Single-cell RNA expression of genes within highlighted loci in adult human retina (periphery) averaged per cell type group
Fig. 4
Fig. 4
Characterization of the ABCA4 cis-regulatory landscape in human retina. a ABCA4 promoter interaction frequencies using UMI-4C in human neural retina and RPE/choroid from retinal donors (n = 3, interacting regions (IRs) indicated 1–12). Candidate cis-regulatory elements (cCREs) within IRs were identified using publicly available epigenomic data from human retina: ATAC-seq from bulk retina and scATAC-seq from photoreceptor cells; ChIP-seq for histone marks H3K27ac and H3K4me2, retinal transcription factors (TFs) (CRX, OTX2, and NRL) and the architectural protein CTCF. Epigenomic data for RPE/choroid included bulk ATAC-seq and ChIP-seq targeting H3K27ac and CTCF. All these data were integrated to finely map cCREs. b Close-up of the cCREs including the above-described datasets; retinal TF binding (CRX, OTX2, NRL, RORB, and MEF2D); and sequence motifs (Jaspar Core Pred. TFBS 2022) for TFs expressed in photoreceptors (i.e., MEIS1, NRL, NR2E3, OTX2, CRX, MEIS2, MEF2D, RORB, RXRG, SMAD2 and NEUROD1); and the TFs expressed in RPE (CRX, KLF4, KLF9, LHX2, MEIS1, MEIS2, OTX2, RORB, SMAD2, STAT5B, TEAD1, and TEAD3). c Overview of in vivo enhancer assays using zebrafish stable transgenic lines; dot plot (left) indicating in which tissues GFP + reporter expression was observed (retina, RPE, and lens, white arrows). d Overview of in vivo enhancer assays for the cCRE1–5 synthetic construct through transient transgenesis in zebrafish; bar plots (top) indicating the frequency of GFP + tissues (retina, pineal gland, lens, forebrain, heart, and nosepit) among total GFP + embryos at 1, 2, 3, and 4 days post-fertilization (dpf); example of reporter expression in retina and pineal gland at 3 and 4 dpf

References

    1. Wright AF, Chakarova CF, Abd El-Aziz MM, Bhattacharya SS. Photoreceptor degeneration: genetic and mechanistic dissection of a complex trait. Nat Rev Genet. 2010;11:237–284. doi: 10.1038/nrg2717. - DOI - PubMed
    1. Letelier J, Bovolenta P, Martínez-Morales JR. The pigmented epithelium, a bright partner against photoreceptor degeneration. J Neurogenet. 2017;31:203–215. doi: 10.1080/01677063.2017.1395876. - DOI - PubMed
    1. Cowan CS, et al. Cell types of the human retina and its organoids at single-cell resolution. Cell. 2020;182:1623–1640.e34.. doi: 10.1016/j.cell.2020.08.013. - DOI - PMC - PubMed
    1. Cherry TJ, et al. Mapping the cis-regulatory architecture of the human retina reveals noncoding genetic variation in disease. Proc Natl Acad Sci U S A. 2020;117:9001–9012. doi: 10.1073/pnas.1922501117. - DOI - PMC - PubMed
    1. Moore JE, et al. Expanded encyclopaedias of DNA elements in the human and mouse genomes. Nature. 2020;583:699–710. doi: 10.1038/s41586-020-2493-4. - DOI - PMC - PubMed

Publication types

Substances