. 2024 May 17;14(1):63.
doi: 10.1186/s13578-024-01245-1.

Methylmalonic acidemia triggers lysosomal-autophagy dysfunctions

Affiliations

Methylmalonic acidemia triggers lysosomal-autophagy dysfunctions

Michele Costanzo et al. Cell Biosci. .

Abstract

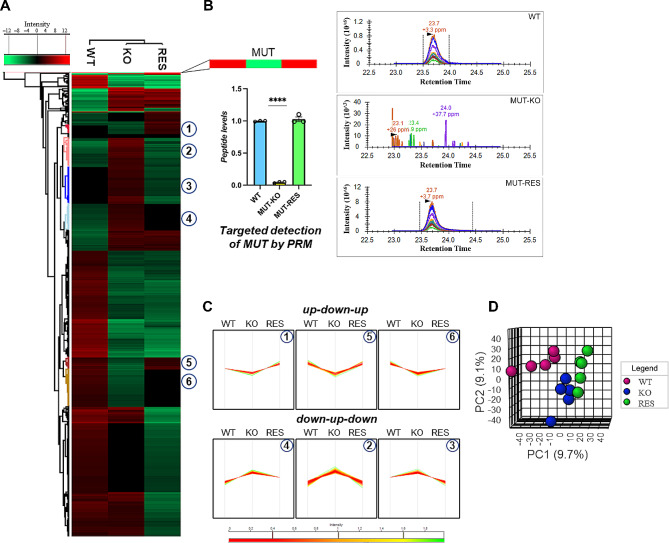
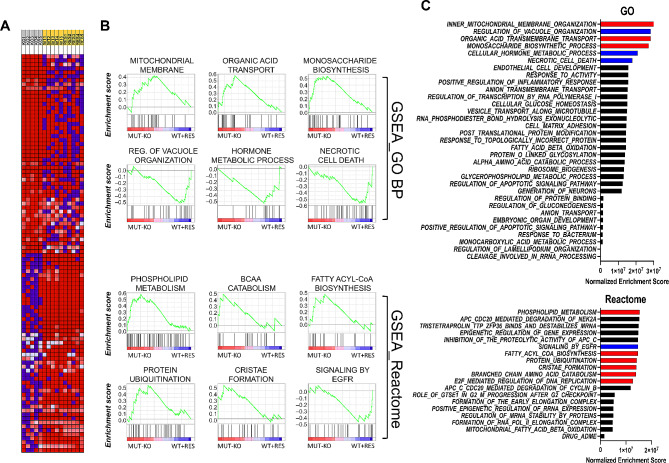
Background: Methylmalonic acidemia (MMA) is a rare inborn error of propionate metabolism caused by deficiency of the mitochondrial methylmalonyl-CoA mutase (MUT) enzyme. As matter of fact, MMA patients manifest impairment of the primary metabolic network with profound damages that involve several cell components, many of which have not been discovered yet. We employed cellular models and patients-derived fibroblasts to refine and uncover new pathologic mechanisms connected with MUT deficiency through the combination of multi-proteomics and bioinformatics approaches.

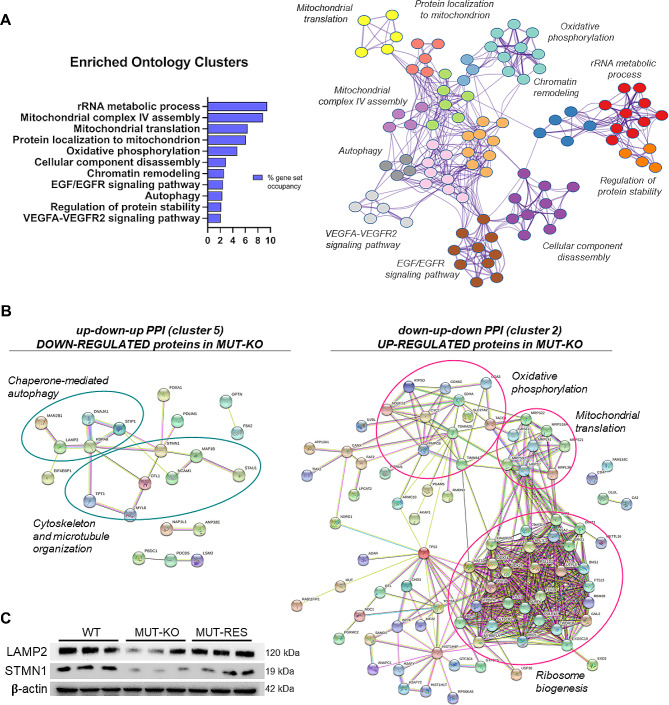
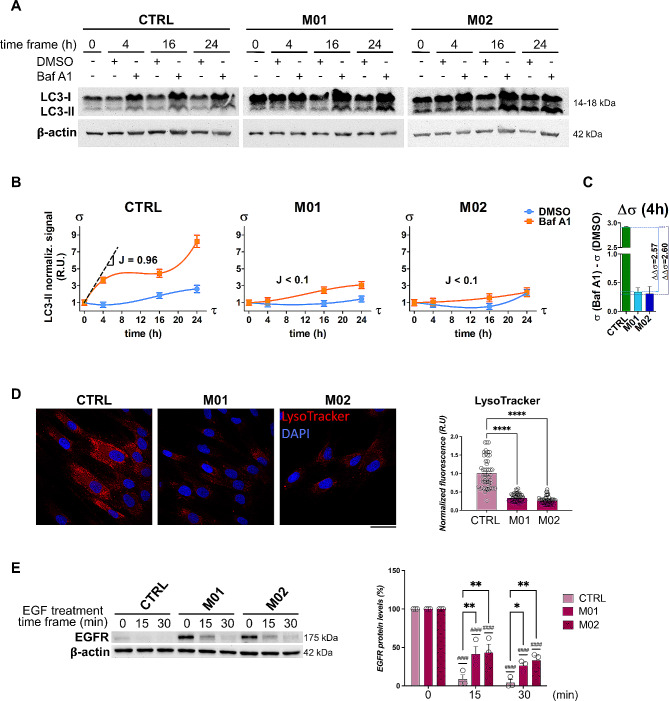
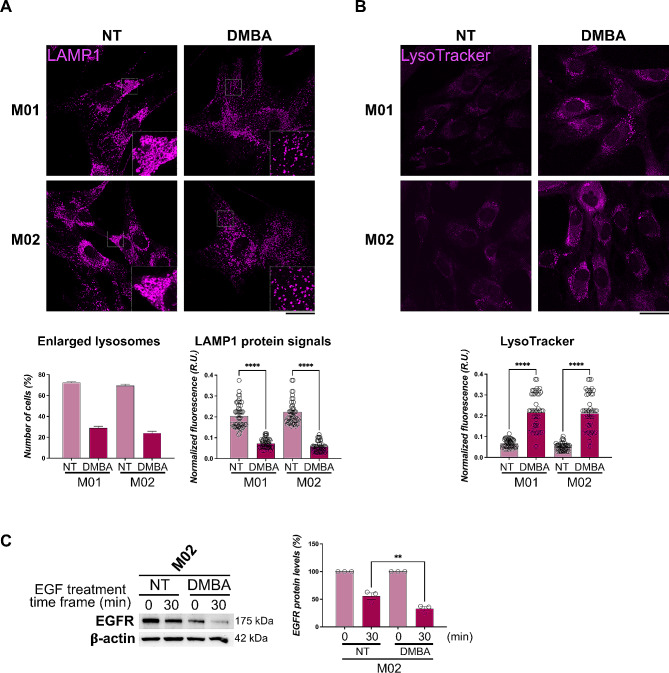
Results: Our data show that MUT deficiency is connected with profound proteome dysregulations, revealing molecular actors involved in lysosome and autophagy functioning. To elucidate the effects of defective MUT on lysosomal and autophagy regulation, we analyzed the morphology and functionality of MMA-lysosomes that showed deep alterations, thus corroborating omics data. Lysosomes of MMA cells present as enlarged vacuoles with low degradative capabilities. Notwithstanding, treatment with an anti-propionigenic drug is capable of totally rescuing lysosomal morphology and functional activity in MUT-deficient cells. These results indicate a strict connection between MUT deficiency and lysosomal-autophagy dysfunction, providing promising therapeutic perspectives for MMA.

Conclusions: Defective homeostatic mechanisms in the regulation of autophagy and lysosome functions have been demonstrated in MUT-deficient cells. Our data prove that MMA triggers such dysfunctions impacting on autophagosome-lysosome fusion and lysosomal activity.

Keywords: Autophagy; Lysosomes; MMA therapy; Metabolic disease; Methylmalonic acidemia; Multi-omics; Multi-proteomics.


Conflict of interest statement

The authors declare no potential competing interests.

Figures

Fig. 1
Fig. 1
Analysis of the DIA-MS proteomic dataset of WT, MUT-KO, and MUT-RES cells. (A) Heatmap visualization of the proteins quantified in the three cell conditions, with detail of the abundance of MUT protein. (B) Representative chromatograms and bar plot of MUT peptides quantification revealed by targeted PRM analysis. Three experimental replicates were performed for statistical analysis, p < 0.0001. (C) Protein clusters selected from the heatmap and signed with circled numbers showing specific trends of abundance defined as up-down-up and down-up-down. (D) PCA analysis of the three experimental proteome datasets
Fig. 2
Fig. 2
Gene Set Enrichment Analysis (GSEA) of the whole MUT-KO proteome. (A) Heatmap of the top-100 features showing correlation between the ranked genes and the phenotypes (MUT-KO vs. WT + RES). Expression values are represented by range of colors from red to blue corresponding to high and low abundances, respectively. (B) GSEA analysis enriched significant GO BP and Reactome terms. The densest hits (highest normalized enrichment score) correlating with the MUT-KO were selected and plotted from (C) the total list of retrieved terms. Red and blue bars represent positively and negatively correlated terms, respectively. Black bars represent terms that may be significant but redundant or irrelevant
Fig. 3
Fig. 3
Functional enrichment analysis of the differential MUT-KO proteome. (A) The most significant (p < 0.01), non-redundant GO enriched clusters were selected in Metascape, and highlighted as global network with different colored nodes. In fact, a subset of representative GO terms was selected from a full cluster (according to q-values, percentage of gene set occupancy, and limiting redundancy) and converted into a network layout, where the color of the nodes represents the cluster identity. (B) STRING PPI networks enriched by the down-regulated proteins (cluster 5, Fig. 1) and up-regulated ones (cluster 2, Fig. 1), with details of the selected significant BP (FDR < 0.05). (C) Immunoblotting analysis of LAMP2 and STMN1 proteins in three biological replicates for HEK 293 WT, MUT-KO, and MUT-RES cells; β-actin was used as loading control
Fig. 4
Fig. 4
Functional characterization of the proteome of mut0 patients’ fibroblasts. (A) Heat map and hierarchical clustering reporting LFQ intensities of the proteins identified and the relations between the CTRL, M01, and M02 datasets. (B) Volcano plot analysis of significantly regulated proteins (–log10 p-value > 2) in the comparison M01 + M02 versus CTRL, with details of MUT and LAMP2 proteins. (C) Bar plot showing the statistical difference of LFQ intensities of the replicates of M01 + M02 versus CTRL for MUT and LAMP2 (upper panels). An additional plot was reported for the number of MUT’s unique peptides identified by LFQ proteomics in the analyzed conditions (upper panels). The statistical significance (****p < 0.0001) was calculated by unpaired t-test. WB analysis of MUT protein was performed on M01 and M02 patients’ cells; β-actin was used as loading control (lower panel). (D) Venn diagram reports the overlap between MUT-KO and mut0 differential proteomes. (E) Representative WB of lysosomal (LAMP1, LAMP2) and autophagy-related (LC3, p62) proteins. For all the tested proteins, β-actin was used as loading control. (F) Representative WB of cytosolic and nuclear TFEB levels; α-tubulin and histone H2A were used as cytosolic and nuclear loading controls, respectively. TFEB nuclear levels were measured by densitometry, normalized with H2A signals, and reported as relative units (R.U.) (mean ± SEM) values using the value of CTRL as unit (right panel). Statistical analysis was performed by one-way ANOVA; *p < 0.05. (G) Gene expression levels of LAMP1, LAMP2 and ATP6V1H were measured by RT-qPCR and calculated with the 2−∆∆Ct method, using β-actin as reference gene for normalization. Mean values of three independent experiments were reported as R.U. (mean ± SEM). Statistical significance was calculated by two-way ANOVA; **p < 0.01, *p < 0.05, ns = not significant. (H) Chord plot displaying the relationships between the differential proteins and the terms enriched by Metascape analysis in mut0 fibroblasts. (I) Enrichment of the Diseases terms category obtained through the STRING app in Cytoscape. The terms were plotted according to their % of gene set occupancy, with a detail of the PPI network of the proteins belonging to the most enriched terms with their first neighbors
Fig. 5
Fig. 5
Structural alterations of lysosomes in MUT-deficient fibroblasts from MMA patients. (A) Images of cells immuno-stained with anti-LAMP2 antibody quantifying the mean fluorescence intensity per cell (right panel) reported as mean ± SEM. (B) Images of cells immuno-stained with anti-LAMP1 and anti-CLX antibody. LAMP1 mean fluorescence intensity per cell was also measured (higher-right panel) and mean ± SEM is shown. The percentage of cells with enlarged LAMP1-positive structures (lysosomes) was also calculated (lower-right panel) and mean ± SEM is shown. (C) Images of cells immuno-stained with anti-LAMP1 and anti-LC3 antibody; number of LC3 dots per cell were also measured (left-upper panel); mean values ± SEM are shown; the percentage of cells with enlarged lysosomes was also calculated (left-lower panel); co-localization of LC3 and LAMP1 was also measured by Pearson’s correlation of the signals and reported as Pearson’s R coefficient values (left-lower panel). For all microscopy images the scale bar is 20 μm. For all the comparisons in the figure, statistical analysis was performed by one-way ANOVA; ****p < 0.0001
Fig. 6
Fig. 6
Lysosomal and autophagic dysfunctions in MUT-deficient fibroblasts from MMA patients. (A) The autophagic flux was measured in CTRL, M01 and M02 cells quantifying by WB the levels of LC3-II protein after treatment with Bafilomycin A1 in a time-course experiment (4, 16, 24 h). The β-actin was used as loading control. (B) Normalized LC3-II signals (σ) were used to draw regression curves that were used to mathematically calculate the autophagic flux (J). The data on the graph are the average ± SEM of two independent WB replicates. (C) For each of the treated cell lines (CTRL, M01 and M02) we calculated the Δσ as difference of the treatment at 4 h, i.e. σ(Baf A1) – σ(DMSO). In addition, the ΔΔσ was calculated for MMA cells as differences of M01 and M02 Δσ with the CTRL Δσ, respectively. (D) Images of cells stained with LysoTracker. The fluorescence intensity per cell (right panel) was reported as mean ± SEM. Statistical analysis was performed by one-way ANOVA; ****p < 0.0001. (E) EGFR degradation assay consisted of WB analysis of EGFR in cells starved and stimulated with EGF (15, 30 min); EGFR protein levels were measured by densitometry, normalized with β-actin signals, and reported as percentage values (mean ± SEM) using the value at time 0 (starved but not stimulated cells) as 100% reference (right panel). Statistical analysis was performed by two-way ANOVA for the comparisons M01 and M02 vs. CTRL at 15 and 30 min of EGF stimulation (*p < 0.05, **p < 0.01) and at 15 min vs. 0 min, and 30 min vs. 0 min within each cell line (####p < 0.0001)
Fig. 7
Fig. 7
Structural and functional alterations of MMA lysosomes are rescued upon DMBA treatment. (A) Images of LAMP1 immuno-staining in M01 and M02 cells treated with DMBA and non-treated (NT) cells; the percentage of cells with enlarged LAMP1-positive structures (lysosomes) was reported as mean ± SEM (lower panel). (B) Images of LysoTracker staining of NT and DMBA-treated M01 and M02 cells. The fluorescence intensity per cell (lower panel) was reported as mean ± SEM. Statistical analysis was performed by one-way ANOVA; ****p < 0.0001. (C) EGFR degradation assay with DMBA treatment and densitometry analysis (right panel) were performed in M02 cells as reported in Fig. 6E; **p < 0.01. All the WB and microscopy images are representative of at least three independent experiments. For all microscopy images the scale bar is 20 μm

References

    1. Gonzalez Melo M, et al. The first knock-in rat model for glutaric aciduria type I allows further insights into pathophysiology in brain and periphery. Mol Genet Metab. 2021;133:157–81. doi: 10.1016/j.ymgme.2021.03.017. - DOI - PubMed
    1. Barends M, Pitt J, Morrissy S, Tzanakos N, Boneh A. Biochemical and molecular characteristics of patients with organic acidaemias and urea cycle disorders identified through newborn screening. Mol Genet Metab. 2014;113:46–52. doi: 10.1016/j.ymgme.2014.07.003. - DOI - PubMed
    1. Gonzalez Melo M, et al. A knock-in rat model unravels acute and chronic renal toxicity in glutaric aciduria type I. Mol Genet Metab. 2021;134:287–300. doi: 10.1016/j.ymgme.2021.10.003. - DOI - PubMed
    1. Almási T, et al. Systematic literature review and meta-analysis on the epidemiology of methylmalonic acidemia (MMA) with a focus on MMA caused by methylmalonyl-CoA mutase (mut) deficiency. Orphanet J Rare Dis. 2019;14:84. doi: 10.1186/s13023-019-1063-z. - DOI - PMC - PubMed
    1. Whitehead M. Acquired and inherited disorders of cobalamin and folate in children. Br J Haematol. 2006;134:125–36. doi: 10.1111/j.1365-2141.2006.06133.x. - DOI - PubMed