. 2024 Sep;23(9):e14205.
doi: 10.1111/acel.14205. Epub 2024 May 17.

Hydroxycitrate delays early mortality in mice and promotes muscle regeneration while inducing a rich hepatic energetic status

Affiliations

Hydroxycitrate delays early mortality in mice and promotes muscle regeneration while inducing a rich hepatic energetic status

Isabel Espadas et al. Aging Cell. 2024 Sep.

Abstract

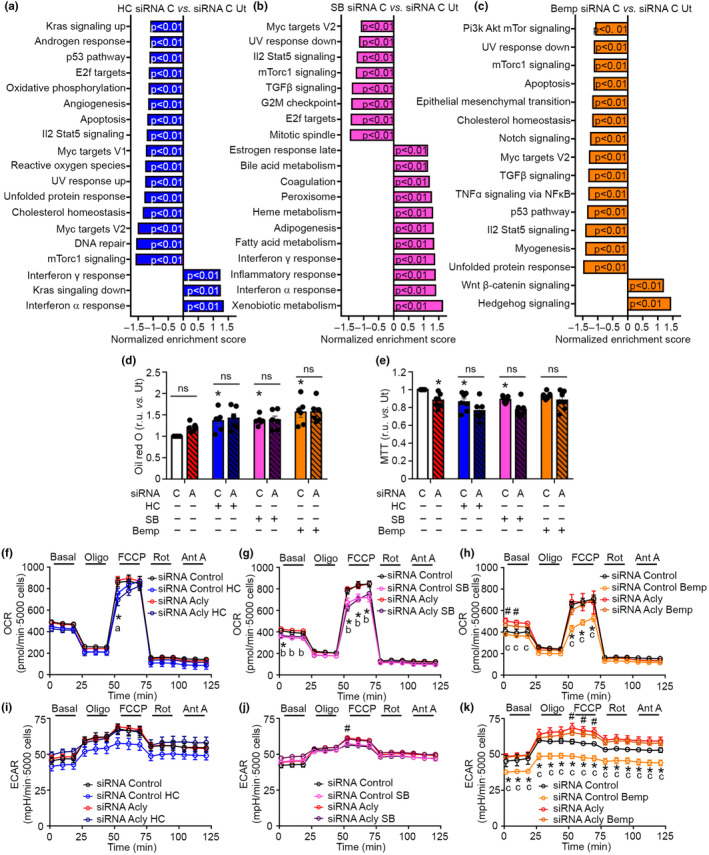
ATP citrate lyase (ACLY) inhibitors have the potential of modulating central processes in protein, carbohydrate, and lipid metabolism, which can have relevant physiological consequences in aging and age-related diseases. Here, we show that hepatic phospho-active ACLY correlates with overweight and Model for End-stage Liver Disease score in humans. Wild-type mice treated chronically with the ACLY inhibitor potassium hydroxycitrate exhibited delayed early mortality. In AML12 hepatocyte cultures, the ACLY inhibitors potassium hydroxycitrate, SB-204990, and bempedoic acid fostered lipid accumulation, which was also observed in the liver of healthy-fed mice treated with potassium hydroxycitrate. Analysis of soleus tissue indicated that potassium hydroxycitrate produced the modulation of wound healing processes. In vivo, potassium hydroxycitrate modulated locomotor function toward increased wire hang performance and reduced rotarod performance in healthy-fed mice, and improved locomotion in mice exposed to cardiotoxin-induced muscle atrophy. Our findings implicate ACLY and ACLY inhibitors in different aspects of aging and muscle regeneration.

Keywords: ACLY; health span; hydroxycitrate; lifespan; liver; muscle strength; tissue regeneration.


Conflict of interest statement

VCG and AMM have filed a patent entitled “hidroxicitrato para la regeneración muscular.”

Figures

FIGURE 1
FIGURE 1
Hepatic phospho‐active ACLY expression is positively correlated with overweight and MELD score in humans. (a) Representative staining of pSer455 ACLY and total ACLY in patients undergoing liver biopsies. pSer455 ACLY low: body weight 56 kg, BMI 23.9, MELD 7. pSer455 ACLY intermediate: body weight 84 kg, BMI 32.8, MELD 14. pSer455 ACLY high: body weight 117 kg, BMI 44, MELD 18. ACLY low: INR 1.08, prothrombin time 12.2 s, Quick index 89. ACLY intermediate: INR 1.31, prothrombin time 14.8 s, Quick index 65. ACLY high: INR 1.96, prothrombin time 22.3 s, Quick index 39; n = 12 males and 18 females. (b) Linear regression of hepatic pSer455 ACLY and body weight. n = 12 males and 18 females. Pearson correlation. (c) Linear regression of hepatic pSer455 ACLY and BMI; n = 12 males and 18 females; Pearson correlation. (d) Linear regression of hepatic pSer455 ACLY and MELD; n = 12 males and 18 females; Pearson correlation. (e) Linear regression of hepatic ACLY and international normalized ratio; n = 11 males and 17 females; Pearson correlation. (f) Linear regression of hepatic ACLY and prothrombin time; n = 11 males and 17 females; Pearson correlation. (g) Linear regression of hepatic ACLY and Quick index; n = 11 males and 17 females; Pearson correlation. a.u., arbitrary units; INR, international normalized ratio; MELD, Model for End‐stage Liver Disease; r.u., relative units. Data shown are individual biological values.
FIGURE 2
FIGURE 2
ACLY inhibitors increase lipid content and reduce metabolic activity. AML12 cells were siRNA interfered for ACLY expression and were treated with HC 1 mM, SB 10 μM, or Bemp 30 μM for 16 h. (a) Enriched gene sets by GSEA analysis in siRNA control HC vs. siRNA control. n = 3. (b) Enriched gene sets by GSEA analysis in siRNA control SB vs. siRNA control. n = 3. (c) Enriched gene sets by GSEA analysis in siRNA control Bemp vs. siRNA control. n = 3. (d) Lipid determination by Oil red O in AML12 cells. n = 6. Kruskal–Wallis Dunn's post hoc test. (e) Metabolic activity by MTT test. n = 7. Kruskal–Wallis plus Dunn's post hoc test. (f) OCR of cells treated with HC. n = 5 siRNA Control Ut, n = 5 siRNA Control HC, n = 3 siRNA ACLY Ut, n = 3 siRNA ACLY HC. Two‐way ANOVA plus Tukey post hoc test. (g) OCR of cells treated with SB. n = 5. Two‐way ANOVA plus Tukey post hoc test. (h) OCR of cells treated with Bemp. n = 5 siRNA Control Ut, n = 5 siRNA Control Bemp, n = 5 siRNA ACLY Ut, n = 5 siRNA ACLY Bemp. Two‐way ANOVA plus Tukey post hoc test. (i) ECAR of cells treated with HC. n = 5 siRNA Control Ut, n = 5 siRNA Control HC, n = 3 siRNA ACLY Ut, n = 3 siRNA ACLY HC. Two‐way ANOVA plus Tukey post hoc test. (j) ECAR of cells treated with SB. n = 5. Two‐way ANOVA plus Tukey post hoc test. (k) ECAR of cells treated with Bemp. n = 5 siRNA Control Ut, n = 5 siRNA Control Bemp, n = 4 siRNA ACLY Ut, n = 5 siRNA ACLY Bemp. Two‐way ANOVA plus Tukey post hoc test. A, siRNA ACLY; Ant A, antimycin A; Bemp, bempedoic acid; C, siRNA control; FCCP, carbonyl cyanide 4‐(trifluoromethoxy) phenylhydrazone; HC, Hydroxycitrate; ns, not significant; Oligo, oligomycin; Rot, rotenone; SB, SB‐204990; Ut, untreated. Data shown are the means ± SEM. *p < 0.05 HC vs. Ut or HC/SB/Bemp treatment in siRNA control cells vs. siRNA control Ut cells. # p < 0.05 siRNA ACLY Ut vs. siRNA Control Ut. a p < 0.05 siRNA ACLY HC vs. siRNA ACLY Ut. b p < 0.05 siRNA ACLY SB vs. siRNA ACLY Ut. c p < 0.05 siRNA ACLY Bemp vs. siRNA ACLY Bemp.
FIGURE 3
FIGURE 3
The ACLY inhibitor HC delays early mortality in mice. (a) Graphical representation of the experimental model. (b) Kaplan–Meier survival curve of wild‐type mice treated or not with 0.75% (w/w) HC. n = 61 Ut, n = 59 HC. Survival by logrank. (c) Body weight during longevity assay. n = 24 Ut, n = 20 HC at the initiation of the study. Student's t‐test. (d) Age at death of the shortest living mice in longevity study. n = 6 for 90% survival (i.e., age of death of the 10% shortest living mice). n = 9 for 85% survival. n = 12 for 80% survival. n = 15 for 75% survival. n = 18 for 70% survival. Student's t‐test. (e) Major pathologies detected at time of death. n = 58 Ut, n = 59 HC. Fisher exact test. HC, hydroxycitrate; r.u., relative units; Ut, untreated. Data shown are the means ± SEM or incidence over total mouse population. *p < 0.05 HC vs. Ut.
FIGURE 4
FIGURE 4
HC increases glycogen and lipid accumulation in the liver. (a) Tissue weight at euthanization in mice fed with healthy STD at 41 weeks of age (21 weeks of treatment). n = 11. Student's t‐test. (b) Histological analysis of liver tissue to determine the tissue structure by hematoxylin and eosin staining, glycogen depositions by PAS staining and collagen depositions by Sirius red staining. n = 5. (c) PAS score in liver tissue; n = 5; Student's t‐test. (d) Triglyceride content in liver tissue; n = 12; Student's t‐test. (e) Sirius red total area in liver tissue; n = 5; Student's t‐test. (f) Green fibers under polarized light in Sirius red staining in liver tissue; n = 5; Student's t‐test. (g) Red fibers under polarized light in Sirius red staining in liver tissue; n = 5; Student's t‐test. (h) Heatmap of raw counts of differentially expressed genes (p ≤ 0.05, Log2 of fold‐change ≥1 or ≤−1) in soleus and liver tissue; n = 5. (i) Volcano plot depicting the fold change and the statistical significance of transcripts in liver. Over‐expressed transcripts are highlighted in red and downregulated transcripts are highlighted in blue. Reference line shows the threshold of significance. (j) 12 top significantly modulated canonical pathways by ingenuity pathway analysis in liver. Bars with positive z‐scores are filled in red and bars with negative z‐scores are filled with blue. n = 5. (k) Top 7 enriched terms by Metascape analysis in liver tissue. n = 5. (l) Significantly modulated genes in the canonical pathway “LPS/Il‐1‐mediated inhibition of RXR function” in liver tissue. n = 5. (m) Representative western blots of hepatic proteins of mice treated with HC. n = 7. (n) Densitometric quantification of western blots shown in panel m; n = 7; Student's t‐test. (o) Hepatic ACLY activity. ACLY activity was determined in the presence or not of HC in the assay; n = 3 Ut, n = 6 HC. Two‐way ANOVA plus Tukey post hoc test. a.u., arbitrary units; H&E, hematoxylin and eosin; HC, hydroxycitrate; r.u., relative units; Und, undetermined; Ut, untreated; UVS, unit variance scaling. Data shown are the means ± SEM. *p < 0.05 HC vs. Ut.
FIGURE 5
FIGURE 5
HC modulates pathways involved in tissue regeneration in skeletal muscle. (a) Histological analysis of cellular structure by hematoxylin and eosin staining and glycogen depositions by PAS staining in soleus tissue; n = 5. (b) PAS score in soleus tissue; n = 5; Student's t‐test. (c) Soleus fiber CSA; n = 7 Ut, n = 6 HC; Student's t‐test. 150–274 fibers were counted per soleus. (d) Ultrastructural analysis of the soleus by electron microscopy; n = 4. (e) Histological analysis of cellular structure by hematoxylin and eosin staining and glycogen depositions by PAS staining in gastrocnemius; n = 5. (f) PAS score in gastrocnemius tissue; n = 5; Student's t‐test. (g) Gastrocnemius fiber CSA; n = 5; Student's t‐test. 477–2261 fibers were counted per gastrocnemius. (h) Volcano plot depicting the fold change and the statistical significance of transcripts in soleus. Over‐expressed transcripts are highlighted in red and downregulated transcripts are highlighted in blue. Reference line shows the threshold of significance; n = 5. (i) 12 top significantly modulated canonical pathways by Ingenuity Pathway Analysis in soleus. Bars with positive z‐scores are filled in red and bars with negative z‐scores are filled with blue. n = 5. (j) Top 7 enriched terms by Metascape analysis in the soleus. n = 5. (k) Significantly modulated genes in the canonical pathway “wound healing signaling pathway” in the soleus; n = 5. (l) Representative western blots of gastrocnemius mice treated with HC fed with healthy STD at 41 weeks of age (21 weeks of treatment); n = 7. (m) Densitometric quantification of western blots shown in panel l; n = 7. Student's t‐test. a.u., arbitrary units; ECM, extracellular matrix; Gastroc, gastrocnemius; H&E, hematoxylin and eosin; HC, hydroxycitrate; r.u., relative units; Und, undetermined; Ut, untreated. Data shown are the means ± SEM. *p < 0.05 HC vs. Ut.
FIGURE 6
FIGURE 6
HC potentiates muscle regeneration in vivo. (a) Graphical representation of the experimental model. 6 ± 1‐month‐old Wild‐type male C57BL/6 mice were injected with CTX to generate muscle damage. Then, HC treatment was initiated and physical strength was evaluated using different test. At Day 2 or Day 30 post CTX injection, mice were euthanized and tissues were weighed and harvested. Eu, euthanization; Gs, grip strength; Rd, rotarod; Td, treadmill; Wh, wire hang. (b) Wire hang performance at 10 DPI. n = 16 C, n = 19 CTX, n = 20 CTX‐HC. One‐way ANOVA plus Tukey post hoc test. (c) Treadmill performance at 16 DPI. n = 16 C, n = 18 CTX, n = 20 CTX‐HC. One‐way ANOVA plus Tukey post hoc test. (d) Rotarod performance at 21 DPI; n = 16 C, n = 19 CTX, n = 20 CTX‐HC. One‐way ANOVA plus Tukey post hoc test. (e) Grip strength performance at 27 DPI; n = 15 C, n = 19 CTX, n = 20 CTX‐HC. One‐way ANOVA plus Tukey post hoc test. (f) Soleus weight of injected leg; n = 4 C, n = 6 CTX 2 DPI, n = 6 CTX‐HC 2 DPI, n = 19 CTX 30 DPI, n = 18 CTX‐HC 30 DPI. One‐way ANOVA plus Tukey post hoc test. (g) Gastrocnemius weight of injected leg; n = 4 C, n = 6 CTX 2 DPI, n = 6 CTX‐HC 2 DPI, n = 19 CTX 30 DPI, n = 17 CTX‐HC 30 DPI. One‐way ANOVA plus Tukey post hoc test. (h) Cd45+ immune infiltration total area in soleus; n = 4 C, n = 5 CTX 2 DPI, n = 5 CTX‐HC 2 DPI, n = 6 CTX 30 DPI, n = 6 CTX‐HC 30 DPI. One‐way ANOVA plus Tukey post hoc test. (i) Sirius red total area in soleus; n = 4 C, n = 6 CTX 2 DPI, n = 5 CTX‐HC 2 DPI, n = 6 CTX 30 DPI, n = 6 CTX‐HC 30 DPI. One‐way ANOVA plus Tukey post hoc test. (j) Fiber CSA in soleus; n = 4 C, n = 6 CTX 2 DPI, n = 6 CTX‐HC 2 DPI, n = 6 CTX 30 DPI, n = 6 CTX‐HC 30 DPI. One‐way ANOVA plus Tukey post hoc test. (k) Fiber CSA distribution in soleus; n = 4 C, n = 6 CTX 2 DPI, n = 6 CTX‐HC 2 DPI, n = 6 CTX 30 DPI, n = 6 CTX‐HC 30 DPI. One‐way ANOVA plus Tukey post hoc test. (l) Multinucleated fibers in soleus; n = 4 C, n = 5 CTX 2 DPI, n = 5 CTX‐HC 2 DPI, n = 6 CTX 30 DPI, n = 5 CTX‐HC 30 DPI. One‐way ANOVA plus Tukey post hoc test. (m) Multinucleated index in soleus; n = 4 C, n = 5 CTX 2 DPI, n = 4 CTX‐HC 2 DPI, n = 6 CTX 30 DPI, n = 5 CTX‐HC 30 DPI. One‐way ANOVA plus Tukey post hoc test. (n) Fusion index in soleus; n = 4 C, n = 5 CTX 2 DPI, n = 5 CTX‐HC 2 DPI, n = 6 CTX 30 DPI, n = 4 CTX‐HC 30 DPI. One‐way ANOVA plus Tukey post hoc test. (o) PCA was applied for transcriptomic analysis in gastrocnemius muscle. Each point corresponds to the PCA analysis of one mouse sample; n = 3. (p) Diagram showing significantly altered transcripts in each CTX‐treated group compared to healthy controls. Upregulation (red), downregulation (blue), and reciprocal regulation (black); n = 3. (q) Diagram showing common and specific significantly enriched processes in the gastrocnemius of mice injected or not with CTX at 2 DPI. The top 3 most significant enriched processes specific of each comparison are highlighted; n = 3. (r) Volcano plots depicting the fold change and the statistical significance of transcripts in the gastrocnemius in the comparison CTX 2 DPI vs. CTX‐HC 2 DPI. Over‐expressed transcripts are highlighted in red and downregulated transcripts are highlighted in blue. Reference line shows the threshold of significance; n = 3. (s) Top 7 enriched terms by Metascape analysis in the gastrocnemius in the comparison CTX‐HC 2 DPI vs. CTX 2 DPI; n = 3. (t) Diagram showing common and specific significantly enriched processes in the gastrocnemius of mice injected or not with CTX at 30 DPI. The top 3 most significant enriched processes specific of each comparison are highlighted. n = 3. (u) Volcano plots depicting the fold change and the statistical significance of transcripts in the gastrocnemius in the comparison CTX 30 DPI vs. CTX‐HC 30 DPI. Over‐expressed transcripts are highlighted in red and downregulated transcripts are highlighted in blue. Reference line shows the threshold of significance; n = 3. (v) Significantly enriched terms by Metascape analysis in the gastrocnemius in CTXHC 30 DPI vs. CTX 30 DPI; n = 3. C, healthy control mice not injected with CTX; CTX, cardiotoxin; DPI, days post injury; Gastroc, gastrocnemius; HC, hydroxycitrate; Ut, untreated. Data shown are the means ± SEM. *p < 0.05 CTX vs. C. # p < 0.05 CTX‐HC vs. CTX.

References

    1. Anilkumar, A. T. , Manoharan, S. , Balasubramanian, S. , & Perumal, E. (2023). Garcinia gummi‐gutta: Phytochemicals and pharmacological applications. BioFactors, 49, 584–599. 10.1002/biof.1943 - DOI - PubMed
    1. Baardman, J. , Verberk, S. G. S. , van der Velden, S. , Gijbels, M. J. J. , van Roomen, C. P. P. A. , Sluimer, J. C. , Broos, J. Y. , Griffith, G. R. , Prange, K. H. M. , van Weeghel, M. , Lakbir, S. , Molenaar, D. , Meinster, E. , Neele, A. E. , Kooij, G. , de Vries, H. E. , Lutgens, E. , Wellen, K. E. , de Winther, M. P. J. , & Van den Bossche, J. (2020). Macrophage ATP citrate lyase deficiency stabilizes atherosclerotic plaques. Nature Communications, 11(1), 6296. 10.1038/s41467-020-20141-z - DOI - PMC - PubMed
    1. Beigneux, A. P. , Kosinski, C. , Gavino, B. , Horton, J. D. , Skarnes, W. C. , & Young, S. G. (2004). ATP‐citrate lyase deficiency in the mouse. The Journal of Biological Chemistry, 279(10), 9557–9564. 10.1074/jbc.M310512200 - DOI - PMC - PubMed
    1. Birkenfeld, A. L. , Lee, H. Y. , Guebre‐Egziabher, F. , Alves, T. C. , Jurczak, M. J. , Jornayvaz, F. R. , Zhang, D. , Hsiao, J. J. , Martin‐Montalvo, A. , Fischer‐Rosinsky, A. , Spranger, J. , Pfeiffer, A. F. , Jordan, J. , Fromm, M. F. , König, J. , Lieske, S. , Carmean, C. M. , Frederick, D. W. , Weismann, D. , … Shulman, G. I. (2011). Deletion of the mammalian INDY homolog mimics aspects of dietary restriction and protects against adiposity and insulin resistance in mice. Cell Metabolism, 14(2), 184–195. 10.1016/j.cmet.2011.06.009 - DOI - PMC - PubMed
    1. Das, S. , Morvan, F. , Jourde, B. , Meier, V. , Kahle, P. , Brebbia, P. , Toussaint, G. , Glass, D. J. , & Fornaro, M. (2015). ATP citrate lyase improves mitochondrial function in skeletal muscle. Cell Metabolism, 21(6), 868–876. 10.1016/j.cmet.2015.05.006 - DOI - PubMed