. 2024 Aug;23(8):e14186.
doi: 10.1111/acel.14186. Epub 2024 May 17.

Elimination of damaged mitochondria during UVB-induced senescence is orchestrated by NIX-dependent mitophagy

Affiliations

Elimination of damaged mitochondria during UVB-induced senescence is orchestrated by NIX-dependent mitophagy

Maria Cavinato et al. Aging Cell. 2024 Aug.

Abstract

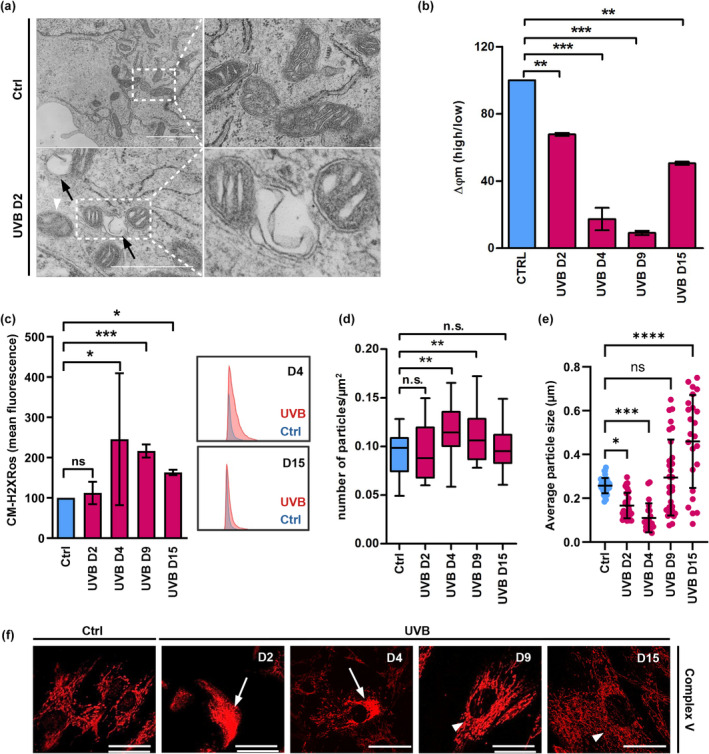
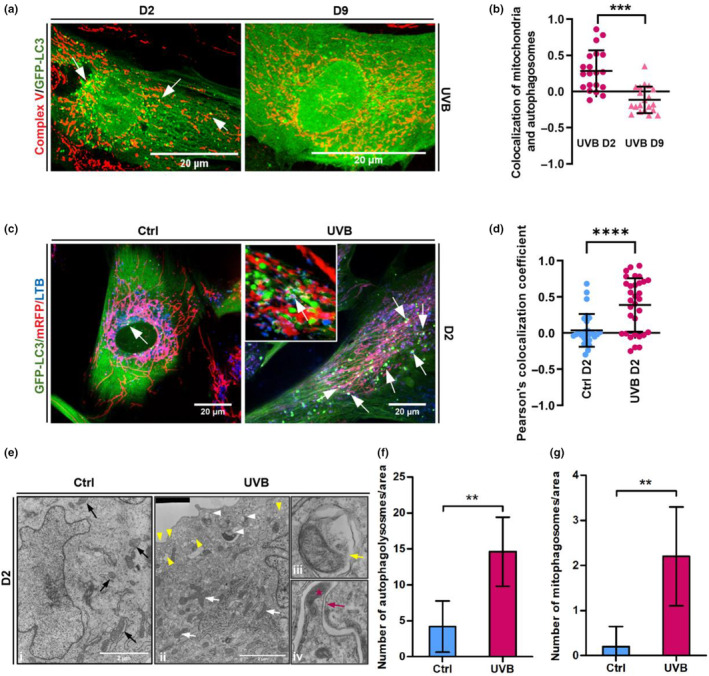
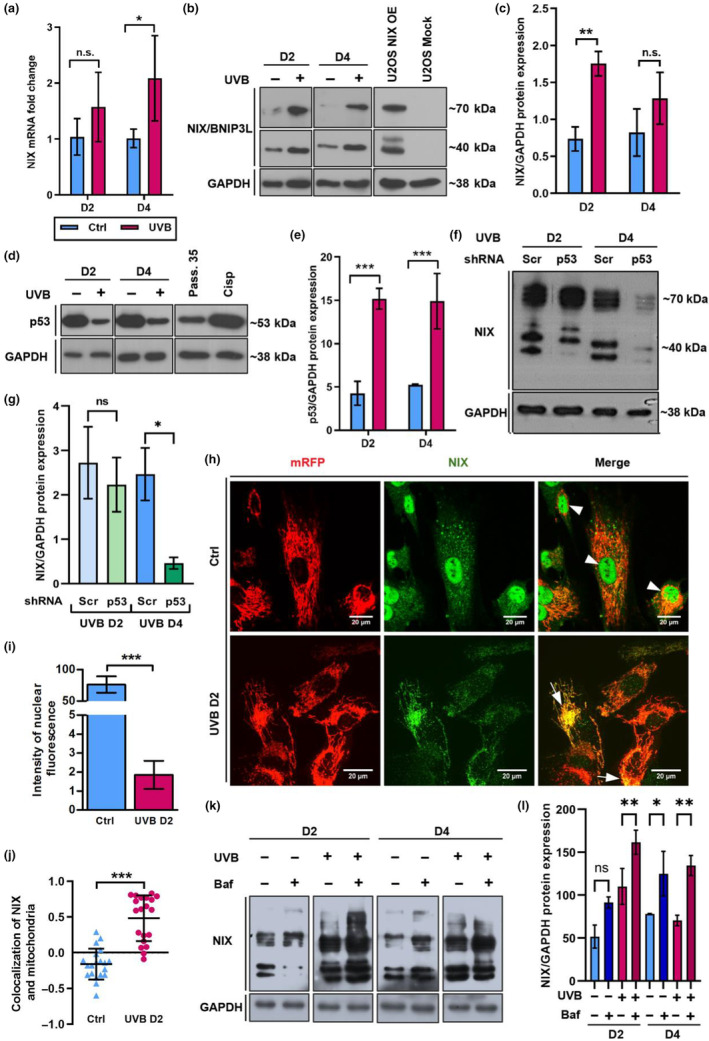
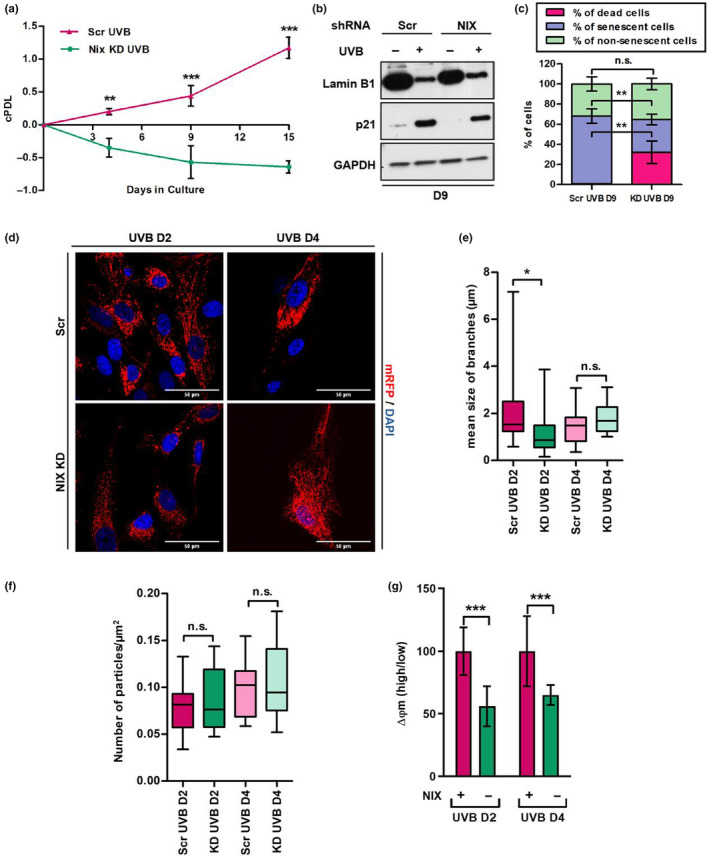
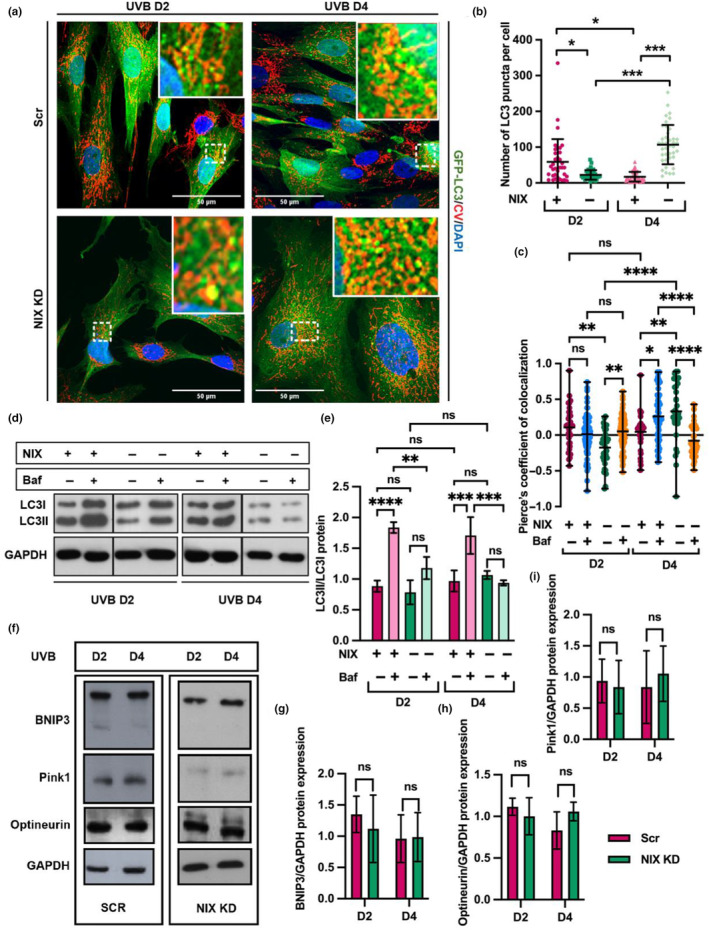
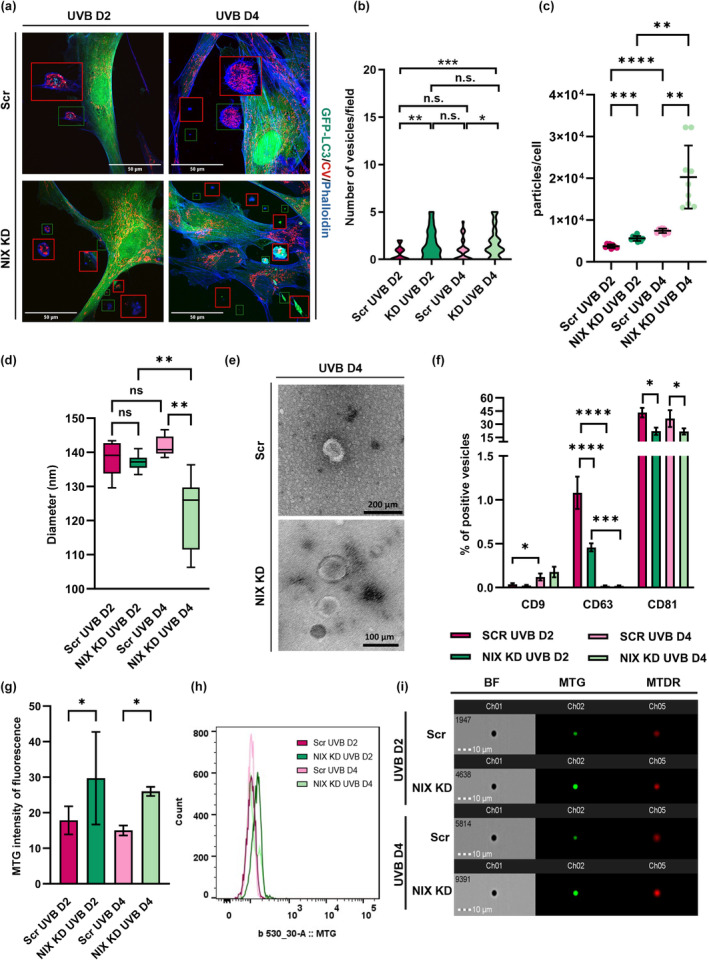
Skin aging is the result of two types of aging, "intrinsic aging" an inevitable consequence of physiologic and genetically determined changes and "extrinsic aging," which is dependent on external factors such as exposure to sunlight, smoking, and dietary habits. UVB causes skin injury through the generation of free radicals and other oxidative byproducts, also contributing to DNA damage. Appearance and accumulation of senescent cells in the skin are considered one of the hallmarks of aging in this tissue. Mitochondria play an important role for the development of cellular senescence, in particular stress-induced senescence of human cells. However, many aspects of mitochondrial physiology relevant to cellular senescence and extrinsic skin aging remain to be unraveled. Here, we demonstrate that mitochondria damaged by UVB irradiation of human dermal fibroblasts (HDF) are eliminated by NIX-dependent mitophagy and that this process is important for cell survival under these conditions. Additionally, UVB-irradiation of human dermal fibroblasts (HDF) induces the shedding of extracellular vesicles (EVs), and this process is significantly enhanced in UVB-irradiated NIX-depleted cells. Our findings establish NIX as the main mitophagy receptor in the process of UVB-induced senescence and suggest the release of EVs as an alternative mechanism of mitochondrial quality control in HDF.

Keywords: NIX; UVB; mitochondria; mitophagy; senescence; skin aging; vesicles.


Conflict of interest statement

The authors declare that there are no competing interests associated with this manuscript.

Figures

FIGURE 1
FIGURE 1
UVB irradiation impairs mitochondrial morphology and physiology. (a) Human dermal fibroblasts submitted to 2 days of UVB irradiation, and the corresponding controls were processed and analyzed by TEM. Details show healthy mitochondria in control non‐irradiated cells and blebbing damaged mitochondria after 2 days of UVB irradiation. Black arrows: blebbing of mitochondrial membrane, white arrowheads: mitochondria with disorganized cristae. (b, c) UVB‐irradiated and control HDF were labeled with the fluorescent probes JC‐1 (b) and CM‐H2XRos (c) and analyzed by FACS for the evaluation of the effects of UVB on mitochondrial membrane potential and mitochondrial ROS levels, respectively (b) Mitochondrial membrane potential of Ctrl and UVB‐irradiated cells. Bars represent the ratio obtained by dividing the percentage of mitochondria with high membrane potential by the percentage of mitochondria with low membrane potential of a given population. Results are displayed as mean values of three independent biological samples ± SD. Controls were normalized to 100% for better interpretation of the results. (c) Mitochondrial ROS in Ctrl and UVB‐irradiated HDF. Results are displayed as mean values ± SD of three independent experiments. Histograms are representative of control (blue) and irradiated (red) cells measured on days 4 and 15 of the experiment. (d–f) Human dermal fibroblasts were irradiated, labeled by indirect immunofluorescence with antibody to detect the mitochondrial Complex V subunit ATP Synthase beta and observed in confocal microscopy to evaluate mitochondrial network morphology. (d, e) Analysis of mitochondrial network fragmentation (d) and mitochondrial particle size (e) was performed in ImageJ software using the images obtained from 90 cells randomly chosen from three independent experiments. (f) Representative images of mitochondria in control and UVB‐irradiated HDF. White arrows: impaired mitochondrial network. White arrowheads: recovered mitochondrial network. Scale bar: 10 μm. For all experiments: *p ≤ 0.05; **p ≤ 0.01; ***p ≤ 0.001; n.s., non‐significant.
FIGURE 2
FIGURE 2
Mitochondria damaged by UVB are eliminated by mitophagy. (a) HDF expressing GFP‐LC3 were grown on coverslips and UVB‐irradiated. Immediately after the second day of irradiation (D2) or after 4 days of irradiation followed by 5 days of recovery (D9), cells were fixed and stained by indirect immunofluorescence with anti‐complex V (red) antibody and observed by confocal microscope. Single channels for each figure are displayed in Figure S1A. Colocalization of mitochondria and autophagosomes (white arrows) was quantified in ImageJ software and coefficient of colocalization of at least 30 cells of three independent experiments is represented in (b). Values above 0 represent positive colocalization and values under 0 represent negative colocalization. (c) GFP‐LC3/mRFP‐expressing fibroblasts exposed to 2 days of irradiation and the corresponding controls were stained with Lysotracker® Blue and observed by live cell confocal microscopy to investigate the elimination of mitophagosomes by mitophagy. White arrows point the co‐localization of autophagosomes (green), mitochondria (red) and lysosomes (blue). Images are representative of three independent experiments. Inset shows 3D detailed colocalization of mitochondria, autophagosomes and lysosomes in a UVB‐irradiated cells. Scale bars: 20 μm. Single channels for each picture are displayed in Figure S1F. (d) Coefficient of colocalization of mitochondria and lysosomes of control and UVB‐irradiated cells obtained by ImageJ software. Results are represented as mean value ± SD of three independent experiments. (e) Human dermal fibroblasts submitted to 2 days of UVB (ii‐iv) and the corresponding controls (i) were processed and analyzed by TEM to confirm the occurrence of mitophagy upon UVB irradiation. Black arrows (i): healthy mitochondria observed in control cells. White arrows (ii): mitochondria with damaged cristae in UVB‐irradiated cells. White arrowheads (ii): damaged mitochondria being engulfed by a forming autophagosome. Yellow arrowheads (ii): non‐mitophagic vesicles. iii: mitochondria contained inside mitophagosome (yellow arrow) in UVB‐treated HDFs. iv: mitochondria (red star) being engulfed by a forming autophagosome (red arrow). Scale bar: 2 μm. (f, g) Quantification of number of autophagy‐related organelles (f) and mitophagosomes (g) observed in electromicrographs from Control and UVB‐irradiated cells. Bar graphs represent the mean values ± SD of at least 10 cells. For all experiments: *p ≤ 0.05; **p ≤ 0.01; ***p ≤ 0.001; n.s., non‐significant.
FIGURE 3
FIGURE 3
Expression and subcellular localization of mitophagy receptor NIX are regulated during UVB‐induced senescence. (a, b) Wild type HDF were irradiated as described. mRNA samples and protein lysates were obtained and analyzed by q‐RT‐PCR (a) and WB (b) respectively, to verify regulation of the mitophagy receptor NIX upon UVB. (a) Bars represent mean values of three independent experiments ± SD. (b) NIX protein expression was analyzed by WB in UVB‐irradiated and control HDFs. Lysates of U2OS transfected with NIX overexpression and Mock (empty) plasmids were used as positive and negative controls for the antibody specificity, respectively. Images are representative of three independent biological replicates. (c) Bar graph represents mean values obtained by densitometry evaluation of NIX positive bands of three independent experiments ± SD. (d) WB to evaluate the expression of upstream NIX regulator p53 in control and UVB‐irradiated cells. HDF at passage 35 (Pass. 35) and HDF treated with cisplatin (33 μM) (Cisp) were used as positive controls for antibody specificity. (e) Bar graph represents mean values obtained by densitometry evaluation of p53 positive bands of three independent experiments ± SD. (f) WB to evaluate NIX expression in UVB‐irradiated Scr and p53 KD HDF. (g) Bar graph represents mean values obtained by densitometry evaluation of NIX positive bands of three independent experiments ± SD. (h) Fibroblasts expressing mRFP (red) irradiated for 2 days (UVB D2) and the corresponding control (Ctrl D2) were fixed and processed for indirect immunofluorescence. NIX was detected with appropriate antibodies and is shown in green. Overlaying of the two channels was obtained by the microscope software and co‐localization is characterized by yellow color (white arrows). Images are representative of three independent experiments. Scale bar: 20 μm. Intensity of NIX nuclear fluorescence (i) and colocalization of NIX (green) and mitochondria (red) (j) in at least 50 cells per group were evaluated by ImageJ software. Graphs represent mean values of three independent experiments ± SD. (k) WB to evaluate NIX expression in control and UVB‐irradiated HDF in the absence and presence of Bafilomycin A. (l) Bar graph represents mean values obtained by densitometry evaluation of NIX positive bands of three independent experiments ± SD. For all experiments *p ≤ 0.05; **p ≤ 0.01; ***p ≤ 0.001; n.s., non‐significant.
FIGURE 4
FIGURE 4
NIX KD leads to sustained mitochondrial damage and changes the fate of UVB‐irradiated fibroblasts from senescence to cell death. Fibroblasts were transduced with lentiviral vectors carrying NIX or scrambled shRNAs and grown under selection. Resulting NIX KD and Scr cells were irradiated twice a day for 4 days and monitored for cell growth (a) expression of senescence‐related proteins (b) and activity of SA‐β‐Gal (c). (a) Cumulative population doublings of the given populations represent mean values of three independent experiments ± SD. (b) WB to evaluate the expression of Lamin B1 and p21 in UVB‐irradiated Scr and NIX‐depleted HDF. GAPDH was used as loading control. Image is representative of three independent experiments. (c) SA‐β‐gal cytochemistry for detection of senescent cells. Blue positive cells were counted, and the percentage of positive cells was calculated dividing the number of positive cells by the total number of cells in a given sample. Number of dead cells was counted by Casy counter. Bars represent mean values of three independent experiments ± SD. For each group at least 400 cells were counted. (d) HDF expressing mRFP were transduced with lentiviral vectors carrying NIX or scrambled shRNAs and grown under selection. The resulting cells were submitted to UVB treatment as described and processed for confocal microscopy. Nuclei were stained with DAPI. Representative images of three independent experiments comparing Scr and NIX KD cells on D2 and D4 of the experiment are shown. (e, f) Analysis of size of mitochondrial branches (e) and number of particles (f) was performed in ImageJ software. Boxes represent minimum, maximum and median length ± SD of mitochondrial branches/particles observed after 2 or 4 days of irradiation. (g) Mitochondrial membrane potential of Scr and NIX KD HDF was accessed by FACS with the use of JC‐1 following 2 and 4 days of UVB. Bars represent the ratio obtained by dividing the percentage of mitochondria with high membrane potential by the percentage of mitochondria with low membrane potential of a given population. Graphic is displayed as mean values of three independent biological samples ± SD. Controls were normalized to 100% for better interpretation of the results. For all experiments *p ≤ 0.05; **p ≤ 0.01; ***p ≤ 0.001; n.s., non‐significant.
FIGURE 5
FIGURE 5
Mitophagy is impaired in NIX KD HDF. (a) HDFs expressing GFP‐LC3 were transduced with lentiviral vectors carrying NIX or scrambled shRNAs and grown under selection. The resulting cells were submitted to UVB treatment as described fixed and processed for indirect immunofluorescence and analyzed by confocal microscopy. Mitochondrial Complex V (CV) was detected with appropriate antibodies and is shown in red, nuclei were stained with DAPI. Representative images of three independent experiments comparing Scr and NIX KD cells on D2 and D4 of the experiment are shown. Enlarged detailed images of mitochondria colocalized with LC3 positive puncta are shown in red squares. Single channels for each picture are displayed in Figure S4A. (b) Mean number of autophagosomes per cell was quantified by ImageJ software and is represented as mean value ± SD. (c) Analysis of colocalization between mitochondria (red) and autophagosomes (green) in NIX KD and Scr cells submitted to 2 or 4 days of UVB, in the presence or absence of Bafilomycin A. Values of the Pearson coefficient above 0 represent positive colocalization and values under 0 represent negative colocalization. (d) WB to detect LC3I and LC3II in UVB‐irradiated Scr and NIX KD HDF in the absence and presence of Bafilomycin A. GAPDH was used as loading control. Images are representative of three independent experiments. (e) Densitometry of bands obtained by WB was performed in Image J software. Results are displayed as values obtained for LC3II divided by the values obtained for LC3I following normalization to GAPDH. (f) WB to detect BNIP3, Pink1 and Optneurin in UVB‐irradiated Scr and NIX KD HDF. GAPDH was used as loading control. Images are representative of three independent experiments. (g–i) Densitometry of bands obtained by WB for BNIP3 (g) Pink1 (h) and Optneurin was performed in Image J software. Graphs represent mean values of 3 independent experiments ± SD normalized to GAPDH. For all graphs: *p ≤ 0.05; **p ≤ 0.01; ***p ≤ 0.001; ****p ≤ 0.0001; n.s., non‐significant.
FIGURE 6
FIGURE 6
Release of EVs containing mitochondria is increased in response to impairment of mitophagy. HDFs expressing GFP‐LC3 transduced with lentiviral vectors carrying NIX or Scr shRNAs were irradiated for 2 and 4 days, stained with Complex V antibody and phalloidin blue, and observed by confocal microscopy to evaluate the release of vesicle‐like structures. Single channels for each picture are displayed in Figure S5. (a) Images are representative of at least 3 independent experiments. Enhanced detailed images of vesicles are shown in red squares. (b) Violin plot represents the distribution of vesicle‐like structures per microscopic field for each group. (c–g) Evs were isolated by size‐exclusion chromatography and concentration I and size (d) of particles were determined by NTA. (e) TEM of EVs isolated from UVB‐irradiated Scr and NIX KD supernatant. (f) Characterization of EVs tetraspanins CD9, CD63 and CD81 was performed by FACS. (g) Mitochondrial content of EVs was assessed by FACS using the probe Mitotracker Green (MTG). (h) Representative histogram of MTG intensity of fluorescence obtained by MTG staining of UVB‐irradiated Evs. (i) ImageStream analysis of EVs content using mitochondrial probes MTG and Mitotracker Deep Red (MTDR) For all graphs: *p ≤ 0.05; **p ≤ 0.01; ***p ≤ 0.001; ****p ≤ 0.0001; n.s., non‐significant.

References

    1. Anand, S. K. , Sharma, A. , Singh, N. , & Kakkar, P. (2020). Entrenching role of cell cycle checkpoints and autophagy for maintenance of genomic integrity. DNA Repair, 86, 102748. - PubMed
    1. Bakula, D. , & Scheibye‐Knudsen, M. (2020). MitophAging: Mitophagy in aging and disease. Frontiers in Cell and Development Biology, 8, 239. - PMC - PubMed
    1. Blume‐Peytavi, U. , Kottner, J. , Sterry, W. , Hodin, M. W. , Griffiths, T. W. , Watson, R. E. B. , Hay, R. J. , & Griffiths, C. E. M. (2016). Age‐associated skin conditions and diseases: Current perspectives and future options. Gerontologist, 56(Suppl 2), S230–S242. - PubMed
    1. Borghesan, M. , Fafián‐Labora, J. , Eleftheriadou, O. , Carpintero‐Fernández, P. , Paez‐Ribes, M. , Vizcay‐Barrena, G. , Swisa, A. , Kolodkin‐Gal, D. , Ximénez‐Embún, P. , Lowe, R. , Martín‐Martín, B. , Peinado, H. , Muñoz, J. , Fleck, R. A. , Dor, Y. , Ben‐Porath, I. , Vossenkamper, A. , Muñoz‐Espin, D. , & O'Loghlen, A. (2019). Small extracellular vesicles are key regulators of non‐cell autonomous intercellular communication in senescence via the interferon protein IFITM3. Cell Reports, 27, 3956–3971.e6. - PMC - PubMed
    1. Bosch, R. , Philips, N. , Suárez‐Pérez, J. , Juarranz, A. , Devmurari, A. , Chalensouk‐Khaosaat, J. , & González, S. (2015). Mechanisms of photoaging and cutaneous photocarcinogenesis, and photoprotective strategies with phytochemicals. Antioxidants, 4, 248–268. - PMC - PubMed

MeSH terms

LinkOut - more resources