. 2024 May 17;16(10):8880-8897.
doi: 10.18632/aging.205847. Epub 2024 May 17.

PDIA3 driven STAT3/PD-1 signaling promotes M2 TAM polarization and aggravates colorectal cancer progression

Affiliations

PDIA3 driven STAT3/PD-1 signaling promotes M2 TAM polarization and aggravates colorectal cancer progression

Jianchun Fan et al. Aging (Albany NY). .

Abstract

Objective: This inquiry endeavors to delineate the influence of PDIA3 on tumor-associated macrophages within the realm of colorectal malignancies, whilst elucidating the intrinsic biochemical pathways.

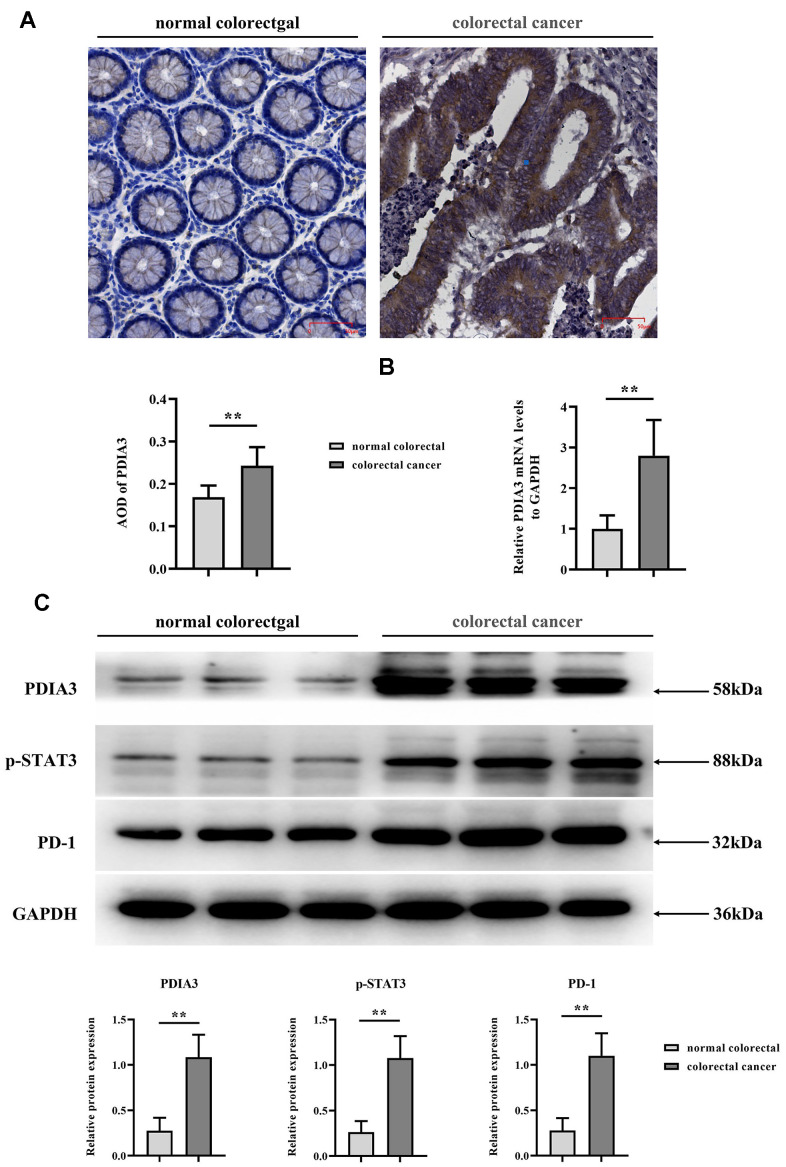
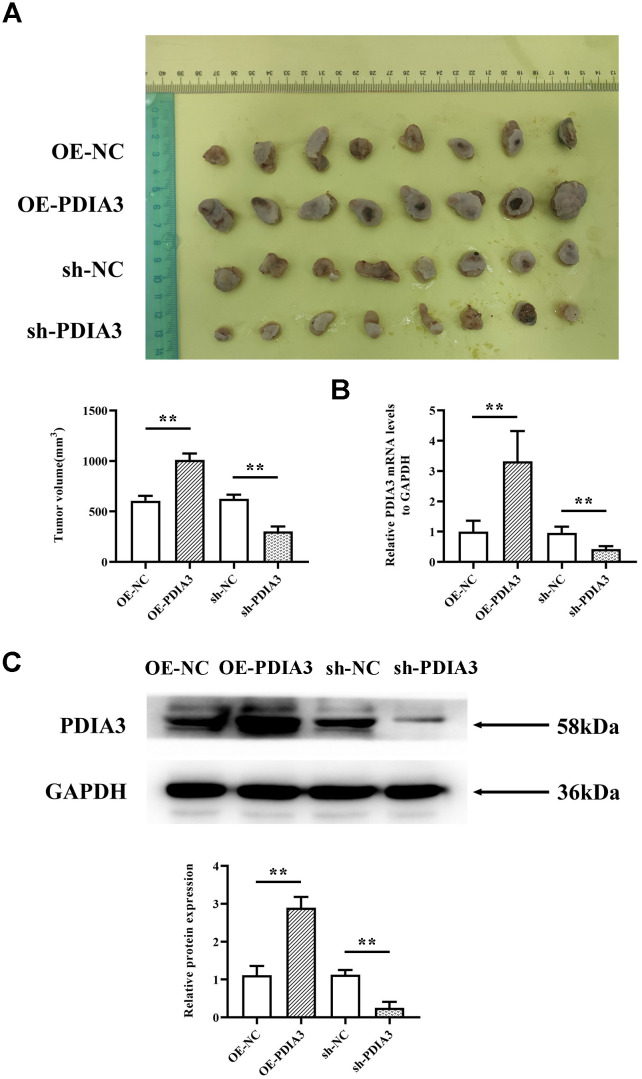
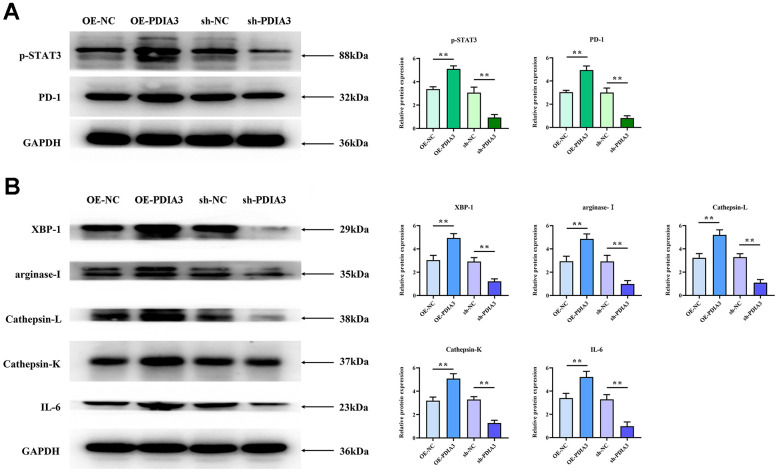
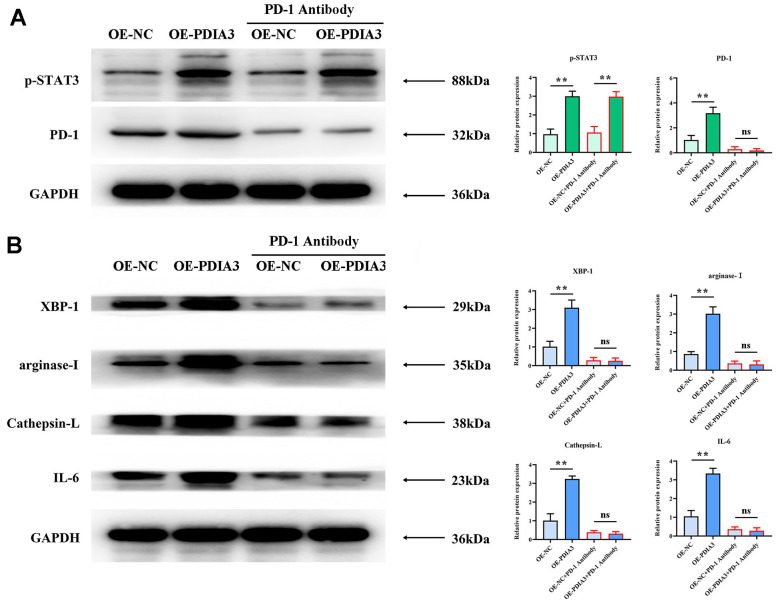
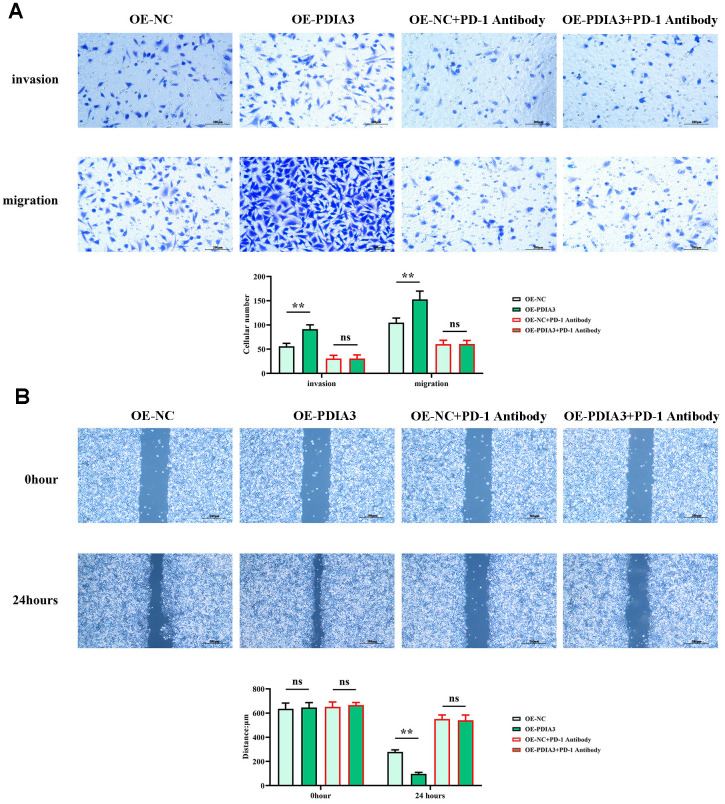
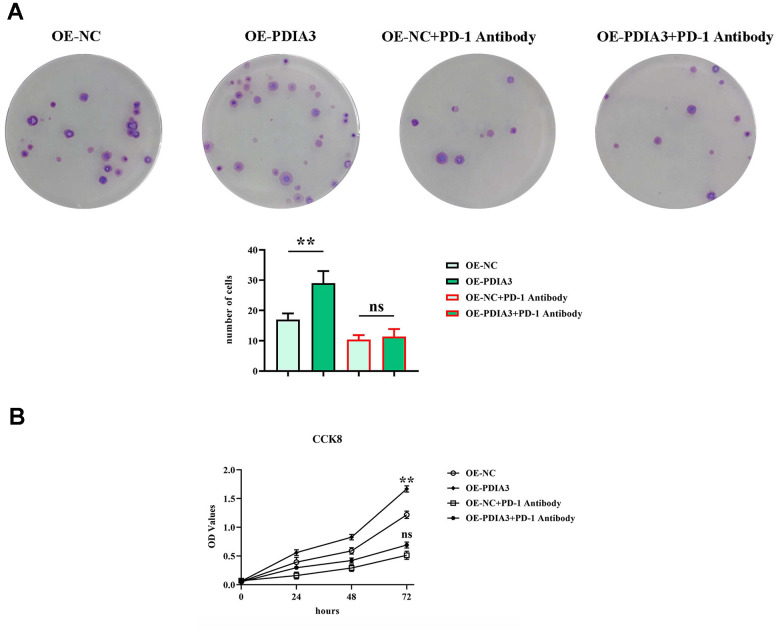
Method: Leveraging bioinformatics, we scrutinized the symbiosis between PDIA3, STAT3, and CD274. A xenograft model in immunodeficient murine served to assess PDIA3's impact on colorectal carcinogenesis. Further, Western blot analysis quantified the protein expression of PDIA3, p-STAT3, PD-1, XBP-1, assorted enzymes, and IL-6. Moreover, in vitro assays gauged SW480 cellular dynamics inclusive of migration, invasive potential, and proliferation.

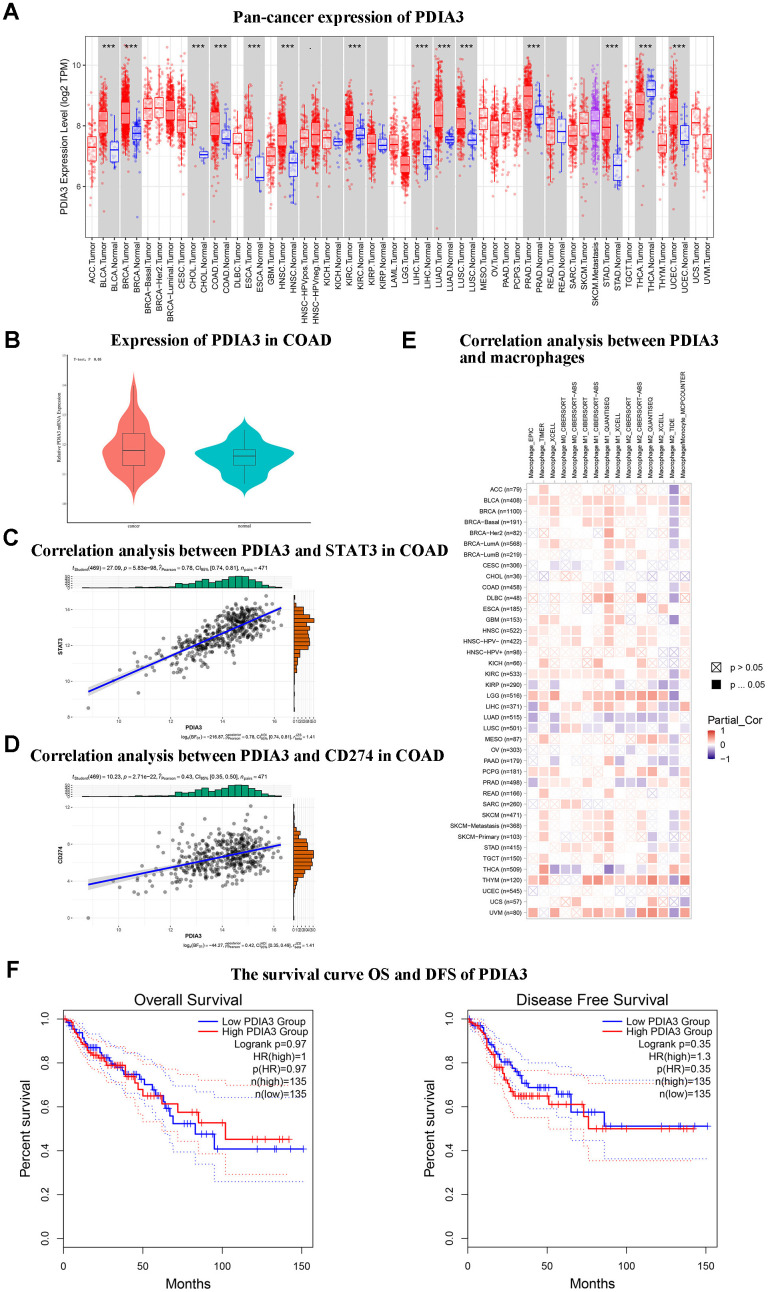
Results: Bioinformatics exploration exposed PDIA3's elevated presence in diverse cancers, with a marked expression in colorectal cancer, as per TCGA and GEO repositories. Correlative studies showed PDIA3 positively aligning with STAT3 and CD274, the latter also associated with monocyte-derived macrophages. Comparative analysis of colorectal neoplasms and normal colon samples unveiled heightened levels of PDIA3 markers which, when overexpressed in SW480 cells, escalated tumorigenicity and oncogenic behaviors, with a noted decrease upon PD-1 monoclonal antibody intervention.

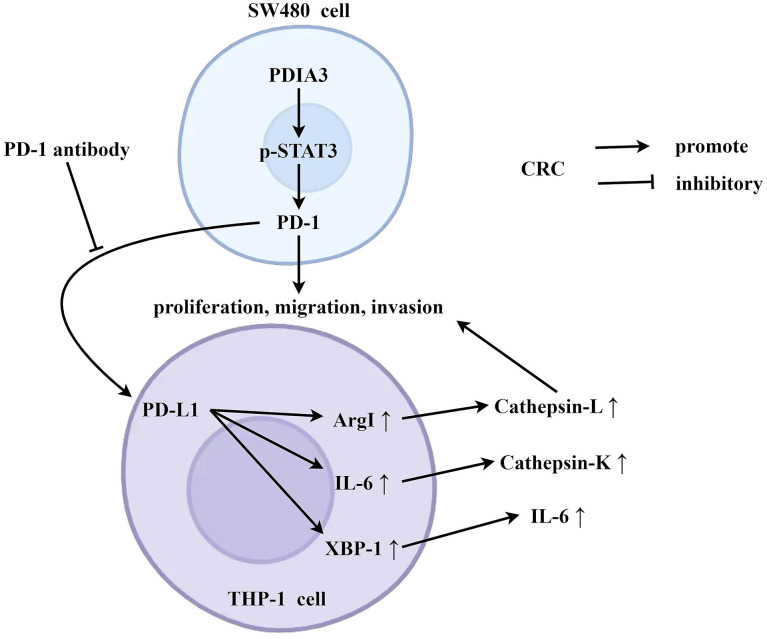
Conclusions: PDIA3 augments the M2 polarization of tumor-associated macrophages via modulation of the STAT3/PD-1 cascade, thus invigorating the tumorous proliferation and dissemination in colorectal cancer. Such revelations position PDIA3 as an auspicious target for PD-1 blockade therapeutics, offering a promising foundation for rectifying colorectal carcinoma.

Keywords: PDIA3; cancer microecology; colorectal neoplasm; immunological subterfuge; neoplastic therapy.


Conflict of interest statement

CONFLICTS OF INTEREST: The authors declare that they have no conflicts of interest.

Figures

Figure 1
Figure 1
Bioinformatic analyses suggest that PDIA3 exhibits notably elevated expression in colorectal cancer (CRC) and demonstrates significant associative upregulation with STAT3, CD274, and monocyte/macrophage levels. (A) Widespread expression of PDIA3 across multiple cancer types. Statistical comparison via T-test, P<0.001. (B) Differential expression of PDIA3 within colorectal adenocarcinoma (COAD). Statistical comparison via T-test, P<0.05. (C) Evaluative correlation between PDIA3 and STAT3 expressions in COAD. Correlation coefficient (R) = 0.78, P=0.85E-98. (D) Evaluative correlation between PDIA3 and CD274 expressions in COAD. Correlation coefficient (R) = 0.43, P=2.71E-22. (E) Analysis of the correlation between PDIA3 and macrophages in pan cancer. Statistical comparison via T-test, P<0.05. (F) Survival analysis depicting Overall Survival (OS) (Log-rank P=0.97) and Disease-Free Survival (DFS) (Log-rank P=0.35) as influenced by PDIA3 expression in COAD.
Figure 2
Figure 2
Elevated levels of PDIA3, phosphorylated STAT3 (p-STAT3), and PD-1 are present in CRC tissues. (A) Immunohistochemical assessment of PDIA3 protein in CRC and adjacent normative tissue. Statistical evaluation via T-test* *P < 0.01 versus normative control (n=96 pairs). (B) RT-qPCR quantification of PDIA3 mRNA in CRC and normative tissue (n=96 pairs). Statistical evaluation via T-test,* *P < 0.01 versus normative control. (C) Total protein isolation from tumor specimens with RIPA buffer, subsequently quantified via the BCA assay. Relative protein expression levels of PDIA3, p-STAT3, and PD-1 were determined after densitometric analysis from three independent samples. Statistical evaluation via T-test, * *P < 0.01 versus normative control.
Figure 3
Figure 3
In vivo experiments demonstrate that PDIA3 significantly contributes to oncogenesis. (A) SW480 cells, genetically modified to either overexpress or suppress PDIA3, were subcutaneously injected into nude mice to create CRC tumor models. Statistical evaluation via T-test,* *P < 0.01 versus normative control. (B) RT-qPCR detection of PDIA3 mRNA in CRC tumors. Statistical evaluation via T-test,* *P < 0.01 versus normative control. (C) Western blot detection of PDIA3 protein in CRC tumors. Statistical evaluation via T-test,* *P < 0.01 versus normative control.
Figure 4
Figure 4
PDIA3 facilitates M2 polarization of tumor-associated macrophages and augments tissue protease secretion through modulation of STAT3/PD-1 signaling. (A) Comparison of p-STAT3 and PD-1 protein levels in cells with PDIA3 overexpression versus or-NC control, and PDIA3 knockdown versus sh-NC control, as determined by western blot (n=3 per group). Statistical evaluation via Ttest,* *P < 0.01 versus corresponding control. (B) Protein expression of XBP-1, arginase-1, cathepsin-L, cathepsin-K, and IL-6 in PDIA3-altered THP-1 cells, assessed by western blot (n=3 per group). Statistical evaluation via T-test,* *P < 0.01 versus corresponding control.
Figure 5
Figure 5
Application of PD-1 antibody to substantiate PDIA3’s role in endorsing M2 polarization of tumor-associated macrophages and prompting tissue protease secretion, mediated by STAT3/PD-1 signaling modulation. (A) Protein levels of pSTAT3 and PD-1 in cells with PDIA3 overexpression versus or-NC control, and PD-1 inhibitor versus PD-1 NC treatment assessed by western blot (n=3 per group). Statistical evaluation via T-test,* *P < 0.01 versus corresponding control. (B) Levels of XBP-1, arginase-1, cathepsin-L, cathepsin-K, and IL-6 proteins in THP-1 cells under differing conditions of PDIA3 expression and PD-1 inhibition, determined via western blot (n=3 per group). Statistical evaluation via T-test,* *P < 0.01 versus corresponding control.
Figure 6
Figure 6
PDIA3 enhances the migratory capacity of CRC cells through the regulation of STAT3/PD-1 signaling, along with influencing tumor-associated macrophage M2 polarization and tissue protease secretion. (A) Transwell migration and invasion assay results for SW480 cells, with comparative analysis between PDIA3 overexpression and OE-NC control, and PD-1 inhibitor and PD-1 NC treatments (n=3 per group, magnification 200x). Statistical evaluation via T-test,* *P < 0.01 versus corresponding control. (B) Wound healing assay results depicting cellular migration over 24 hours between SW480 cells with PDIA3 overexpression versus or-NC control, and PD-1 inhibitor versus PD-1 NC treatments (n=3 per group, magnification 200x). Statistical evaluation via T-test,* *P < 0.01 versus corresponding control.
Figure 7
Figure 7
PDIA3 promotes CRC cellular proliferation by modulating STAT3/PD-1 signaling pathway, facilitating tumor associated macrophage M2 polarization, and increasing tissue protease secretion. (A) Colony formation assay highlighting the differences in colony numbers of SW480 cells between PDIA3 overexpression versus or-NC control, and PD-1 inhibitor versus PD-1 NC treatments, observed after 14 days (n=3 per group). Statistical evaluation via T-test,* *P < 0.01 versus corresponding control. (B) CCK8 assay provides a quantitative comparison of cell proliferation rates at 24, 48, and 96 hours, indicated by absorbance measurements at 450 nm for SW480 cells with PDIA3 overexpression versus or-NC control, and PD-1 inhibitor versus PD-1 NC treatments (n=3 per group). Statistical evaluation via T-test,* *P < 0.01 versus corresponding control.
Figure 8
Figure 8
PDIA3 is pivotal in accentuating colorectal cancer proliferation and metastasis, orchestrated through strategic regulation of the STAT3/PD-1 signaling axis and the concurrent promotion of tumor-associated macrophage M2 polarization. Under the condition of co-culture of tumor-associated macrophages and SW480 cells, PDIA3 can promote the expression of PD-1 by enhancing the phosphorylation of STAT3, and PD-1 is then secreted extracellularly. PD-1 acts on the PD-L1 receptor of SW480 cells, thereby promoting the expression of arg1, IL-6, and XBP-1, and inhibiting the secretion of cathepsin L, cathepsin K, and IL-6. This further promotes the migration, invasion, and proliferation abilities of SW480 cells.

Similar articles

Cited by

References

    1. Siegel RL, Wagle NS, Cercek A, Smith RA, Jemal A. Colorectal cancer statistics, 2023. CA Cancer J Clin. 2023; 73:233–54. 10.3322/caac.21772 - DOI - PubMed
    1. Gobert AP, Latour YL, Asim M, Barry DP, Allaman MM, Finley JL, Smith TM, McNamara KM, Singh K, Sierra JC, Delgado AG, Luis PB, Schneider C, et al.. Protective Role of Spermidine in Colitis and Colon Carcinogenesis. Gastroenterology. 2022; 162:813–27.e8. 10.1053/j.gastro.2021.11.005 - DOI - PMC - PubMed
    1. Sung H, Ferlay J, Siegel RL, Laversanne M, Soerjomataram I, Jemal A, Bray F. Global Cancer Statistics 2020: GLOBOCAN Estimates of Incidence and Mortality Worldwide for 36 Cancers in 185 Countries. CA Cancer J Clin. 2021; 71:209–49. 10.3322/caac.21660 - DOI - PubMed
    1. Keum N, Giovannucci E. Global burden of colorectal cancer: emerging trends, risk factors and prevention strategies. Nat Rev Gastroenterol Hepatol. 2019; 16:713–32. 10.1038/s41575-019-0189-8 - DOI - PubMed
    1. Li N, Lu B, Luo C, Cai J, Lu M, Zhang Y, Chen H, Dai M. Incidence, mortality, survival, risk factor and screening of colorectal cancer: A comparison among China, Europe, and northern America. Cancer Lett. 2021; 522:255–68. 10.1016/j.canlet.2021.09.034 - DOI - PubMed

Publication types

MeSH terms