

Everolimus alleviates CD4+ T cell inflammation by regulating autophagy and cellular redox homeostasis
- PMID: 38761287
- PMCID: PMC11493941
- DOI: 10.1007/s11357-024-01187-z
Everolimus alleviates CD4+ T cell inflammation by regulating autophagy and cellular redox homeostasis
Abstract
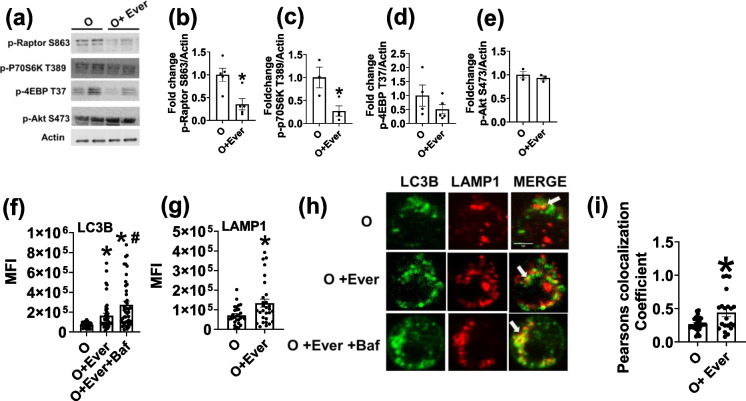
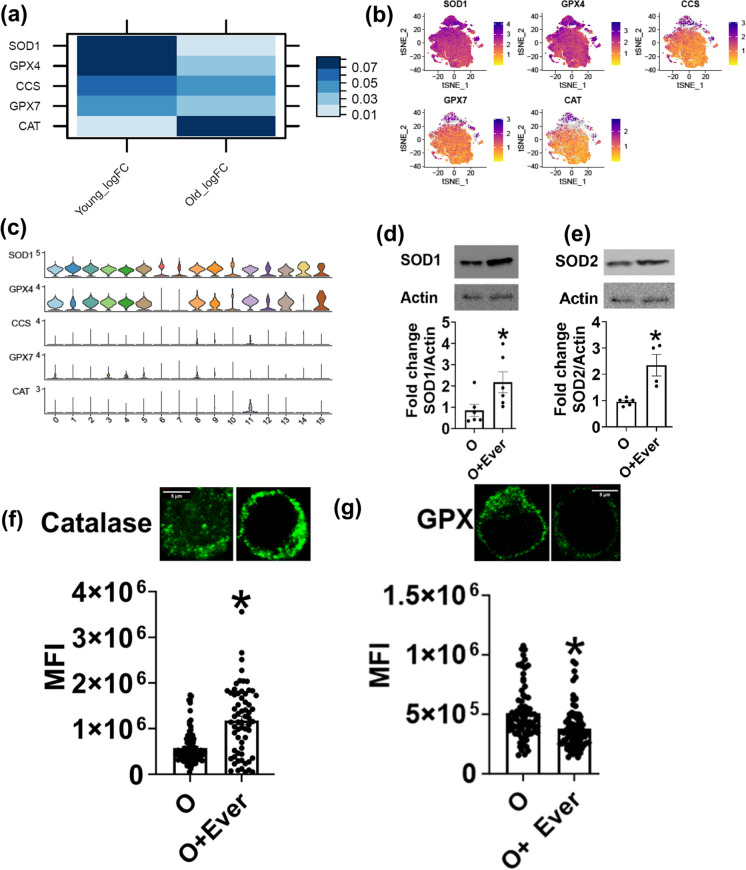
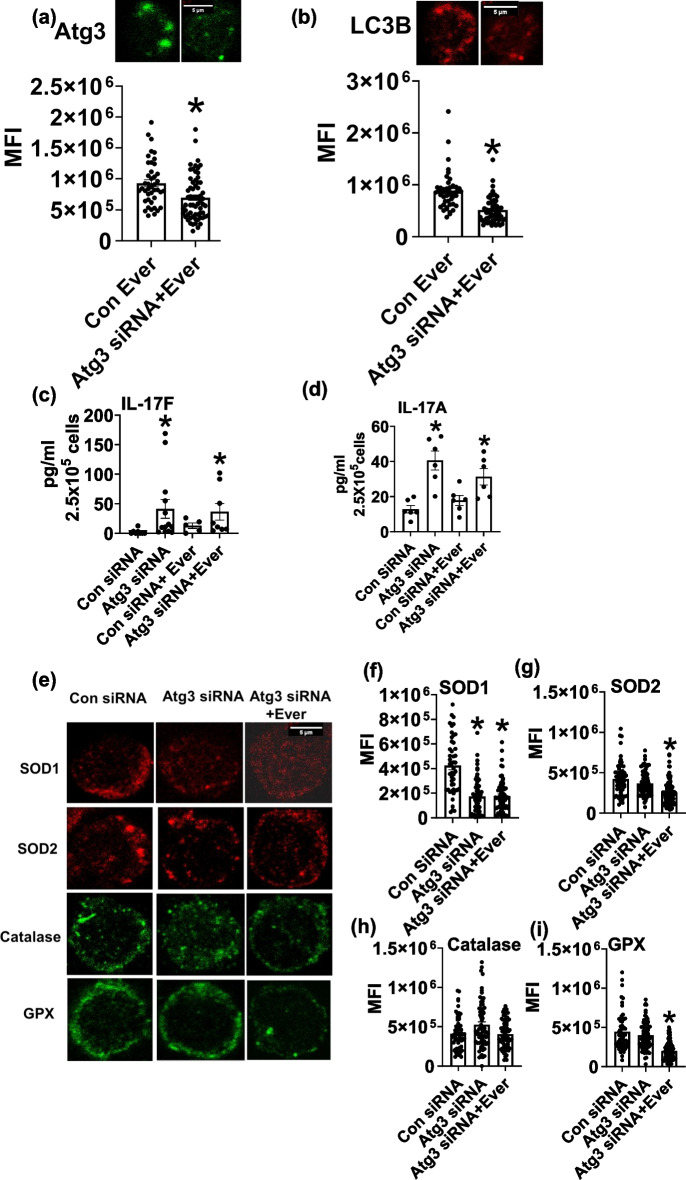
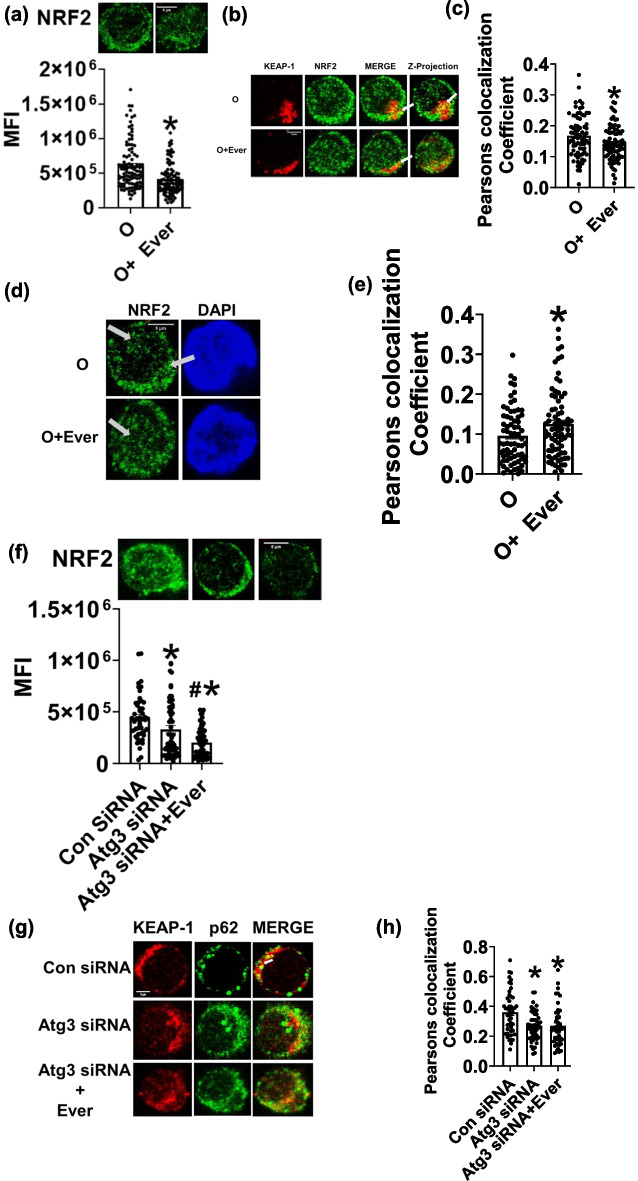
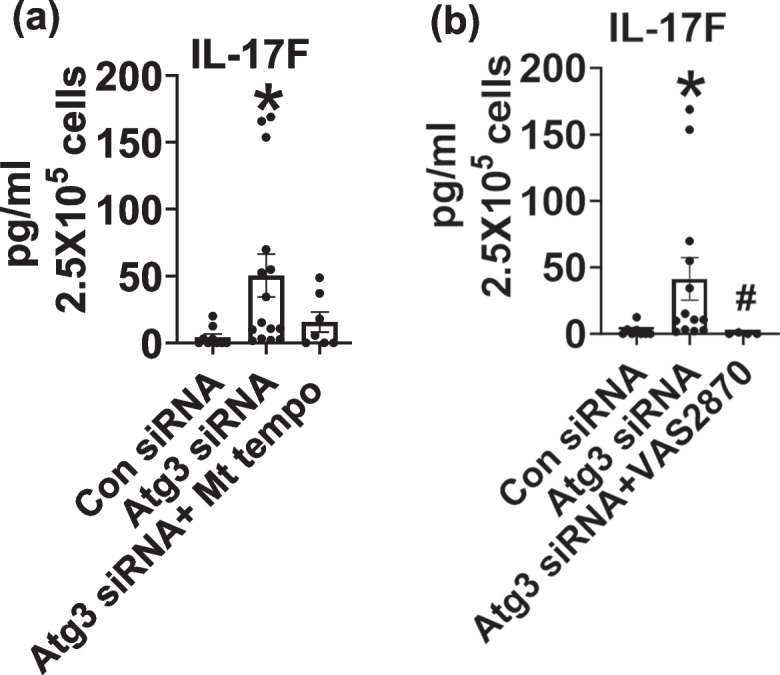
Aging is associated with the onset and progression of multiple diseases, which limit health span. Chronic low-grade inflammation in the absence of overt infection is considered the simmering source that triggers age-associated diseases. Failure of many cellular processes during aging is mechanistically linked to inflammation; however, the overall decline in the cellular homeostasis mechanism of autophagy has emerged as one of the top and significant inducers of inflammation during aging, frequently known as inflammaging. Thus, physiological or pharmacological interventions aimed at improving autophagy are considered geroprotective. Rapamycin analogs (rapalogs) are known for their ability to inhibit mTOR and thus regulate autophagy. This study assessed the efficacy of everolimus, a rapalog, in regulating inflammatory cytokine production in T cells from older adults. CD4+ T cells from older adults were treated with a physiological dose of everolimus (0.01 µM), and indices of autophagy and inflammation were assessed to gain a mechanistic understanding of the effect of everolimus on inflammation. Everolimus (Ever) upregulated autophagy and broadly alleviated inflammatory cytokines produced by multiple T cell subsets. Everolimus's ability to alleviate the cytokines produced by Th17 subsets of T cells, such as IL-17A and IL-17F, was dependent on autophagy and antioxidant signaling pathways. Repurposing the antineoplastic drug everolimus for curbing inflammaging is promising, given the drug's ability to restore multiple cellular homeostasis mechanisms.
Keywords: Autophagy; CD4+ T cells; Everolimus; Inflammaging; NRF2; ROS; Th17 cytokines.
© 2024. The Author(s), under exclusive licence to American Aging Association.
Conflict of interest statement
The authors declare no competing interests.
Figures

Similar articles
-
Metformin Enhances Autophagy and Normalizes Mitochondrial Function to Alleviate Aging-Associated Inflammation.Cell Metab. 2020 Jul 7;32(1):44-55.e6. doi: 10.1016/j.cmet.2020.04.015. Epub 2020 May 12. Cell Metab. 2020. PMID: 32402267 Free PMC article.
-
CD4+ T Cells at the Center of Inflammaging.Cell Metab. 2020 Jul 7;32(1):4-5. doi: 10.1016/j.cmet.2020.04.016. Epub 2020 May 12. Cell Metab. 2020. PMID: 32402265 Free PMC article.
-
Dual targeting of mTOR/IL-17A and autophagy by fisetin alleviates psoriasis-like skin inflammation.Front Immunol. 2023 Jan 18;13:1075804. doi: 10.3389/fimmu.2022.1075804. eCollection 2022. Front Immunol. 2023. PMID: 36741386 Free PMC article.
-
Balanced basal-levels of ROS (redox-biology), and very-low-levels of pro-inflammatory cytokines (cold-inflammaging), as signaling molecules can prevent or slow-down overt-inflammaging, and the aging-associated decline of adaptive-homeostasis.Exp Gerontol. 2023 Feb;172:112067. doi: 10.1016/j.exger.2022.112067. Epub 2022 Dec 16. Exp Gerontol. 2023. PMID: 36535453 Review.
-
Autophagy of naïve CD4+ T cells in aging - the role of body adiposity and physical fitness.Expert Rev Mol Med. 2023 Jan 19;25:e9. doi: 10.1017/erm.2023.2. Expert Rev Mol Med. 2023. PMID: 36655333 Review.
Cited by
-
mTOR Inhibitor Everolimus Modulates Tumor Growth in Small-Cell Carcinoma of the Ovary, Hypercalcemic Type and Augments the Drug Sensitivity of Cancer Cells to Cisplatin.Biomedicines. 2024 Dec 24;13(1):1. doi: 10.3390/biomedicines13010001. Biomedicines. 2024. PMID: 39857585 Free PMC article.
-
The mTOR Signaling Pathway: Key Regulator and Therapeutic Target for Heart Disease.Biomedicines. 2025 Feb 7;13(2):397. doi: 10.3390/biomedicines13020397. Biomedicines. 2025. PMID: 40002810 Free PMC article. Review.
References
-
- Mannick JB, Del Giudice G, Lattanzi M, Valiante NM, Praestgaard J, Huang B, Lonetto MA, Maecker HT, Kovarik J, Carson S, et al. MTOR inhibition improves immune function in the elderly. Sci Transl Med. 2014;6(268):ra179. 10.1126/scitranslmed.3009892. - PubMed
MeSH terms
Substances
Grants and funding
LinkOut - more resources
Full Text Sources
Molecular Biology Databases
Research Materials
Miscellaneous
