. 2024 May 18;150(5):261.
doi: 10.1007/s00432-024-05790-7.

Genome-wide investigation of lncRNAs revealed their tight association with gastric cancer

Affiliations

Genome-wide investigation of lncRNAs revealed their tight association with gastric cancer

Tong Liu et al. J Cancer Res Clin Oncol. .

Abstract

Background: Gastric cancer (GC) is a significant health issue globally, ranking as the fifth most common cancer with over 10,000 new cases reported annually. Long non-coding RNA (lncRNA) has emerged as a critical player in cellular functions, influencing GC's development, growth, metastasis, and prognosis. However, our understanding of lncRNA's role in the pathogenesis of GC remains limited. Therefore, it is particularly important to explore the relationship between lncRNA and gastric cancer.

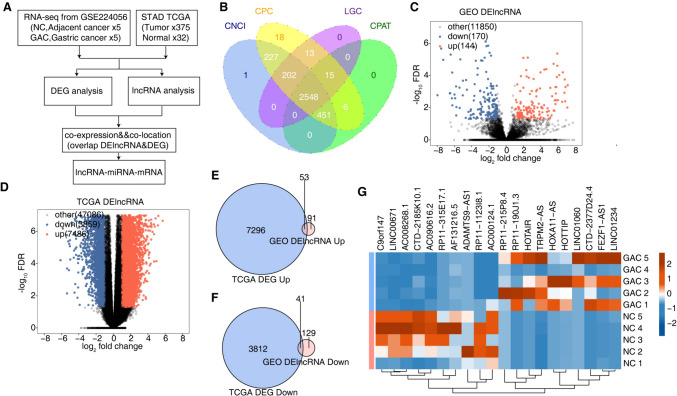
Methods: we conducted a comprehensive analysis of RNA sequencing data from the GEO database and stomach adenocarcinoma (STAD) data from the TCGA database to identify lncRNAs that exhibit altered expression levels in GC and the mechanisms underlying lncRNA-mediated transcription and post-transcriptional regulation were explored.

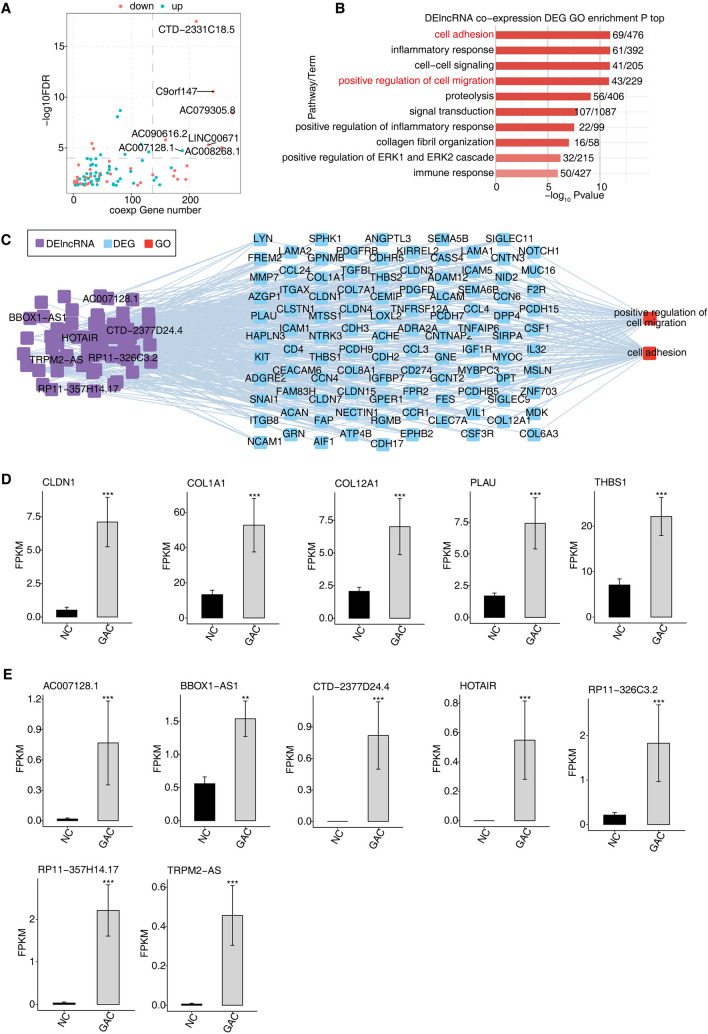
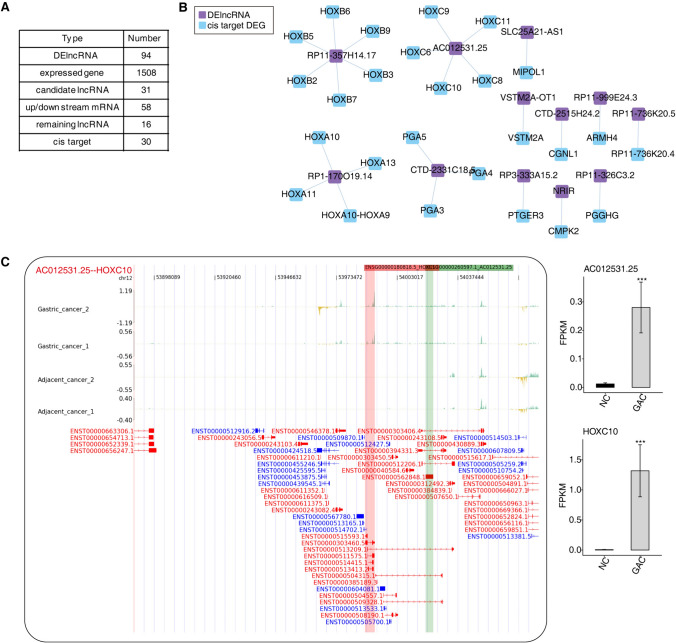
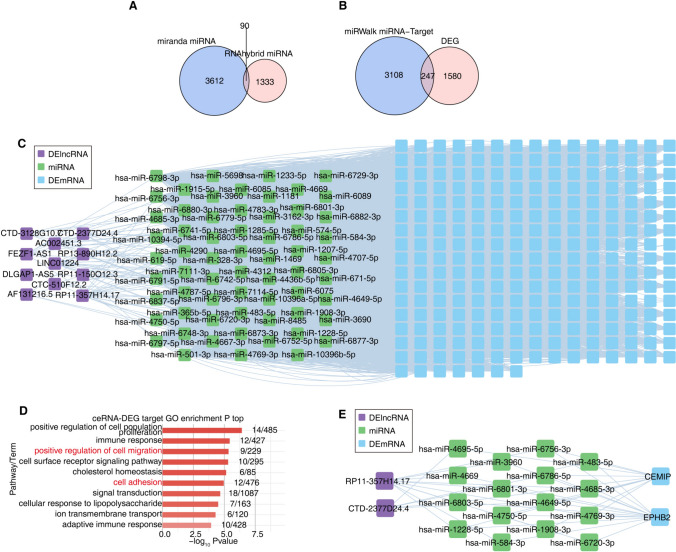
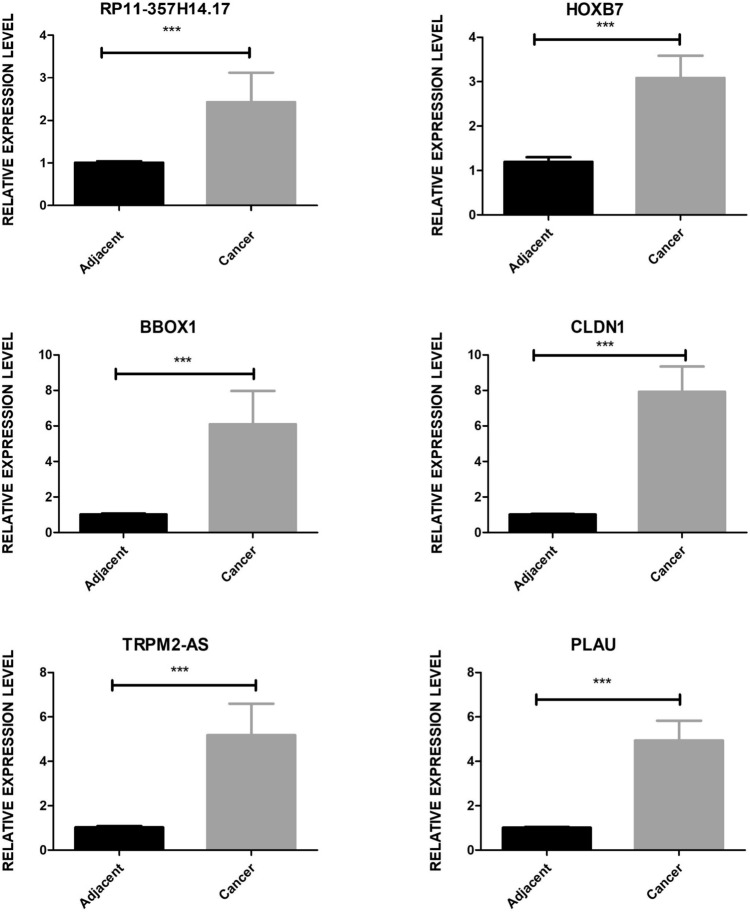
Results: This study uncovered 94 lncRNAs with differential expression and, through co-expression analysis, linked these to 1508 differentially expressed genes (DEGs). GO functional enrichment analysis highlighted that these DEGs are involved in critical pathways, such as cell adhesion and the positive regulation of cell migration. By establishing a lncRNA-miRNA-mRNA regulatory network, we found that the ceRNA mechanism, particularly involving RP11-357H14.17 and CTD-2377D24.4, could play a role in GC progression. Experimental validation of selected differentially expressed lncRNAs and mRNAs (including RP11-357H14.17-CLDN1, BBOX1, TRPM2-AS, CLDN1, PLAU, HOXB7) confirmed the RNA-seq results.

Conclusions: Overall, our findings highlight the critical role of the lncRNA-mRNA regulatory network in the development and progression of GC, offering potential biomarkers for diagnosis and targets for innovative treatment strategies.

Keywords: Co-expression network; Gastric cancer; lncRNA; mRNA.


Conflict of interest statement

The authors declare that they have no known competing financial interests or personal relationships that could have appeared to influence the work reported in this paper.

Figures

Fig. 1
Fig. 1
Transcriptional analysis of differential expression lncRNA in GAC and NC. A A flow chart depicting the analytical route. B The overlap of lncRNA was predicted by CPC, CNCI, CPAT and LGC. C Volcano plot displaying all DElncRNAs between GAC and NC samples with DESeq2. FDR ≤ 0.05 and FC (fold change) ≥ 2 or ≤ 0.5. D Volcano plot demonstrated all DElncRNA between GAC and NC samples with DESeq2. FDR ≤ 0.05 and FC (fold change) ≥ 2 or ≤ 0.5. E Venn plot showing the overlapping up-regulated differential genes in GEO data and STAD data. F Venn plot displaying the overlapping down-regulated differential genes in GEO data and STAD data. G The heatmap diagram showing the FPKM of the top 10 DELncRNA
Fig. 2
Fig. 2
Trans-regulatory of DE IncRNAs associated with GC. A Scatter plot depicting diDElncRNAs by GAC compared with NC samples and the number of co-expressed diDEGs. Red points depict up-regulated lncRNAs involved in co-expression pairs, while blue points indicate the down-regulated lncRNAs. The cutoffs of FDR ≤ 0.05 and Pearson coefficient ≥ 0.9 were applied to identify the co-expression pairs. B Bar plot displaying the top 10 most enriched GO biological process results of DElncRNA co-expressed by DEG. C Co-expression analysis of DElncRNA and DEG of key GO biological process results. The cutoffs of P value ≤ 0.01 and Pearson coefficient ≥ 0.9 or ≤ -0.9 were used to identify the co-expression pairs—the network showing the co-expressed GO pathway for DElncRNA and DEG. D Bar plot demonstrating expression pattern and statistical difference of DEGs. E Bar plot showing expression pattern and statistical difference of DElncRNAs. The error bars represent mean ± SEM.*P value ≤ 0.05, **P value ≤ 0.01, ***P value ≤ 0.001 in both D and E
Fig. 3
Fig. 3
Cis-regulatory genes of DE IncRNAs in GC. A For each significant DElncRNA, we extracted gene information for regions located within 10 KB upstream and downstream. We calculated the Pearson correlation coefficient between DElncRNAs and DEGs to analyze co-expression. We then identified lncRNA-target relationship pairs with an absolute correlation coefficient value greater than 0.9 and a P value ≤ 0.01. We combined two data sets to identify cis targets of lncRNAs. DElncRNA: This represents the count of significantly differentially expressed lncRNAs identified when comparing multiple groups within the project (the union set); Expressed gene: number of expressed genes detected in all samples; Candidate lncRNA: The count of differentially expressed lncRNAs located within 10 KB upstream and downstream of regions of interest. Up/downstream mRNA: the number of genes within 10 KB upstream and downstream of lncRNA; Remaining lncRNA: The number of lncRNAs that satisfy both the location criteria and the co-expression relationship criteria; cis target: The count of lncRNA cis-regulatory targets that fulfill the specified location criteria and co-expression relationship, proceeding to GO and KEGG analysis. Network diagram illustrating all cis target DEGs that are regulated by DElncRNAs. B. Network diagram depicting all cis target DEGs regulated by DElncRNA. C. The reads distribution displaying LncRNA AC012531.25 and its regulated cis target DEG HOXC10. Bar plot showing the expression of LncRNA, and its regulated cis target DEGs. *P value ≤ 0.05, **P value ≤ 0.01, ***P value ≤ 0.001
Fig. 4
Fig. 4
Prediction of targeted miRNAs. A Venn diagram of the predicted miRNA. B Venn diagram depicting the overlap of miRNA target genes and DEGs between GAC and NC samples. C The network diagram displaying all the miRNAs regulated by DElncRNA and targeted DEGs of miRNAs. D The top 10 most enriched GO terms were shown for overlap up-regulated DEGs. E The network diagram revealing all the miRNAs regulated by key DElncRNA and the targeted key DEGs of miRNAs
Fig. 5
Fig. 5
Bar plot depicting the validation results of three lncRNAs and three mRNAs by qRT-PCR experiment. ***p < 0.001, two-tail unpaired t-test

Similar articles

Cited by

References

    1. Ai C, Zhang J, Lian S, Ma J, Győrffy B, Qian Z, Han Y, Feng Q (2020) FOXM1 functions collaboratively with PLAU to promote gastric cancer progression. J Cancer 11(4):788–794. 10.7150/jca.37323. (PMID: 31949481; PMCID: PMC6959008) - PMC - PubMed
    1. Alsina M, Arrazubi V, Diez M, Tabernero J (2023) Current developments in gastric cancer: from molecular profiling to treatment strategy. Nat Rev Gastroenterol Hepatol 20(3):155–170. 10.1038/s41575-022-00703-w. (Epub 2022 Nov 7 PMID: 36344677) - PubMed
    1. Amirmahani F, Ebrahimi N, Askandar RH et al (2021) Long noncoding RNAs CAT2064 and CAT2042 may function as diagnostic biomarkers for prostate cancer by affecting target MicrorRNAs. Ind J Clin Biochem. 10.1007/s12291-021-00999-6 - PMC - PubMed
    1. Amirmahani F, Asadi MH, Jannat AF (2023b) LncRNA MIAT promotes the proliferation and invasion of colorectal cancer via suppressing apoptosis and senescence. Middle East J Cancer 14(2):219–229. 10.30476/mejc.2022.92233.1651
    1. Amirmahani F, Vallian S, Asadi MH (2023a) The LncRNA MIAT is identified as a regulator of stemness-associated transcript in glioma. Mol Biol Rep 50(1):517–530. 10.1007/s11033-022-07962-5. (Epub 2022 Nov 9 PMID: 36352177) - PubMed

MeSH terms