

Development and Validation of a Nomogram for Predicting Nutritional Risk Based on Frailty Scores in Older Stroke Patients
- PMID: 38761298
- PMCID: PMC11102373
- DOI: 10.1007/s40520-023-02689-0
Development and Validation of a Nomogram for Predicting Nutritional Risk Based on Frailty Scores in Older Stroke Patients
Abstract
Background: In older stroke patients with frailty, nutritional deficiencies can amplify their susceptibility, delay recovery, and deteriorate prognosis. A precise predictive model is crucial to assess their nutritional risk, enabling targeted interventions for improved clinical outcomes.
Objective: To develop and externally validate a nutritional risk prediction model integrating general demographics, physical parameters, psychological indicators, and biochemical markers. The aim is to facilitate the early identification of older stroke patients requiring nutritional intervention.
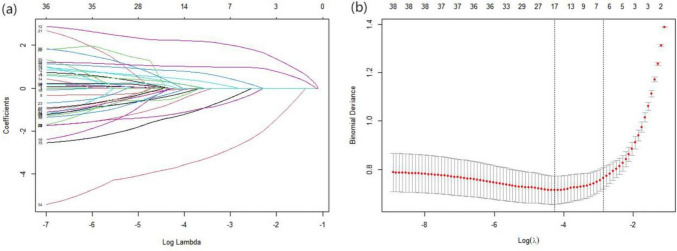
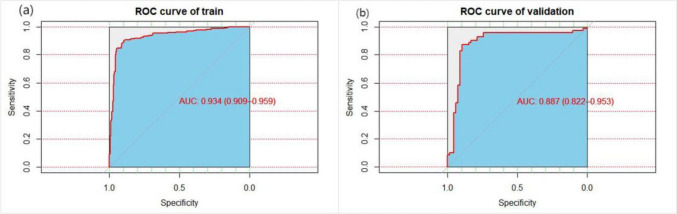
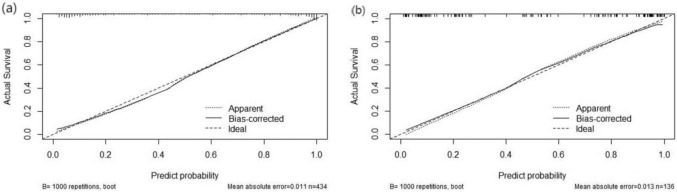
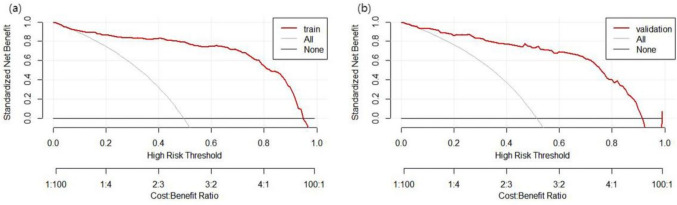
Methods: This was a multicenter cross-sectional study. A total of 570 stroke patients were included, 434 as the modeling set and 136 as the external validation set. The least absolute shrinkage selection operator (LASSO) regression analysis was used to select the predictor variables. Internal validation was performed using Bootstrap resampling (1000 iterations). The nomogram was constructed based on the results of logistic regression. The performance assessment relied on the receiver operating characteristic curve (ROC), Hosmer--Lemeshow test, calibration curves, Brier score, and decision curve analysis (DCA).
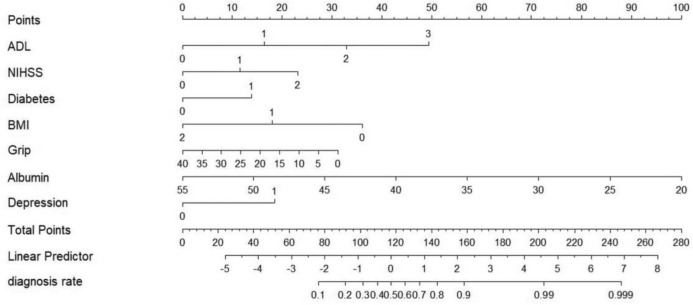
Results: The predictive nomogram encompassed seven pivotal variables: Activities of Daily Living (ADL), NIHSS score, diabetes, Body Mass Index (BMI), grip strength, serum albumin levels, and depression. Together, these variables comprehensively evaluate the overall health and nutritional status of elderly stroke patients, facilitating accurate assessment of their nutritional risk. The model exhibited excellent accuracy in both the development and external validation sets, evidenced by AUC values of 0.934 and 0.887, respectively. Such performance highlights its efficacy in pinpointing elderly stroke patients who require nutritional intervention. Moreover, the model showed robust goodness of fit and practical applicability, providing essential clinical insights to improve recovery and prognosis for patients prone to malnutrition.
Conclusions: Elderly individuals recovering from stroke often experience significant nutritional deficiencies. The nomogram we devised accurately assesses this risk by combining physiological, psychological, and biochemical metrics. It equips healthcare providers with the means to actively screen for and manage the nutritional care of these patients. This tool is instrumental in swiftly identifying those in urgent need of targeted nutritional support, which is essential for optimizing their recovery and managing their nutrition more effectively.
Keywords: Elderly people; Frailty; Nomogram; Nutritional risk; Primary care; Stroke.
© 2024. The Author(s).
Conflict of interest statement
The authors declare no competing interests.
Figures
Similar articles
-
Development and validation of a predictive model for frailty risk in older adults with cardiovascular-metabolic comorbidities.Front Public Health. 2025 Apr 22;13:1561845. doi: 10.3389/fpubh.2025.1561845. eCollection 2025. Front Public Health. 2025. PMID: 40331117 Free PMC article.
-
Construction and validation of a predictive model for the risk of malnutrition in hospitalized patients over 65 years of age with malignant tumours: a single-centre retrospective cross-sectional study.PeerJ. 2024 Dec 10;12:e18685. doi: 10.7717/peerj.18685. eCollection 2024. PeerJ. 2024. PMID: 39677952 Free PMC article.
-
Development and validation of frailty risk prediction model for elderly patients with coronary heart disease.BMC Geriatr. 2024 Sep 7;24(1):742. doi: 10.1186/s12877-024-05320-7. BMC Geriatr. 2024. PMID: 39244543 Free PMC article.
-
The risk prediction models for cognitive frailty in the older people in China: a systematic review and meta-analysis.BMC Geriatr. 2025 May 22;25(1):365. doi: 10.1186/s12877-025-05961-2. BMC Geriatr. 2025. PMID: 40405068 Free PMC article.
-
Systematic nutritional screening and assessment in older patients: Rationale for its integration into oncology practice.Eur J Cancer. 2024 Sep;209:114237. doi: 10.1016/j.ejca.2024.114237. Epub 2024 Jul 22. Eur J Cancer. 2024. PMID: 39096852 Review.
Cited by
-
Predictive nomogram for early detection of invasive fungal disease deterioration --- a 10-year retrospective cohort study.BMC Infect Dis. 2025 May 7;25(1):673. doi: 10.1186/s12879-025-11030-1. BMC Infect Dis. 2025. PMID: 40335908 Free PMC article.
-
Dynamic Nomogram for Predicting the Fall Risk of Stroke Patients: An Observational Study.Clin Interv Aging. 2025 Feb 25;20:197-212. doi: 10.2147/CIA.S486252. eCollection 2025. Clin Interv Aging. 2025. PMID: 40028259 Free PMC article.
-
A nomogram for predicting the risk of malnutrition in hospitalized older adults: a retrospective study.BMC Geriatr. 2025 May 16;25(1):345. doi: 10.1186/s12877-025-05990-x. BMC Geriatr. 2025. PMID: 40380103 Free PMC article.
References
-
- Cui LY (2014) China Medical Science and Technology Press. Neurology.
Publication types
MeSH terms
Grants and funding
- I01 CX002022/CX/CSRD VA/United States
- H22014/Sichuan Nursing Association's Nursing Research Project
- 2022LHFSSYB-07/the Joint Research Fund of Chengdu Medical College and the Second Affiliated Hospital of Chengdu Medical College
- YCX2022-01-45/Graduate Student Research Innovation Fund of Chengdu Medical College
LinkOut - more resources
Full Text Sources
Medical
