. 2024 May 28;43(5):114257.
doi: 10.1016/j.celrep.2024.114257. Epub 2024 May 17.

Compensation between FOXP transcription factors maintains proper striatal function

Affiliations

Compensation between FOXP transcription factors maintains proper striatal function

Newaz I Ahmed et al. Cell Rep. .

Abstract

Spiny projection neurons (SPNs) of the striatum are critical in integrating neurochemical information to coordinate motor and reward-based behavior. Mutations in the regulatory transcription factors expressed in SPNs can result in neurodevelopmental disorders (NDDs). Paralogous transcription factors Foxp1 and Foxp2, which are both expressed in the dopamine receptor 1 (D1) expressing SPNs, are known to have variants implicated in NDDs. Utilizing mice with a D1-SPN-specific loss of Foxp1, Foxp2, or both and a combination of behavior, electrophysiology, and cell-type-specific genomic analysis, loss of both genes results in impaired motor and social behavior as well as increased firing of the D1-SPNs. Differential gene expression analysis implicates genes involved in autism risk, electrophysiological properties, and neuronal development and function. Viral-mediated re-expression of Foxp1 into the double knockouts is sufficient to restore electrophysiological and behavioral deficits. These data indicate complementary roles between Foxp1 and Foxp2 in the D1-SPNs.

Keywords: CP: Molecular biology; CP: Neuroscience; FOXP1; FOXP2; autism; neurogenomics; spiny projection neurons; striatum.


Conflict of interest statement

Declaration of interests The authors declare no competing interests.

Figures
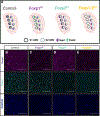
Figure 1.
Figure 1.. Validation of conditional knockouts
(A) Schematic showing the genotypes used in this study. D1-cre-mediated loss of Foxp1 (Foxp1D1; purple), Foxp2 (Foxp2D1; cyan), or both (Foxp1/2D1; gold), as well as Cre-negative controls (gray). (B–E) Representative images of immunohistochemistry for Foxp1, Foxp2, and Hoechst in control (B), Foxp1D1 (C), Foxp2D1 (D), and Foxp1/2D1 (E). All images from P56 mice. Scale bars represent 750 μM. 20× magnification.
Figure 2.
Figure 2.. Loss of both Foxp1 and Foxp2 results in amplified loss of transcriptional regulation in D1-SPNs in juvenile mice
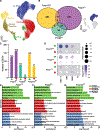
(A) UMAP of the neuron-only subset with colors indicating the different annotated cell types. D1-SPNs were used for DEG analysis. Genes were called differentially expressed if they had an adjusted p value <0.05 and logFC > |0.25|. (B) Semi-scaled Venn diagram showing number of unique and overlapping DEGs in each knockout condition in the D1-SPNs. Overlap of DEGs between conditions was assessed by a Fisher’s exact test enrichment. (C) Bar plots showing the number of up- and downregulated genes in each knockout condition. (D) Bubble chart showing enrichment of DEGs from each knockout condition. The −log10(p value) for each enrichment is also indicated. ASD, SFARI ASD-risk genes; ASD 1–3, SFARI ASD-risk genes with scores of 1–3; FMRP, fragile X syndrome; ID, intellectual disability. (E–G) GO analysis of (E) Foxp1D1, (F) Foxp2D1, and (G) Foxp1/2D1 DEGs reveals enrichment for terms associated with electrophysiological properties and synaptic properties.
Figure 3.
Figure 3.. Validation of DEGs in single knockouts using smFISH
(A) Ntn1 showed a downregulated expression in Foxp1D1 D1-SPNs. (B) This decrease is not in Foxp2D1 D1-SPNs. (C) Regions of interest (ROI) used to identify D1 SPNs (based on Tac1 expression) and puncta for Ntn1 transcripts were counted in each ROI from each each image. (D) Cdk7 also showed a reduced expression in Foxp1D1 D1-SPNs. (E) There was a trend toward a decrease in Foxp2D1 D1-SPNs (p = 0.08). (F) ROIs used to quantify puncta for Cdk7 in a similar fashion to Ntn1. Sample size (n) is the representative of the number of cells counted from each genotype. n = 482 cells, three mice (control, Ntn1); 403 cells, two mice (Foxp1D1, Ntn1); 392 cells, two mice (Foxp2D1, Ntn1); 536 cells, three mice (control, Cdk7); 636 cells, three mice (Foxp1D1, Cdk7); and 626 cells, three mice (Foxp2D1, Cdk7). Scale bars represent 50 mM and images were taken at 20× magnification. A Mann-Whitney’s U test was performed to assess statistical significance, *p < 0.05, ****p < 0.0001. All graphs are displayed as mean ± SEM.
Figure 4.
Figure 4.. Loss of both Foxp1 and Foxp2 dysregulates chromatin state in D1-SPNs
(A) UMAP showing annotated cell types in snATAC-seq analysis. D1-SPNs were used for further DAR analysis. A region was called differentially accessible if it hadan adjusted p value <0.05 and a logFC > |0.1375|. (B) Semi-scaled Venn diagram showing the number of unique and overlapping DARs within each condition. Overlap of DARs between conditions was assessed by a Fisher’s exact test. (C) Venn diagrams showing the overlap between DEGs and DARs in Foxp1/2D1 D1-SPNs. Overlap was assessed for significance by fold enrichment. (D) Bar plot showing the number of more open or more closed regions in each knockout condition. Motifs enriched in the DARs of each knockout were identified. (E) Semi-scaled Venn diagram showing the number of unique and overlapping motifs in each genotype. The significance of overlap of motifs was also assessedby a Fisher’s exact test. (F) Bar plot showing the number of motifs enriched within more open or more closed chromatin regions in each knockout condition. FOX motifs (GTAAACA) arehighlighted to indicate enrichment associated with more open regions. (G) Trackfile for Pde1c with the differentially accessible region highlighted.
Figure 5.
Figure 5.. Loss of Foxp1 results in KLeak-mediated hyperexcitability with amplification by further loss of Foxp2
(A) Number of action potentials recorded undercurrent-clamp conditions. (B) Input resistance recorded from the same cells inthe same conditions. (C) Contribution of KLeak channels was determined by finding the difference in current density plots. Values recorded in presence of cesium (see Figure S4D) were subtracted from those recorded in its absence (see Figure S4C) with no significant differences observed. (D) Schematic showing pAAV-hSYN-Foxp1-T2A-eGFP construct injected at P1. Dual presence of tdTomato and GFP was used to identify which neurons expressed the FOXP1 construct. (E and F) (E) Current-clamp recordings to record number of action potentials and (F) input resistance. Repeated-measures two-way ANOVA with Holm-Sidak’s post hoc test; only significant differences between knockouts and controls are shown. *p < 0.05 (A and B) n = 56 (control), 32 (Foxp1D1), 40 (Foxp2D1), and 41 (Foxp1/2D1). (C) n = 61, 43, 38, and 41. (E and F) n = 44 (control with control virus), 34 (Foxp1/2D1 with control virus), 32 (Foxp1/2D1 with FOXP1 construct), and 19 (control with FOXP1 construct). All graphs are displayed as mean ± SEM.
Figure 6.
Figure 6.. DEGs in adult SPNs have similar biological functions to those observed in juveniles
(A) UMAP of the neuron-only subset with colors indicating the cell types. D1-SPNs were used for further DEG analysis. Genes were called differentially expressed if they had an adjusted p value <0.05 and logFC > |0.25|. (B) Semi-scaled Venn diagram showing number of unique and overlapping DEGs in each knockout condition in the D1-SPNs. Overlap of DEGs between conditions was assessed by a Fisher’s exact test. (C) Bar plots showing the number of up- and downregulated genes in each knockout condition. (D) Bubble chart showing enrichment of DEGs from each knockout condition. The −log10(p value) for each enrichment is indicated. ASD, SFARI ASD-risk genes; ASD 1–3, SFARI ASD-risk genes with scores of 1–3; FMRP, fragile X syndrome; ID, intellectual disability. (E–G) Gene Ontology (GO) analysis of (E) Foxp1D1, (F) Foxp2D1, and (G) Foxp1/2D1 DEGs reveals enrichment for terms associated with electrophysiological properties and synaptic properties.
Figure 7.
Figure 7.. Loss of Foxp1 and Foxp2 results in impaired motor and social behavior
(A) Foxp1/2D1 mice show motor learning deficit as assessed by latency to fall using the rotarod paradigm. (B) Nest-building quality was assessed after single housing for 24 h with Foxp1D1 showing impairment, and this is amplified in Foxp1/2D1. (C and D) AAV-mediated re-expression of Foxp1 restored measures to baseline in rotarod (C) and nest building (D). (A and B) Behavior performed in control, Foxp1D1, Foxp2D1, and Foxp1/2D1. (C and D) Performed in control or Foxp1/2D1 mice with either control AAV9-hSYN1-eGFP or pAAV-hSYN-Foxp1-T2A-eGFP construct. (A–D) Two-way ANOVA with Tukey’s post hoc analysis used to determine significance. *p < 0.05, **p < 0.01, ***p < 0.001. n = 25 (control), 13 (Foxp1D1), 14 (Foxp2D1), and 16 (Foxp1/2D1) for (A); n = 15, 13, 18, and 12 respectively for (B); and n = 14, 11, 12, and 10 respectively for (C) and (D). All graphs are displayed as mean ± SEM.

Update of

Similar articles

Cited by

References

    1. Kreitzer AC, and Malenka RC (2008). Striatal plasticity and basal ganglia circuit function. Neuron 60, 543–554. 10.1016/j.neuron.2008.11.005. - DOI - PMC - PubMed
    1. Gerfen CR, and Surmeier DJ (2011). Modulation of striatal projection systems by dopamine. Annu. Rev. Neurosci. 34, 441–466. 10.1146/annurev-neuro-061010-113641. - DOI - PMC - PubMed
    1. Gerfen CR (1992). The neostriatal mosaic: multiple levels of compartmental organization. Trends Neurosci. 15, 133–139. - PubMed
    1. Fuccillo MV (2016). Striatal Circuits as a Common Node for Autism Pathophysiology. Front. Neurosci. 10, 27. 10.3389/fnins.2016.00027. - DOI - PMC - PubMed
    1. Graybiel AM, Aosaki T, Flaherty AW, and Kimura M (1994). The basal ganglia and adaptive motor control. Science 265, 1826–1831. 10.1126/science.8091209. - DOI - PubMed