. 2024 May 28;43(5):114251.
doi: 10.1016/j.celrep.2024.114251. Epub 2024 May 17.

Transient caspase-mediated activation of caspase-activated DNase causes DNA damage required for phagocytic macrophage differentiation

Affiliations

Transient caspase-mediated activation of caspase-activated DNase causes DNA damage required for phagocytic macrophage differentiation

Deepak Maurya et al. Cell Rep. .

Abstract

Phagocytic macrophages are crucial for innate immunity and tissue homeostasis. Most tissue-resident macrophages develop from embryonic precursors that populate every organ before birth to lifelong self-renew. However, the mechanisms for versatile macrophage differentiation remain unknown. Here, we use in vivo genetic and cell biological analysis of the Drosophila larval hematopoietic organ, the lymph gland that produces macrophages. We show that the developmentally regulated transient activation of caspase-activated DNase (CAD)-mediated DNA strand breaks in intermediate progenitors is essential for macrophage differentiation. Insulin receptor-mediated PI3K/Akt signaling regulates the apoptosis signal-regulating kinase 1 (Ask1)/c-Jun kinase (JNK) axis to control sublethal levels of caspase activation, causing DNA strand breaks during macrophage development. Furthermore, caspase activity is also required for embryonic-origin macrophage development and efficient phagocytosis. Our study provides insights into developmental signaling and CAD-mediated DNA strand breaks associated with multifunctional and heterogeneous macrophage differentiation.

Keywords: CAD/ICAD; CP: Immunology; Draper; Drosophila; caspase; hematopoiesis; intermediate progenitor cells; lymph gland; myeloid progenitors; γH2Av.


Conflict of interest statement

Declaration of interests The authors declare no competing interests.

Figures
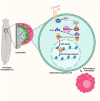
Graphical abstract
Graphical abstract
Figure 1
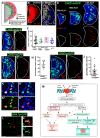
Figure 1. DNA damage occurs during the differentiation of the lymph gland
(A) Schematic showing different cell type locations in the third-instar primary lymph gland lobe. (B) Dihydroethidium staining (red) in lymph gland progenitors domeMESO-Gal4, UAS-2xEGFP/+ (without GFP channel) displays high ROS. (C) Lymph gland progenitors (domeMESO-Gal4, UAS-FUCCI) mostly arrested in the G2 cell cycle phase (yellow). (D) Control lymph glands (CHIZ-Gal4 UAS-mGFP/+) at 36, 48, and 74 h after larval hatching (ALH) show that the DDR marker mouse anti-γH2Av-positive cell (red) number increased with larval age in the intermediate zone marked CHIZ>mGFP (green). (E and E′) Rabbit anti-γH2Av immunostaining (red) in CHIZ>mGFP (green) (E) and only γH2Av (E′) matches with (D), 74 h ALH. (F) γH2Av-positive cell quantification in different genotypes: CHIZ-Gal4, UAS-mGFP/+ (n = 41); domeMESO-Gal4, UAS-2xEGFP/+ (n = 20); HmlΔ-Gal4, UAS-2xEGFP/+ (n = 25); and w1118 (n = 27) per lymph gland lobe (shown in Figure S1). (G and G′) Nick translation (red) shows incorporation of DIG-11-dUTP in control lymph gland’s intermediate progenitor zone CHIZ>mGFP/+ (n = 12), indicating DNA strand breaks. (H) Quantification of nick translation-positive cells in (G) and (G′). (I and I′) In control lymph gland intermediate zone (CHIZ>mGFP/+, n = 17), mark anti-phospho-ATM/ATR substrate motif ([pS/pT]QG) (red), indicating ATM/ATR activity. (J) Quantification of ATM/ATR substrate motif-positive cells in (I) and (I′). (K–K) Magnified image from lymph gland showing DDR marker p-Chk1 (red) co-localizes with γH2Av (green) and Topro3 nuclei (blue). (L–L″) RPA70-GFP (high intensity) co-localizes with γH2Av-positive cells (red). (M) A schematic showing the choice between cell death and survival upon DNA damage. Except for image (D), which shows 36, 48, and 74 h ALH stage lymph glands, all images are from the wandering third-instar lymph gland. All scale bars represent 25 μm except (L) 10 μm and (K–K and L′–L″)5 μm, with maximum intensity projections of the middle third optical sections except (B), (C), and (K)–(L″), which are single optical sections of the lymph glands. DAPI (blue)-stained nuclei. Error bars, mean ± standard deviation (SD). All images represent 3 or more independent biological experiments, and n represents lymph gland lobe numbers.
Figure 2
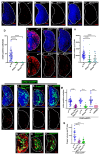
Figure 2. DNA breaks and active caspase in differentiating progenitor blood cellsγ
(A) Drosophila apoptotic pathway schematic. (B and B′) Lymph gland intermediate progenitor zone (CHIZ>mGFP/+ [green], n = 66) exhibits cleaved Dcp-1 (red) immunostaining. (C) Quantification of Dcp-1-positive cells/lymph gland lobe in CHIZ>mGFP/+ (n = 66) genotype. (D–D″) In CHIZ>mGFP/+ lymph gland (without mGFP), γH2Av (red) cells are also Dcp-1 positive (green) (D); inset shows Dcp-1 (D′) and γH2Av (D″). (E) Quantification of (D)–(D″) (n = 22) reveals >90% γH2Av-positive cells co-localizing with Dcp-1. (F and F′) GFP (green) fluorescent reporter of executioner caspase activity (e33c-Gal4, UAS-GC3Ai) co-localizes with γH2Av-positive cells (red) (n = 14). (G) Quantification of (F) and (F′) showing percentage of co-localization/lymph gland lobe. (H–H‴) Lymph gland expressing Apoliner (e33c-Gal4, UAS-Apoliner), where RFP (red) and GFP (green) colocalize at membrane, but caspase activity (arrow) causes GFP to relocalize in nuclei (H and H′) and high magnification (H″ and H‴). (I) CasExpress-Gal4, UAS-RedStinger (n = 29) expression shows executioner caspase activity (red) in the lymph gland. (J) Quantification of caspase active cells in (I). (K–K″) Initiator caspase Dronc activity shown by nuclear Drice-based-sensor-GFP (DBS-GFP) (n = 42) in the lymph gland intermediate zone (K) and magnified images (K′ and K). (L) Quantification of DBS-GFP cells in (K). (M and N) The L-CasExpress L-Trace (lex-Aop-Flp::Ubi-FRT-STOP-FRT-GFP/lex-Aop-2XmRFP; L-caspase/+) shows real-time executioner caspase activity in RFP (red) cells (arrowheads in M and M′), with caspase lineage trace cells with GFP (green) (M), co-localized cells (arrows in M and M′), and lymph gland middle third section lineage trace GFP (N). (O) Quantification of the ratio of caspase lineage cells and DAPI volumes in (M) and (N). All images are single optical sections except (B), (B′), (I), and (N), which are maximum intensity projections of the middle third optical section of the wandering third-instar lymph gland. All scale bars represent 25 μm except (H″ and H) 5 μm and (K′ and K) 10 μm. DAPI (blue)-stained nuclei. Error bars, mean ± SD. All images represent 3 or more independent biological experiments, and n represents lymph gland lobe numbers.
Figure 3
Figure 3. Caspase-mediated DNA breaks needed for macrophage differentiation
(A–C′) Control w1118 (n = 74, A and A′) lymph gland shows γH2Av staining (red), but executioner caspase DriceΔ 1/Drice2c8 (n = 43, B and B′) and initiator caspase DroncI29/DroncI24 (n = 30, C and C′) mutants do not show γH2Av-positive cells. (D) Quantification of γH2Av-positive cells in (A)-(C′). (E–G′) Phagocytic receptor Draper staining (red) as macrophage marker in control w1118 (n = 64, E and E′) but with severely less staining in mutants DriceΔ1/Drice2c8 (n = 71, F and F′) and DroncI29/DroncI24 (n = 51, G and G′). (H) Quantification of Draper staining volume in (E)–(G′). (I–L′) Compared with the control sets, CHIZ>mGFP/+ (n = 33, n = 21, and n = 23, I and I′), CHIZ>mGFP-driven UAS-DriceRNAi; UAS-Dcp-1RNAi (n = 30, J and J′), UAS-DroncRNAi (n = 24, K and K′), and UAS-miRHG (L and L′) lymph glands show fewer γH2Av-positive cells (red). (M) Quantification of γH2Av-positive cells in (I)–(L′). (N–P) Control lymph gland, CHIZ>mGFP/+ (n = 26, N), CHIZ>mGFP-driven UAS-DriceRNAi; Dcp-1RNAi (n = 22,0), and UAS-DroncRNAi (n = 25, P) show drastically lower Draper staining (red) than the control. (Q) Quantification of Draper volume in (N) and (P). Scale bars: 25 μm, maximum-intensity projections of the middle third optical section of the wandering third-instar larval lymph gland lobe. DAPI (blue)-stained nuclei. ****p < 0.0001 Error bars, mean ± SD. Control groups are different for their respective experimental sets because experiments were performed on different days. All images represent 3 or more independent biological experiments, and n represents lymph gland lobe numbers.
Figure 4
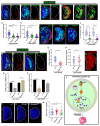
Figure 4. Caspase-activated DNase induces DNA breaks required for macrophage differentiation
(A–C′) Depletion of Drosophila ICAD (CHIZ>mGFP; UAS-Drep1RNAi, n = 34, B and B′) and CAD (CHIZ>mGFP; UAS-Drep4RNAi, n = 35, C and C′) in the intermediate progenitors (green) leads to significantly reduced γH2Av-positive lymph glands cells (red) compared to control, CHIZ>mGFP/+ (n = 38, A and A′). (D–F) Depletion of ICAD (CHIZ>mGFP UAS-Drep1RNAi, n = 38, E) and CAD (CHIZ>mGFP; UAS-Drep4RNAi, n = 40, F) causes significantly less Draper staining (red) in lymph gland compared to control, CHIZ>mGFP/+ (n = 37, D). (G) Quantification of γH2Av-positive cells in (A)–(C′). (H) Quantification of Draper volume in (D)–(F). (I–K) Depletion of ICAD (CHIZ>mGFP UAS-Drep1RNAi, n = 26, J) and CAD (CHIZ>mGFP; UAS-Drep4RNAi, n = 26, K) causes significantly reduce P1 staining (red) in lymph gland compared to their control sets, CHIZ>mGFP/+ (n = 25 and 23, I). (L) Quantification of P1 volume in (I)–(K). (M–N′) Loss of CAD in the lymph gland (UAS-GC3Ai/UAS-Drep4RNAi; e33c-Gal4/+, n = 30) shows fewer γH2Av-positive cells (red) but unchanged caspase-activated (GC3Ai) cells compared to control (UAS-GC3Ai/+; e33c-Gal4/+, n = 28, M and M′). (O) Quantification of γH2Av-positive cells in (M)–(N′). (P) Quantification of GFP volume of GC3Ai reporter in (M)–(N′). (Q) Drosophila CAD (Drep4) expressed (Drep4-Gal4, UAS-mCD8::RFP) in third-instar larval lymph gland. (R and S) Quantitative RT-PCR shows that lymph gland (e33c-Gal4) expressed Drep1/ICAD (R) and Drep4/CAD (S); UAS-Drep1RNAi significantly reduced Drep1 transcript but not Drep4 transcript (R); and UAS-Drep4RNAi significantly reduced Drep4 transcript but moderately changed Drep1 transcript (S). (T–V) DNaseIIlo (U) and EndoGMB07150 (V) mutants have γH2Av-positive cells (red) similar to control w1118 (T) lymph glands. (W) Quantification of γH2Av-positive cells in (T)–(V). (X) Model showing active caspase causing CAD-mediated DNA breaks at the open chromatin regions during macrophage differentiation. Images are from the wandering third-instar larval lymph glands. Scale bar: 25 μm. Images are maximum intensity projections ofthe middle third optical section of lymph glands except (M) is a single optical section. DAPI (blue)-stained nuclei. ***p < 0.001 and ****p < 0.0001; ns, not significant. Error bars, mean ± SD. All images represent 3 or more independent biological experiments, and n represents lymph gland lobe numbers.
Figure 5
Figure 5. InR/PI3K/Akt signaling regulates caspase activity and DNA breaks in macrophage differentiation
(A–G′) InR/PI3K/Akt-mediated executioner caspase regulation: Dcp-1 staining (red) in three different control sets and CHIZ>mGFP/+ (n = 43, n = 32, and n = 30, A and A′, green) and CHIZ>mGFP-driven experimental sets (AktRN/Ai, B and B′, n = 50; PI3KDN, C and C′, n = 37; and InRRNAi, D and D′, v992, n = 22) showfewer Dcp-1-positive cells. CHIZ>mGFP-driven PI3KCAAX (E and E′, n = 29) have high Dcp-1-positive cells and are rescued in PI3KCAAX; DnceRNAl (F and F′, n = 42) and PI3KCAAX; DroncRNAi (G and G′, n = 43). (H–N′) CHIZ>mGFP (green)-driven experimental sets (AktRNAi, I and I′, n = 47; PI3KDN, J and J′, n = 48; and InRRNAi, K and K′, v992, n = 36) show fewer yH2Av-positive cells (red) compared to control sets, CHIZ>mGFP/+ (H and H′, n = 43, n = 40, and n = 30); CHIZ>mGFP-driven PI3KCAAX (L and L, n = 29) show high γH2Av-positive cells and are rescued in PI3KCAAX; DriceRNAi (M and M′, n = 42) and PI3KCAAX; DroncRNAi (N and N′, n = 43). (O–U) CHIZ>mGFP (green)-driven experimental sets (AktRNAi, P, n = 52; PI3KDN, Q, n = 30; and InRRNAi, R, BL31037, n = 45) show less Draper (red) compared to control sets, CHIZ>mGFP/+ (O, n = 46, n = 35, and n = 26); CHIZ>mGFP-driven PI3KCAAX (S, n = 34) have significantly high Draper and are rescued in PI3KCAAX; DriceRNAi (T, n =19) and PI3KCAAX DroncRNAi (U, n = 26). (V) Quantification of Dcp-1-positive cells in (A)–(G′). (W) Quantification of yH2Av-positive cells in (H)–(N′). (X) Quantification of Draper volume in (O)–(U). All images show maximum intensity projections of the middle third optical section of wandering third-instar lymph gland lobes. Scale bars: 25 μm. DAPI (blue)-stained nuclei. **p < 0.01, ***p < 0.001, and ****p < 0.0001. Error bars, mean ± SD. All images represent 3 or more independent biological experiments, and n represents lymph gland lobe numbers.
Figure 6
Figure 6. InR/PI3K/Akt signaling via the Ask1/JNK axis regulates caspase activity
(A–E′) JNK signaling activity using MMP1 staining (red) in CHIZ>mGFP (green)-driven JNKRNAi (B and B′), Ask1RNAi (C and C′), AktRNAi (D and D′), and PI3KDN (E and E′) is severely reduced compared to their respective control sets, CHIZ>mGFP/+ (n = 24, n = 23, and n = 26). (F) Quantification of mean fluorescent intensity of MMP1 in (A)–(E). (G–I′) CHIZ>mGFP-driven Ask1RNAi (n = 38, H and H′) and JNKRNAi (n = 35, I and I′) show that positive cells (red) significantly decrease compared to control, CHIZ>mGFP/+ (n = 42 and n = 35, G and G′). (J) Quantification of Dcp-1-positive cells in (G)–(I′). (K–M′) CHIZ>mGFP-driven Ask1RNAi (n = 50, L and L′) and JNKRNAi (n = 21, M and M′) show that γH2Av-positive cells (red) drastically decrease compared to respective control sets, CHIZ>mGFP/+ (n = 47 and n = 22, K and K′). (N) Quantification of γH2Av-positive cells in (K)–(M′). (O and P) Draper staining (red) in CHIZ>mGFP-driven Ask1RNAi (n = 41, P) is significantly decreased compared to control, CHIZ>mGFP/+ (n = 64, O). (Q) Quantification of Draper volume in (O)–(P). (R–U′) Depletion of Akt (CHIZ>mGFP; UAS-PI3KCAAX; UAS-AktRNAi, n = 35, T and T′) and Ask1 (CHIZ>mGFP; UAS-PI3KCAAX; UAS-Ask1RNAi, n = 28, U and U′) in intermediate progenitors (control CHIZ>mGFP/+, n = 38, R and R′) rescue the high Dcp-1-positive cells (red) phenotype of PI3KCAAX overexpression (CHIZ>mGFP; UAS-PI3KCAAX, n = 35, S and S′). (V) Quantification of Dcp-1-positive cells in (R)–(U′). All images are from wandering third-instar lymph gland lobe with maximum-intensity projections of middle third optical sections; Scale bars: 25 μm. DAPI (blue)-stained nuclei. **p < 0.01, ***p < 0.001, and ****p < 0.0001. Error bars, mean ± SD. All images represent 3 or more independent biological experiments, and n represents lymph gland lobe numbers. See also Figure S6.
Figure 7
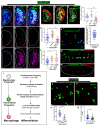
Figure 7. Developmental PI3K/Akt signaling regulates caspase/CAD activation for phagocytic macrophage differentiation
(A–C″) CAD depletion (CHIZ>mGFP; UAS-PI3KCAAX; UAS-Drep4RNAi, n = 45 for γH2Av and n = 42 for Dcp-1 staining) in intermediate progenitors (control, CHIZ>mGFP/+, n = 50, A–A″) rescue high γH2Av-positive cell (red) numbers (B′ and C′), but Dcp-1-positive cell (magenta) numbers (B′ and C′) remain the same as PI3KCAAX expression background (CHIZ>mGFP; UAS-PI3KCAAX, n = 48, B–B″). (D) Quantification of γH2Av-positive cells in (A′)–(C′). (E) Quantification of Dcp-1-positive cells in (A″)–(C″). (F–H) CAD depletion (CHIZ>mGFP; UAS-PI3KCAAX; UAS-Drep4RNAi, n = 28; H) in intermediate progenitors (control, CHIZ>mGFP/+, n = 26, F) rescue high Draper staining (red) in PI3KCAAX expression background (CHIZ>mGFP; UAS-PI3KCAAX, n = 34, G). (I) Quantification of Draper staining volume in (F)–(H). (J) Schematic shows that a mechanism of myeloid-type progenitor-to-macrophage differentiation through intermediate progenitor requires transient caspase activation and CAD-mediated DNA breaks. (K) Third-instar larvae L-CasExpress L-Trace (lex-Aop-Flp::Ubi-FRT-STOP-FRT-GFP/+; L-caspase/+, n = 53) circulating blood cells showing caspase lineage activity (GFP). (L) Quantification of (K) shows 60% of circulating cells are caspase lineage positive. (M and M′) Embryonic macrophages (stage 13) marked by srp-mCherry (red) are caspase lineage-positive GFP (green) (L-CasExpress L-Trace). (N and O) Third-instar larval circulating macrophages phagocytose RFP-tagged E. coli in control HmlΔ-Gal4, UAS-2xEGFP/+ (L), but mutant HmlΔ-Gal4, UAS-2xEGFP/+; Drice2c8/Δ1(n = 18, M) show less phagocytic efficiency. See also Video S4. (P) Quantification of phagocytic circulating macrophages in (N) and (O). (Q) Quantification of circulating macrophage numbers in (N) and (O). All the lymph gland images shown from the wandering third-instar lymph glands except (M) and (M′), which are from stage 13 embryo. All scale bars represent 25 μm except (K, N, and O) 10 μm. All images are maximum intensity projections of the middle third optical section except (K) and (M)–(O), which are single optical sections. DAPI (blue)-stained nuclei. **p < 0.01 and ****p < 0.0001; ns, not significant. Error bars, mean ± SD. All images represent 3 or more independent biological experiments, and n represents lymph gland lobe numbers.

Comment in

Similar articles

Cited by

References

    1. Lazarov T, Juarez-Carreño S, Cox N, Geissmann F. Physiology and diseases of tissue-resident macrophages. Nature. 2023;618:698–707. doi: 10.1038/s41586-023-06002-x. - DOI - PMC - PubMed
    1. Park MD, Silvin A, Ginhoux F, Merad M. Macrophages in health and disease. Cell. 2022;185:4259–4279. doi: 10.1016/j.cell.2022.10.007. - DOI - PMC - PubMed
    1. Mantovani A, Allavena P, Marchesi F, Garlanda C. Macrophages as tools and targets in cancer therapy. Nat Rev Drug Discov. 2022;21:799–820. doi: 10.1038/s41573-022-00520-5. - DOI - PMC - PubMed
    1. Cox N, Pokrovskii M, Vicario R, Geissmann F. Origins, Biology, and Diseases of Tissue Macrophages. Annu Rev Immunol. 2021;39:313–344. doi: 10.1146/annurev-immunol-093019-111748. - DOI - PMC - PubMed
    1. Gosselin D, Link VM, Romanoski CE, Fonseca GJ, Eichenfield DZ, Spann NJ, Stender JD, Chun HB, Garner H, Geissmann F, Glass CK. Environment drives selection and function of enhancers controlling tissue-specific macrophage identities. Cell. 2014;159:1327–1340. doi: 10.1016/j.cell.2014.11.023. - DOI - PMC - PubMed

Publication types