. 2024 May 28;43(5):114245.
doi: 10.1016/j.celrep.2024.114245. Epub 2024 May 17.

Clostridioides difficile toxin B subverts germinal center and antibody recall responses by stimulating a drug-treatable CXCR4-dependent mechanism

Affiliations

Clostridioides difficile toxin B subverts germinal center and antibody recall responses by stimulating a drug-treatable CXCR4-dependent mechanism

Kaylee M Norman et al. Cell Rep. .

Abstract

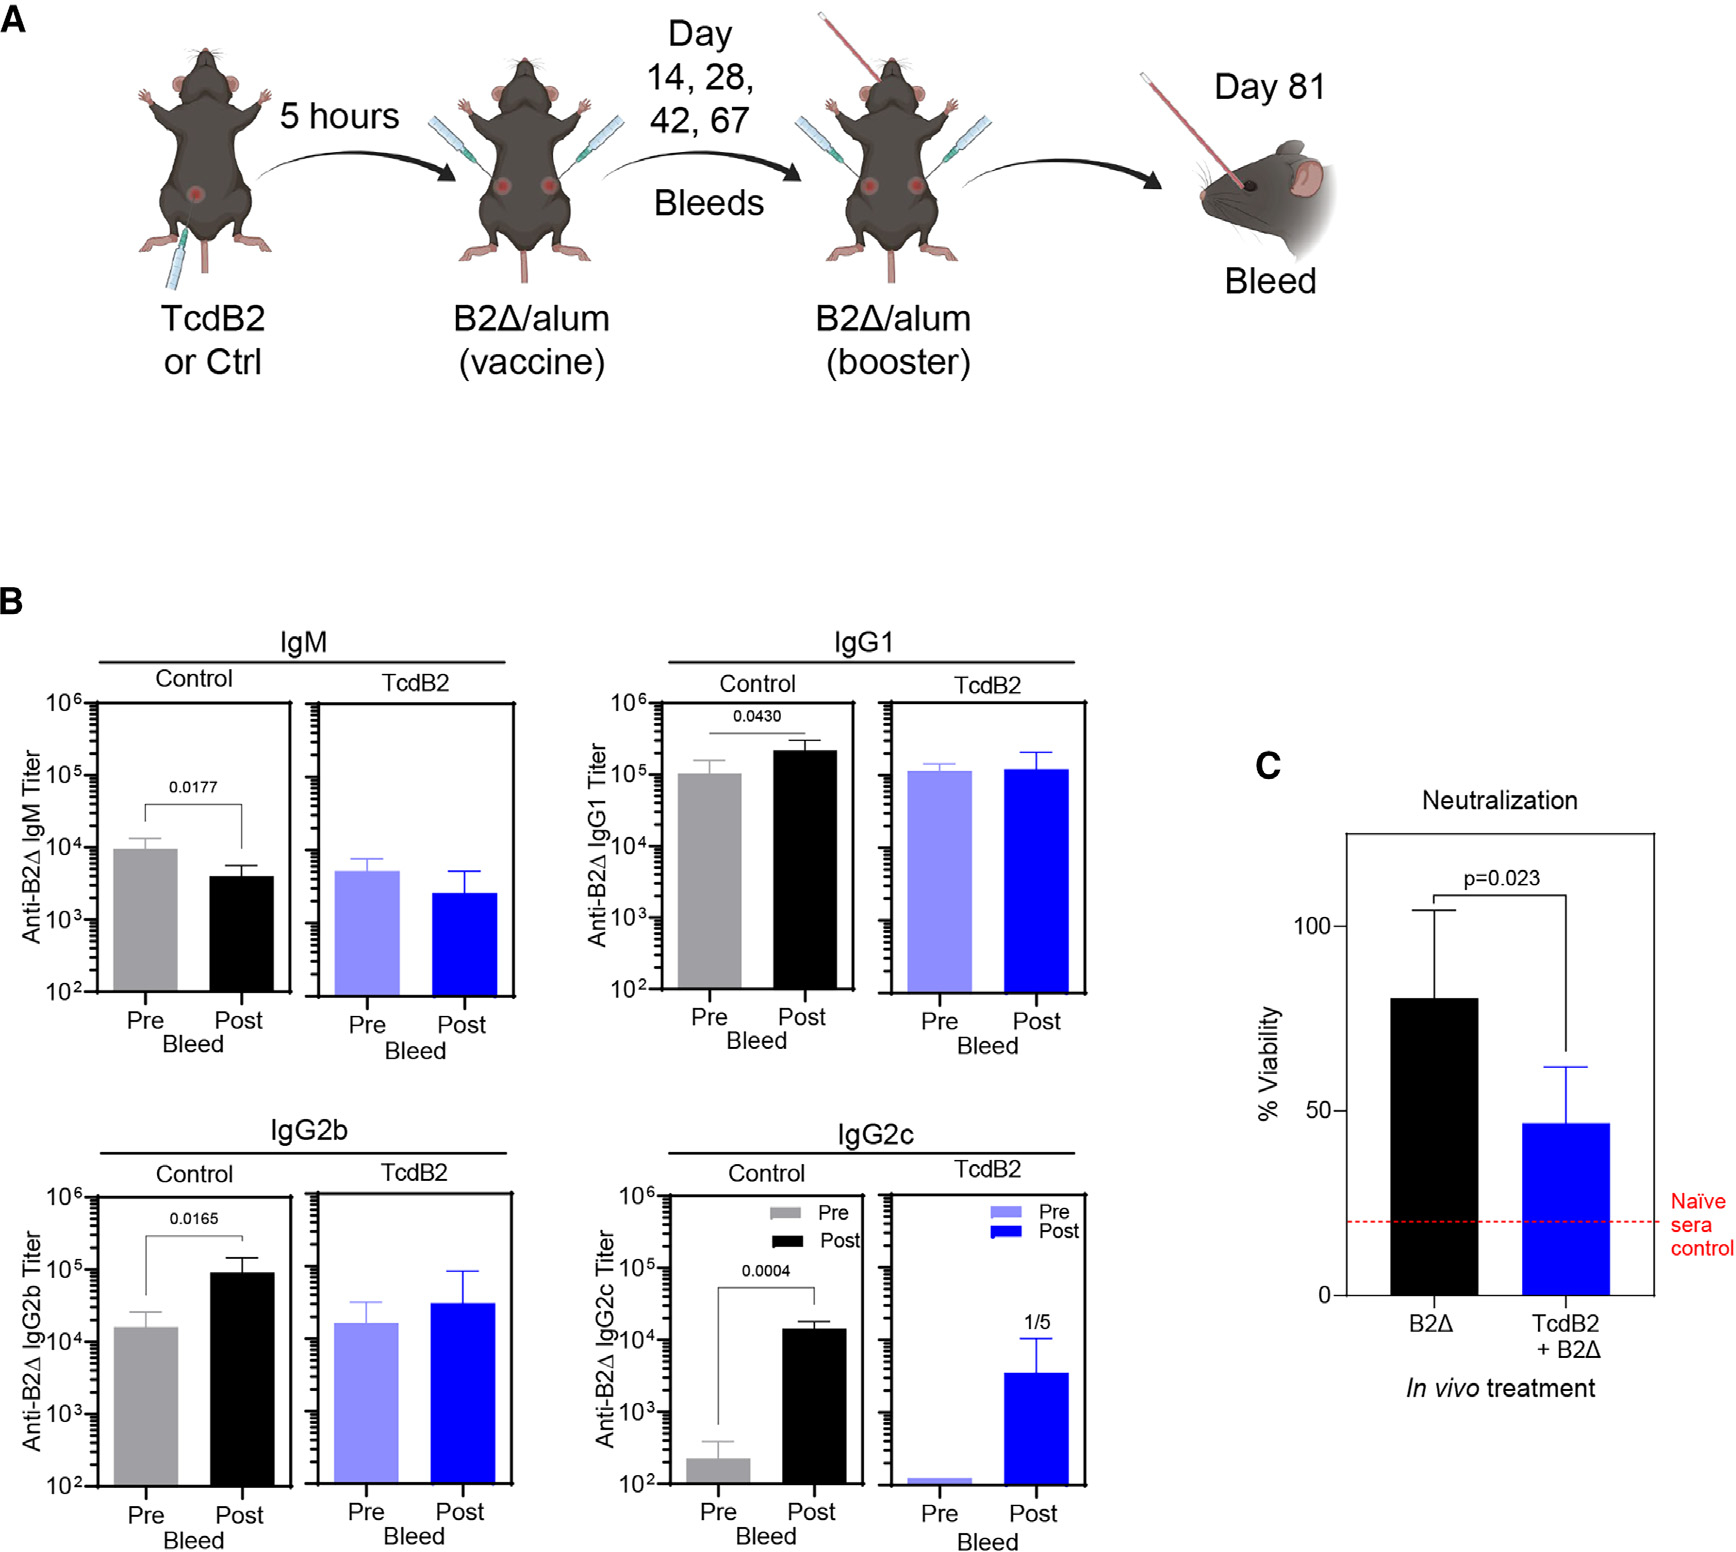
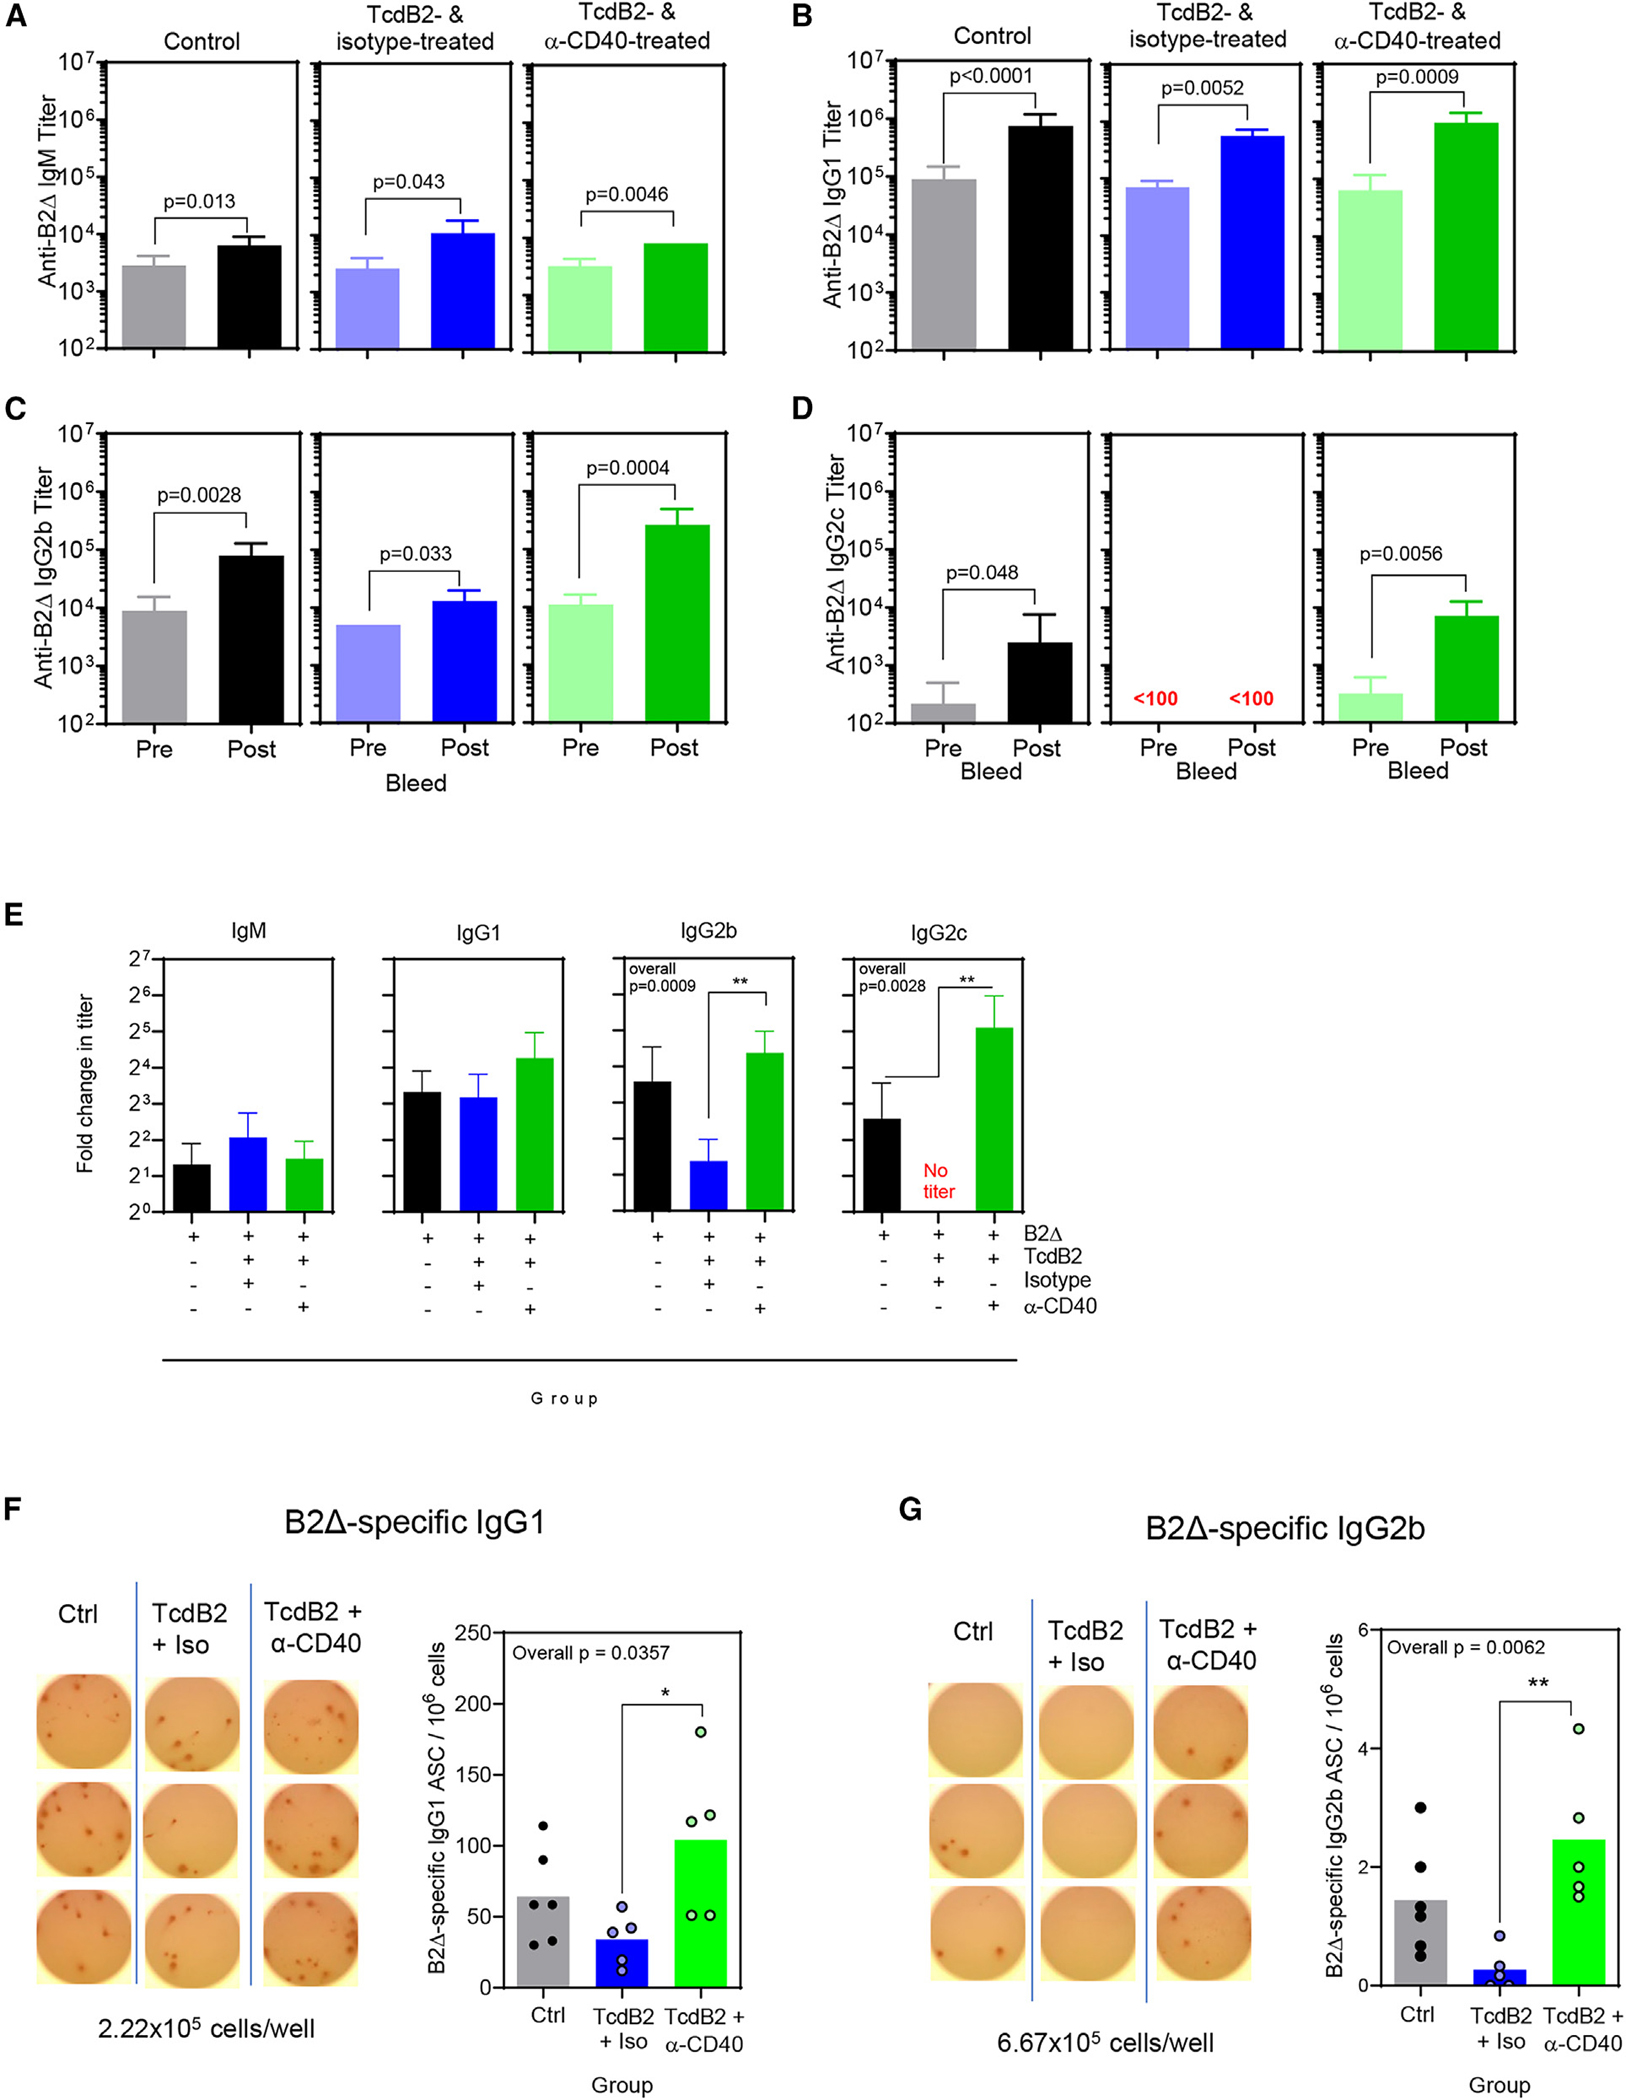
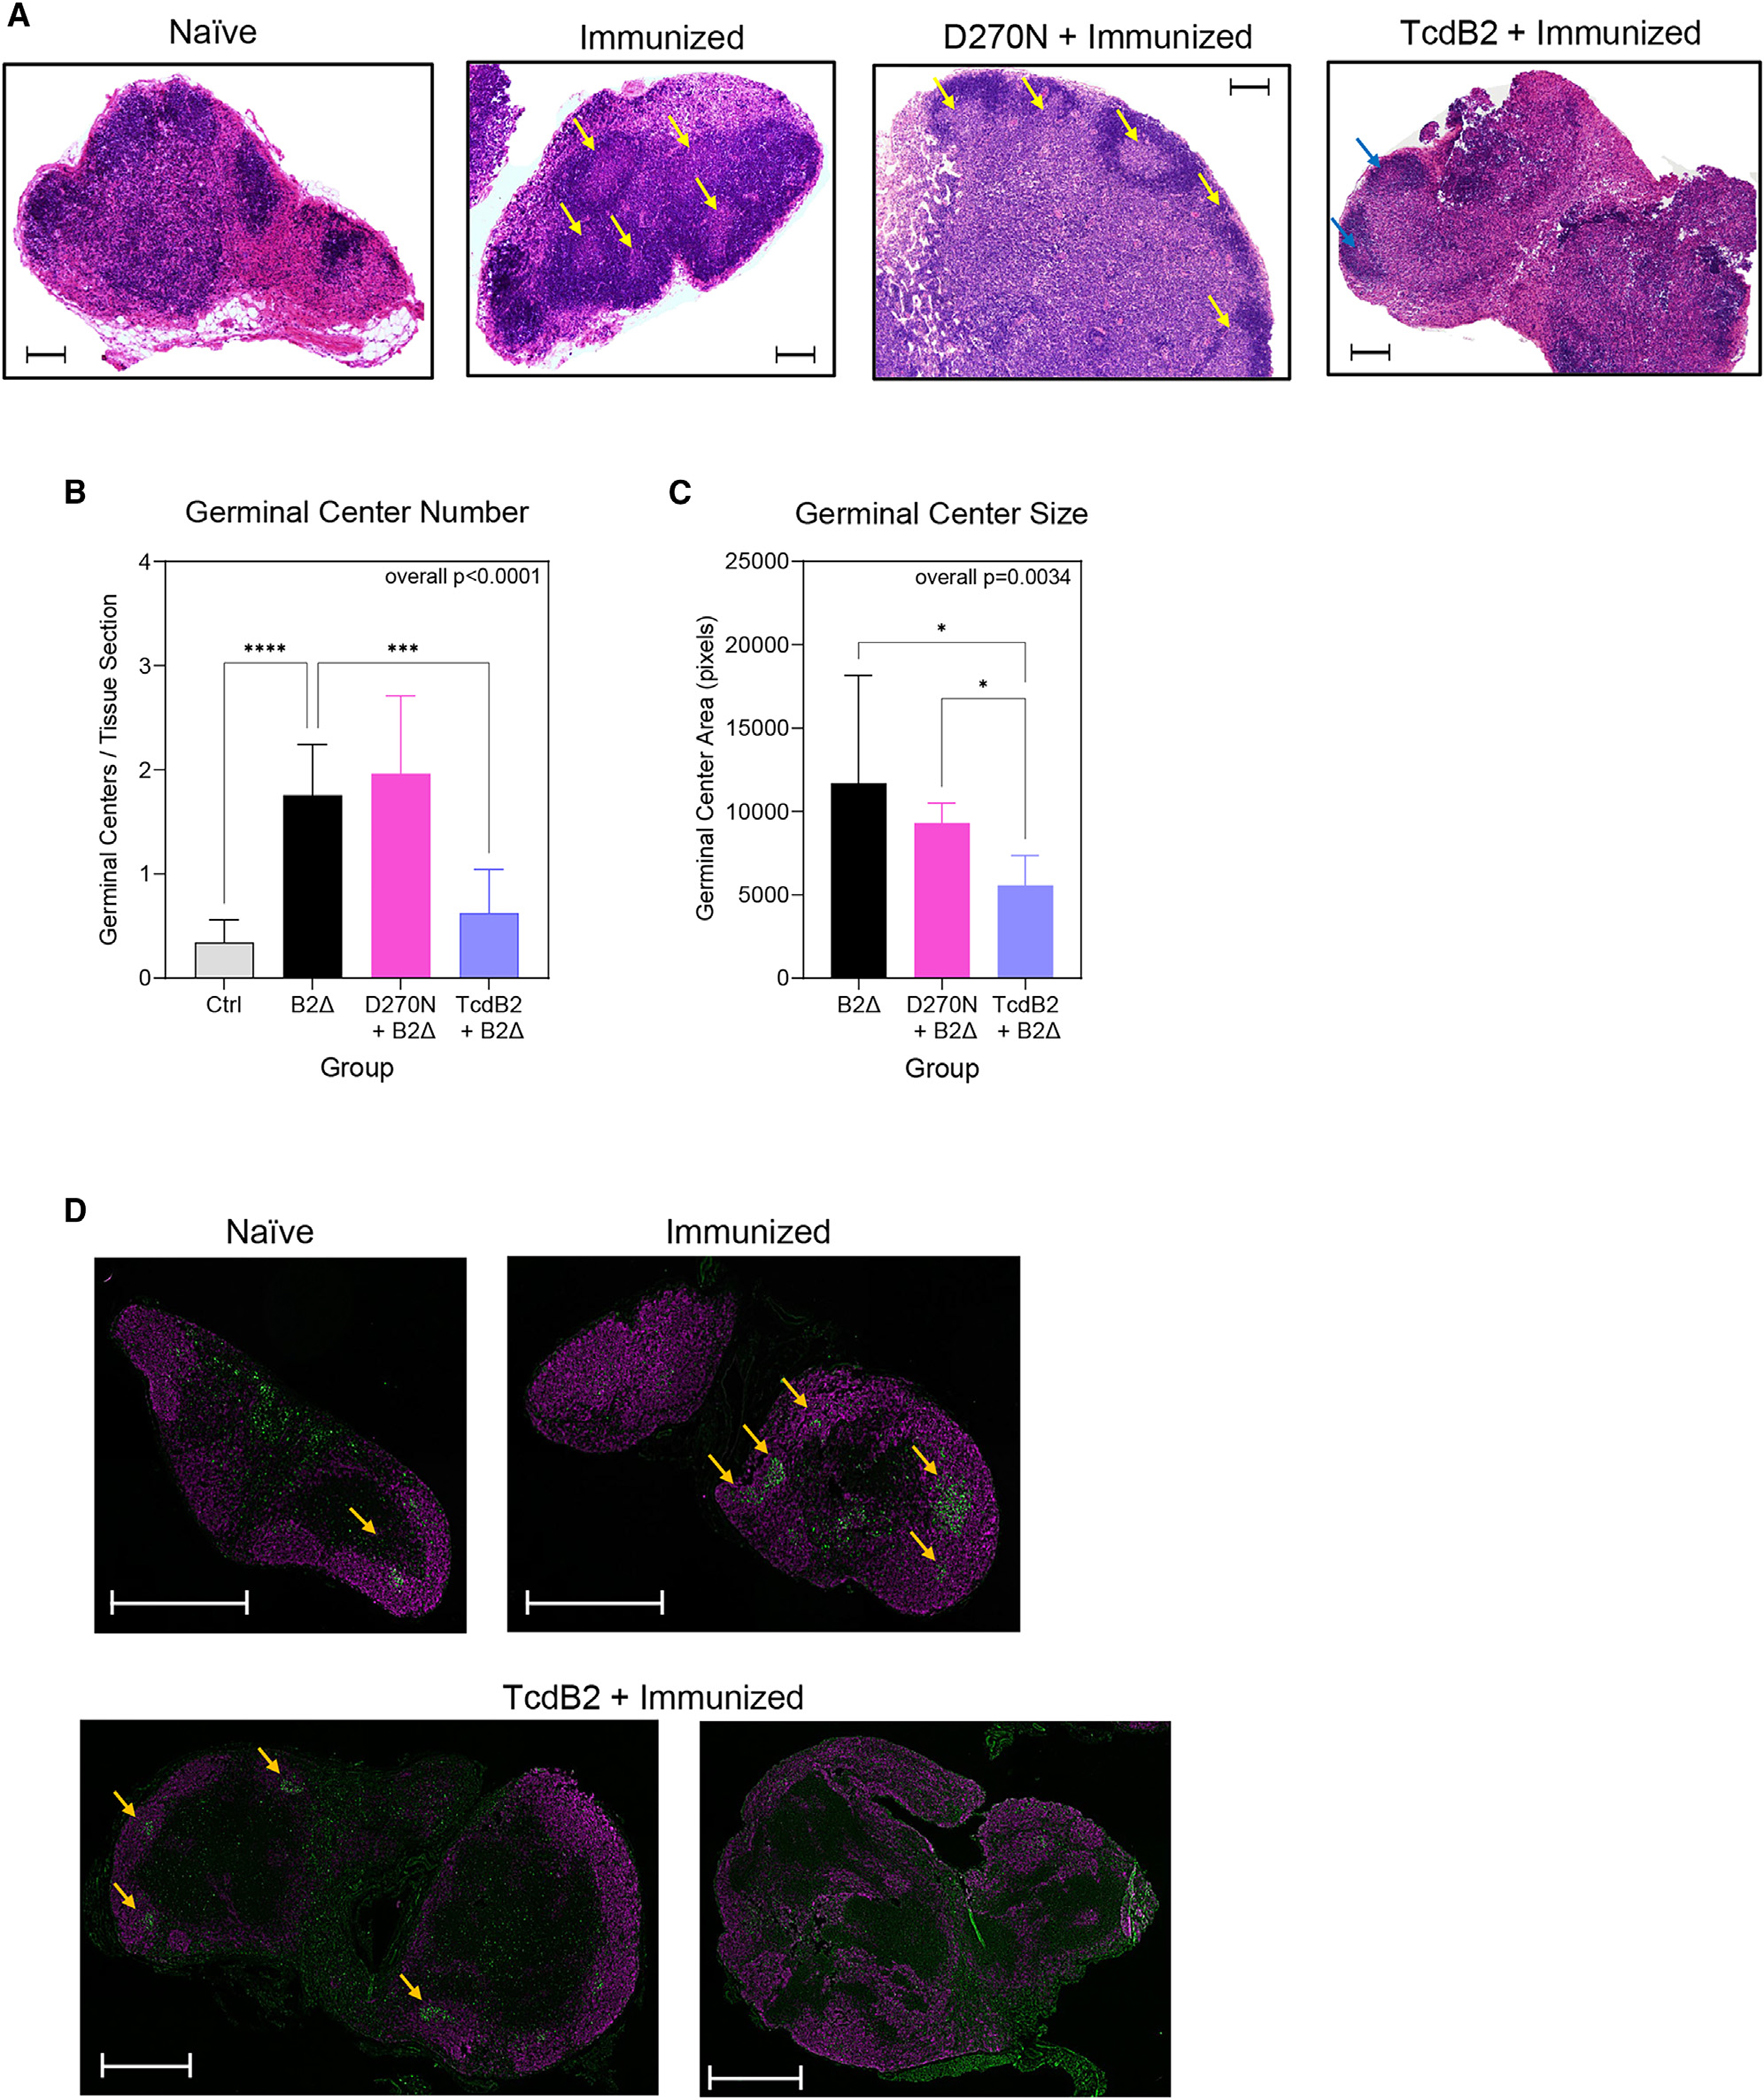
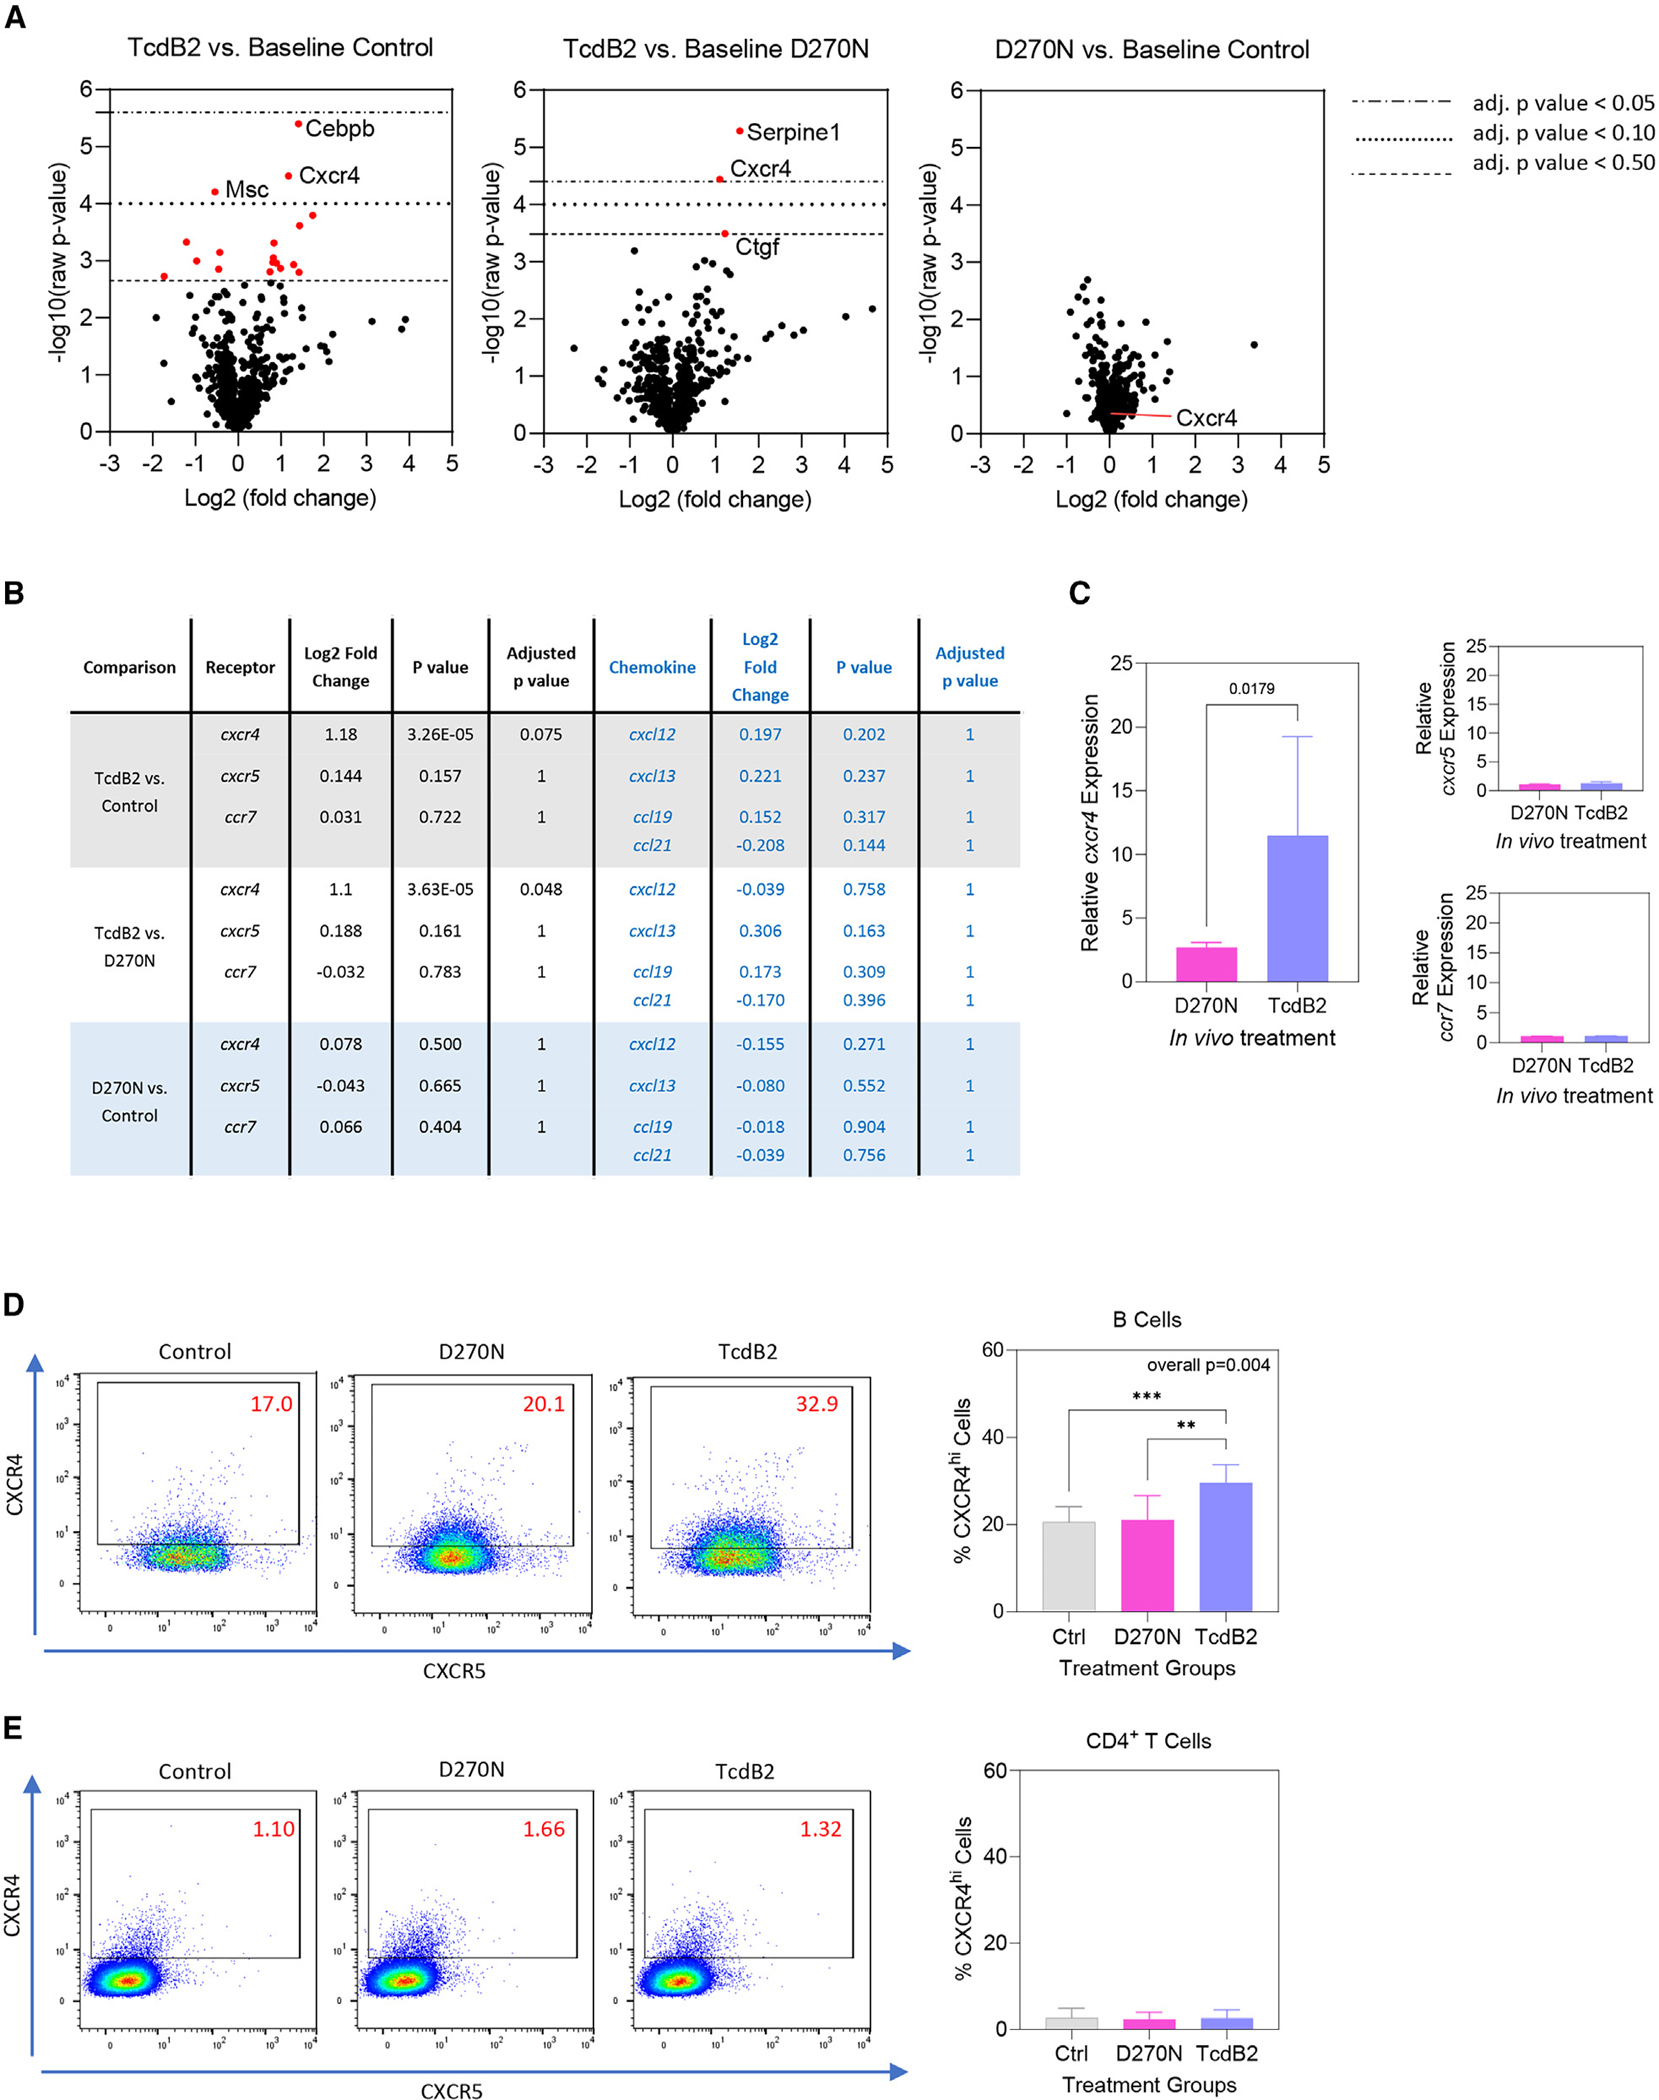
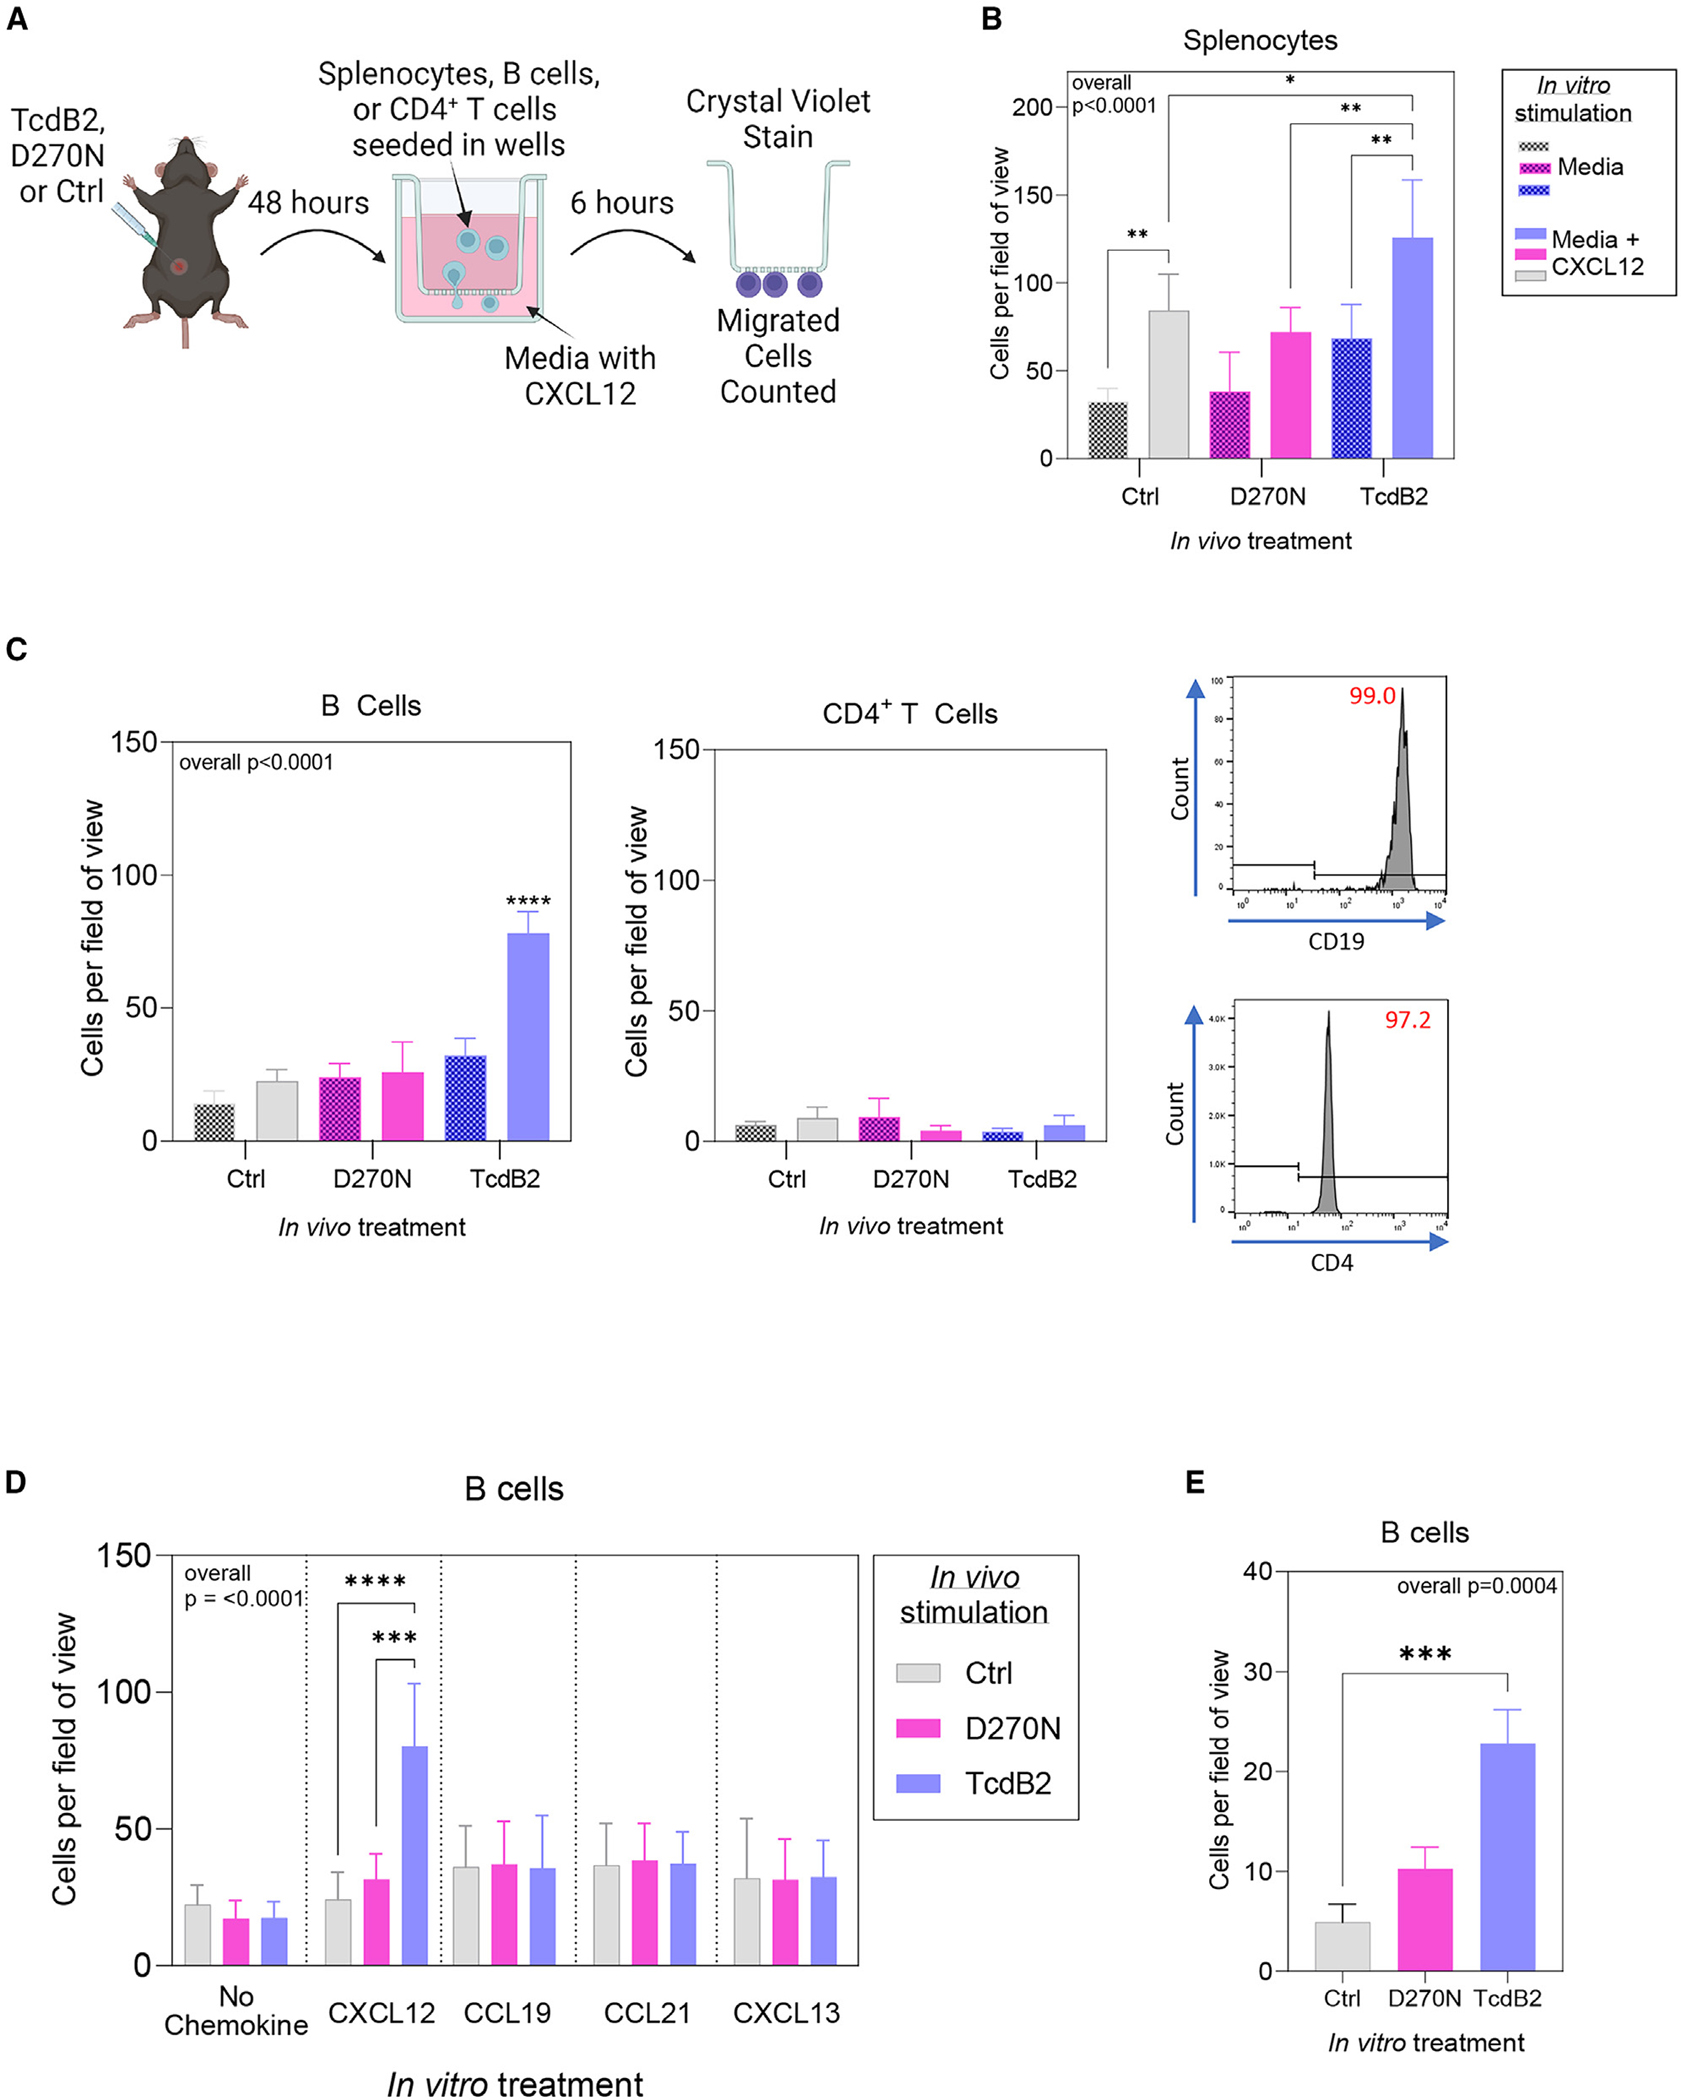
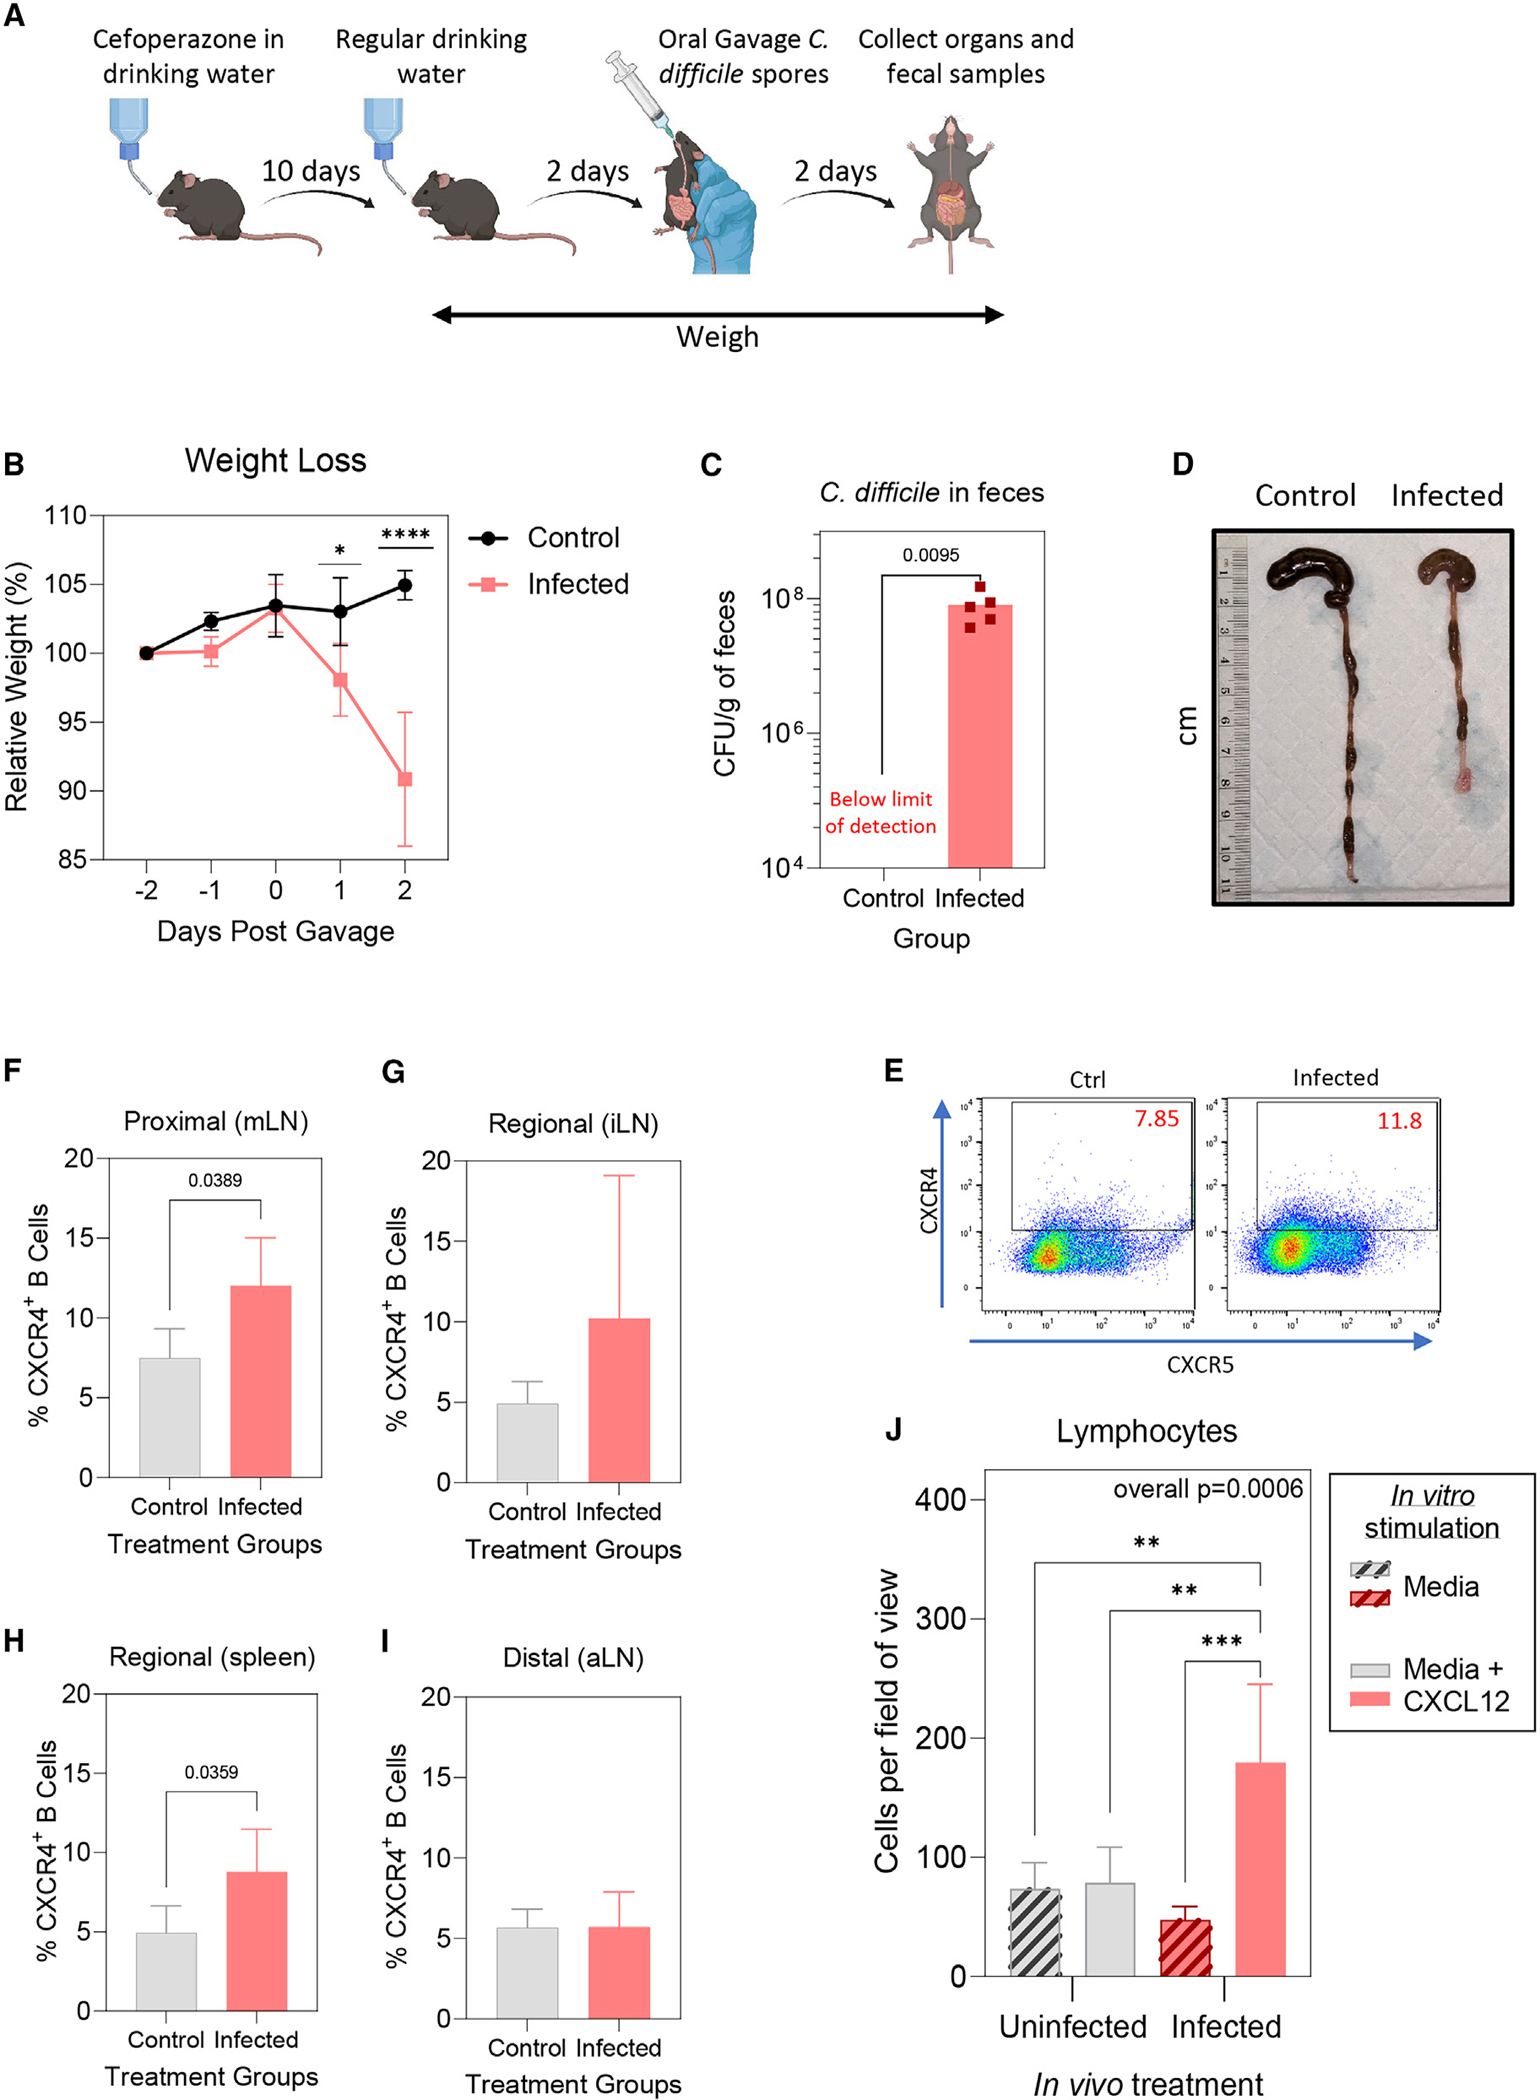
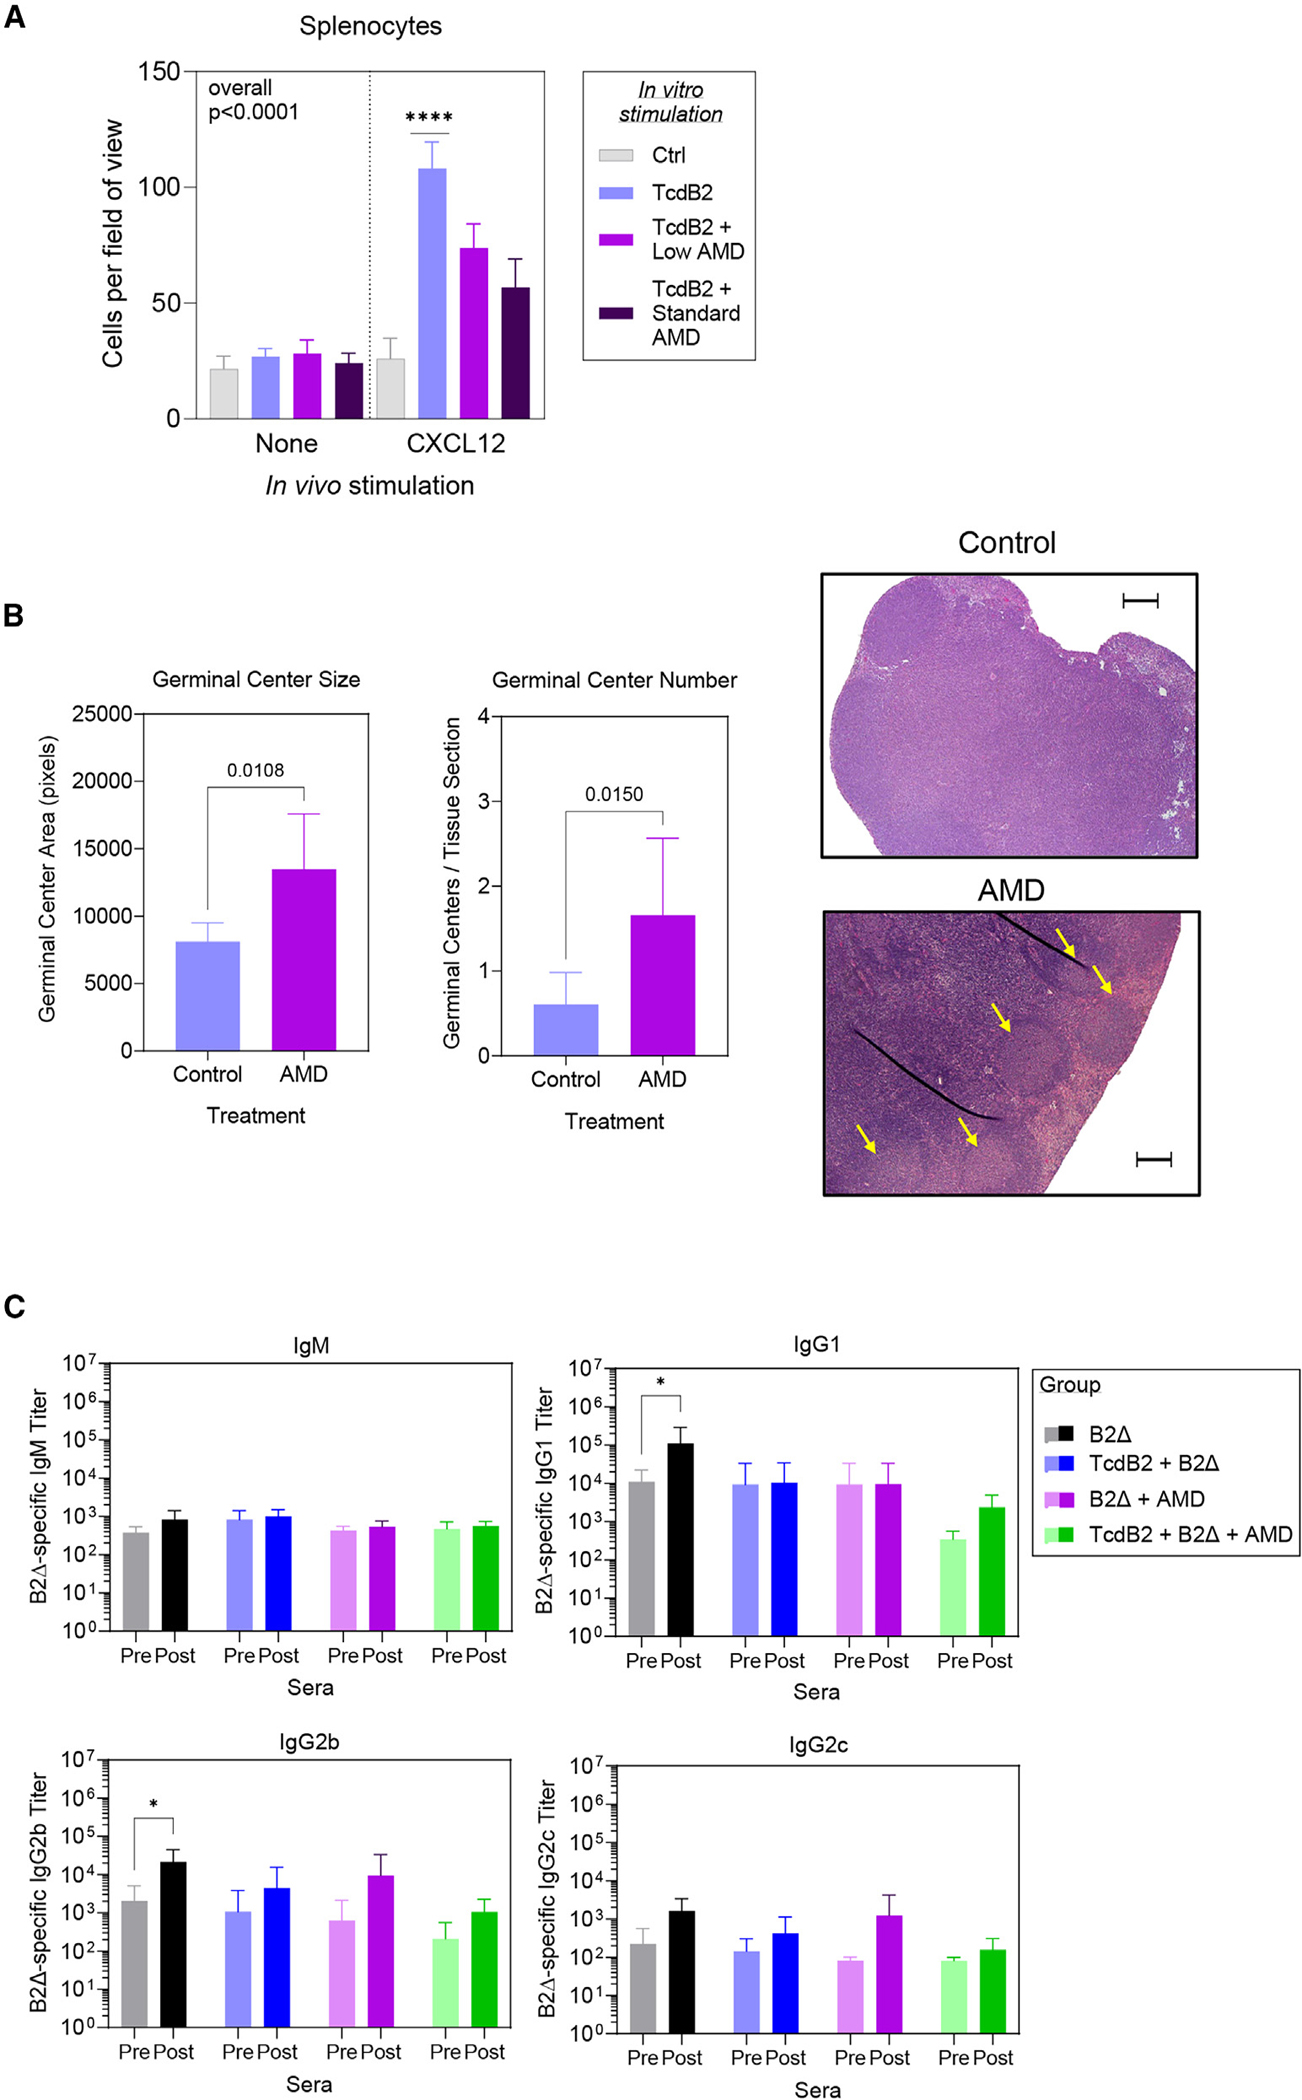
Recurrent Clostridioides difficile infection (CDI) results in significant morbidity and mortality. We previously established that CDI in mice does not protect against reinfection and is associated with poor pathogen-specific B cell memory (Bmem), recapitulating our observations with human Bmem. Here, we demonstrate that the secreted toxin TcdB2 is responsible for subversion of Bmem responses. TcdB2 from an endemic C. difficile strain delayed immunoglobulin G (IgG) class switch following vaccination, attenuated IgG recall to a vaccine booster, and prevented germinal center formation. The mechanism of TcdB2 action included increased B cell CXCR4 expression and responsiveness to its ligand CXCL12, accounting for altered cell migration and a failure of germinal center-dependent Bmem. These results were reproduced in a C. difficile infection model, and a US Food and Drug Administration (FDA)-approved CXCR4-blocking drug rescued germinal center formation. We therefore provide mechanistic insights into C. difficile-associated pathogenesis and illuminate a target for clinical intervention to limit recurrent disease.

Keywords: B lymphocyte; C. difficile; CP: Immunology; CP: Microbiology; CXCR4; antibody; chemotaxis; germinal center; toxin.


Conflict of interest statement

Declaration of interests K.M.N., M.L.L., and J.D.B. are listed as inventors on provisional US patent OKLA.P0023US.P1 filed on 09/13/23, which is related to the work described here.

Figures

Figure 1.
Figure 1.. Inhibited IgG recall responses following TcdB2 treatment
(A) Female B6 mice (n = 5 per group) were given PBS vehicle or 1 ng TcdB2 (i.p.) and then immunized with 10 μg of B2Δ/Alum (subcutaneously [s.c.]) after 5 h. Mice were bled on days 14, 28, 42, and 67 (primary). On day 67, mice were boosted with 10 μg of B2Δ in PBS (s.c.) and then bled on day 81 (recall). (B) Serum B2Δ-specific IgM, IgG1, IgG2b, and IgG2c endpoint recall titers were determined by ELISA. All control mice had an IgG2c booster response, while 1 of 5 TcdB2-treated mice responded. Graphs show comparison of mean ± SD endpoint titers pre and post booster vaccine administration, and significant differences were determined by a matched-pairs t test. Further, Mann-Whitney U tests were used to compare post-booster vaccine titers between control and TcdB2-treated groups (for IgG1, p = 0.036). (C) CHO cells were incubated with TcdB2, sera, or sera and TcdB2 for 24 h. Cell viability was determined using the CCK-8 assay as a measure of TcdB2 neutralization. The graph shows mean ± SD cell viability using recall sera from control (n = 5) and TcdB2-treated (n = 6) groups, and significance was determined by unpaired t test. Other data related to this figure are depicted in Figure S1.
Figure 2.
Figure 2.. CD40 activation-associated restoration of IgG recall responses in TcdB2-treated mice
Female B6 mice were given PBS vehicle (left, gray/black, n = 6) or 1 ng TcdB (i.p.) (center and right, n = 10 in total) and then immunized after 5 h with 20 μg of B2Δ/Alum (s.c.). TcdB2-treated mice were injected s.c. with 100 μg isotype control mAb (center, blue n = 5) or 100 μg anti-CD40 mAb (right, green, n = 5) on days 1 and 8. A booster vaccine was administered on day 60 and consisted of 20 μg of B2Δ in PBS. Blood samples were collected before (day 60) and after (day 74) the booster. (A–D) Data show (A) IgM, (B) IgG1, (C) IgG2b, and (D) IgG2c B2Δ-specific endpoint titers ± SD. Matched-pairs t-tests were used to measure significance. (E) Data from (A)–(D) were re-analyzed by calculating fold change (mean ± SD) in endpoint IgM, IgG1, IgG2b, and IgG2c titers following booster vaccine administration and comparing the three experimental groups. Additional ANOVAs with Kruskal-Wallace post-test were performed to compare post-booster titers in all groups. IgG2b overall p = 0.0009, IgG2c overall p = 0.0028. For post-test, **p < 0.01. (F and G) Representative images of ELISPOT wells with spots attributable to B2Δ-specific IgG1 and IgG2b. Graphs depict the number of B2Δ-specific spots per million cells. Each symbol represents an individual mouse. *p < 0.05, **p < 0.01.
Figure 3.
Figure 3.. TcdB2 blockade of immunization-induced GCs
Mice were treated as follows: immunized s.c. with PBS vehicle control (n = 7), immunized s.c. with 10 μg of B2Δ/Alum (n = 7), injected i.p. with 1 ng TcdB2 and then immunized s.c. (n = 7), or injected with 1 ng D270N and then immunized s.c. (n = 6). (A) Representative H&E sections of iLNs. Arrows indicate GCs. The scale bar depicts 500 μm. (B) Mean ± SD GC count. (C) Mean ± SD GC area per mouse. (B and C) Data are from three pooled experiments. Statistical significance was determined by one-way ANOVA with Dunnett’s multiple-comparisons post-test. For post-tests: *p < 0.05, ***p < 0.001, ****p < 0.0001. (D) Representative immunofluorescent sections from mice described in (A). B220+ total B cells (purple) and Ki67+ proliferating GC B cells (green) are shown. Arrows indicate GCs. The scale bar depicts 500 μm. Two examples are shown for TcdB2 treatment, as GCs were either small or undetectable.
Figure 4.
Figure 4.. Differentially expressed genes following TcdB2 exposure include CXCR4
Female mice (n = 4 per group) were given 200 μL PBS vehicle control, 10 ng D270N, or 10 ng TcdB2 in PBS by the s.c. route. Seven days post treatment, RNA was purified from axillary and inguinal lymph nodes (aLNs and iLNs). Gene expression was quantified using the Nanostring nCounter SPRINT profiler platform. (A) Differentially expressed genes (DEGs) comparing TcdB2 to PBS (left), TcdB2 to D270N (center), or D270N to PBS (right). (B) Summary of the log2 fold change, raw p values, and adjusted p values (Benjamin-Yekutieli method) for each two-way comparison in the experiment. Values for cxcr4, cxcr5, ccr7, and their ligands are depicted. A full list of chemokines and their receptors is shown in (Table S1). (C) Relative expression of cxcr4, cxcr5, and ccr7 in isolated B cells as determined by qPCR. Graphs show the increase in expression relative to vehicle-treated control mice and are normalized to gapdh expression using the ΔΔCT method. Data show mean ± SD for 5 mice per group. (D and E) B cell (D) and CD4+ T cell (E) CXCR4 and CXCR5 expression was measured by flow cytometry. Flow plots show CXCR4 versus CXCR5 expression, while graphs depict the mean ± SD percentage of each cell type expressing high levels of CXCR4. Data in are pooled from 3 experiments (n = 9 per group). Statistical significance was determined by one-way ANOVA with Kruskal-Wallace post-test (**p < 0.01, ***p < 0.001).
Figure 5.
Figure 5.. Increased B cell migration toward the CXCR4 chemoattractant CXCL12 following TcdB2 treatment
(A) Female B6 mice (n = 4 per group) were given 1 ng TcdB2, 1 ng D270N, or PBS vehicle control by the s.c. route. After 48 h, splenocytes, B cells, or CD4+ T cells were isolated (B and CD4+ T cells by magnetic separation) and seeded into the top of a Transwell. The bottom of the Transwell contained serum-free medium with or without CXCR12. Cells were incubated for 6 h, and then migratory cells were fixed and stained with crystal violet and counted. (B) Quantification of migratory splenocytes averaged from 4 fields of view from each Transwell membrane (mean ± SD, n = 4 per group). Data are representative of two independent experiments. (C) Representative flow cytometry plots for isolated B cells and CD4+ T cells. Graphs depict quantification of migratory B cells and CD4+ T cells (mean ± SD, n = 4 per group). Data are representative of two independent experiments. (D) Isolated B cells from vehicle-, D270N-, and TcdB2-treated mice were stimulated in vitro with ligands for CXCR4, CXCR5, and CCR7 (CXCL12, CCL19/CCL21, and CXCL13, respectively). Data are pooled from two independent experiments (mean ± SD, n = 8 per group). (E) Isolated splenic B cells were cultured with vehicle, D270N, or TcdB2 for 6 h (n = 3). Graph shows mean ± SD, and data are representative of 2 similar experiments. Statistical significance was determined by one-way ANOVA: *p < 0.05, **p < 0.01, ***p < 0.001, ****p < 0.0001.
Figure 6.
Figure 6.. Increased lymphocyte migration toward the CXCR4 chemoattractant CXCL12 following CDI
(A) Female B6 mice (n = 5 infected, n = 4 control) were given cefoperazone for 10 days, then distilled drinking water for 2 days. Mice were then given heat-treated C. difficile R20291 spores or distilled water via oral gavage and lymphatic organs, colon, and cecum, and fecal samples were collected 2 days post gavage. (B) Mean ± SD weights (relative to the starting weight obtained 2 days before gavage). (C) Mean ± SD C. difficile CFUs from fecal samples collected 2 days post gavage. (D) Representative image of cecum and colon from a control mouse (left) and infected mouse (right). (E) Representative flow cytometry plot of the CXCR4 versus CXCR5 gating strategy (left, control; right, infected). (F–I) Mean ± SD percentage of CXCR4hi B cells in (F) mLNs, (G) iLNs, (H) spleen, and (I) aLNs, determined by flow cytometry. (J) Mean ± SD numbers of migratory lymphocytes from mLNs averaged from 4 fields of view from each Transwell membrane. Statistical significance was determined by one-way ANOVA with Tukey’s multiple-comparisons post-test or two-tailed t test; *p < 0.05, **p < 0.01, ***p < 0.001, ****p < 0.0001.
Figure 7.
Figure 7.. The CXCR4 antagonist AMD3100 rescues TcdB2-suppressed GC formation but not IgG recall
(A) Female B6 mice were given 1 ng TcdB2 or PBS vehicle control (i.p.) and then given either PBS vehicle or AMD3100 (1 or 10 μg/g of body weight) by the s.c. route. After 48 h, splenocytes were isolated, and migration toward CXCL12 was measured as described in Figure 5. The graph depicts mean ± SD numbers of migratory splenocytes averaged from 4 fields of view from each Transwell membrane. Data are from 2 pooled experiments (n = 7 mice per group). Statistical significance was determined by one-way ANOVA with Dunnett’s multiple-comparison post-test; ****p < 0.0001. (B) Mice (n = 7 per group from 2 pooled experiments) were given 1 ng TcdB2 or PBS vehicle control (i.p.) and then immunized s.c. with 10 μg of B2Δ/Alum after 5 h. At 0, 24, and 48 h post PBS or TcdB2 treatment, mice were treated with AMD3100 or PBS vehicle control (i.p.). Graphs depict the mean ± SD area and number of GCs in iLNs collected 21 days post treatment. Statistical significance was determined by two-tailed t test. Images show representative H&E sections from lymph nodes. Yellow arrows indicate GCs. Thin dark lines were due to a crease in the section. The scale bar depicts 500 μm. (C) Mice were treated with PBS vehicle and then immunized with B2Δ/alum (B2Δ), treated with TcdB2 and then immunized (TcdB2 + B2Δ), immunized and then treated with AMD3100 (AMD + B2Δ), or treated with TcdB2, immunized, and treated with AMD3100 (AMD + TcdB2 + B2Δ). Sera were collected on day 60 (pre-boost), and a booster vaccine was administered before collection of sera on day 74 (post-boost). Data show mean titers ± SD for 5 mice per group. Significance was determined by two-way ANOVA with Sidak’s multiple comparison post-test. *p < 0.05.

Similar articles

Cited by

References

    1. Magill SS, O’Leary E, Janelle SJ, Thompson DL, Dumyati G, Nadle J, Wilson LE, Kainer MA, Lynfield R, Greissman S, et al. (2018). Changes in Prevalence of Health Care-Associated Infections in U.S. Hospitals. N. Engl. J. Med. 379, 1732–1744. 10.1056/NEJMoa1801550. - DOI - PMC - PubMed
    1. Bartlett JG (2010). Clostridium difficile: progress and challenges. Ann. N. Y. Acad. Sci. 1213, 62–69. 10.1111/j.1749-6632.2010.05863.x. - DOI - PubMed
    1. Kaslow DC, and Shiver JW (2011). Clostridium difficile and methicillin-resistant Staphylococcus aureus: emerging concepts in vaccine development. Annu. Rev. Med. 62, 201–215. 10.1146/annurev-med-051109-101544. - DOI - PubMed
    1. Kelly CP, and LaMont JT (2008). Clostridium difficile–more difficult than ever. N. Engl. J. Med. 359, 1932–1940. 10.1056/NEJMra0707500. - DOI - PubMed
    1. Olsen MA, Yan Y, Reske KA, Zilberberg MD, and Dubberke ER (2015). Recurrent Clostridium difficile infection is associated with increased mortality. Clin. Microbiol. Infect. 21, 164–170. 10.1016/j.cmi.2014.08.017. - DOI - PubMed

Publication types

MeSH terms