. 2025 Feb 1;81(2):509-522.
doi: 10.1097/HEP.0000000000000907. Epub 2024 May 16.

Distinct immunometabolic signatures in circulating immune cells define disease outcome in acute-on-chronic liver failure

Affiliations

Distinct immunometabolic signatures in circulating immune cells define disease outcome in acute-on-chronic liver failure

Rita Feio-Azevedo et al. Hepatology. .

Abstract

Background and aims: Acute-on-chronic liver failure (ACLF) is a complication of cirrhosis characterized by multiple organ failure and high short-term mortality. The pathophysiology of ACLF involves elevated systemic inflammation leading to organ failure, along with immune dysfunction that heightens susceptibility to bacterial infections. However, it is unclear how these aspects are associated with recovery and nonrecovery in ACLF.

Approach and results: Here, we mapped the single-cell transcriptome of circulating immune cells from patients with ACLF and acute decompensated (AD) cirrhosis and healthy individuals. We further interrogate how these findings, as well as immunometabolic and functional profiles, associate with ACLF-recovery (ACLF-R) or nonrecovery (ACLF-NR). Our analysis unveiled 2 distinct states of classical monocytes (cMons). Hereto, ACLF-R cMons were characterized by transcripts associated with immune and stress tolerance, including anti-inflammatory genes such as RETN and LGALS1 . Additional metabolomic and functional validation experiments implicated an elevated oxidative phosphorylation metabolic program as well as an impaired ACLF-R cMon functionality. Interestingly, we observed a common stress-induced tolerant state, oxidative phosphorylation program, and blunted activation among lymphoid populations in patients with ACLF-R. Conversely, ACLF-NR cMon featured elevated expression of inflammatory and stress response genes such as VIM , LGALS2 , and TREM1 , along with blunted metabolic activity and increased functionality.

Conclusions: This study identifies distinct immunometabolic cellular states that contribute to disease outcomes in patients with ACLF. Our findings provide valuable insights into the pathogenesis of ACLF, shedding light on factors driving either recovery or nonrecovery phenotypes, which may be harnessed as potential therapeutic targets in the future.


Conflict of interest statement

Hannah van Malenstein consults for Boston Scientific. Vicente Arroyo consults for Grifols. The remaining authors have no conflicts to report.

Figures

None
Graphical abstract
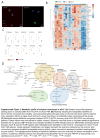
FIGURE 1
FIGURE 1
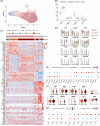
Transcriptional profile of circulating immune cells. (A) Workflow of the experimental design. Blood of healthy individuals (n = 3), patients with AD (n = 3), and patients with ACLF (n = 9) were collected. PBMCs were isolated and sorted into single, alive, CD45+ cells and analyzed using 10X Genomics Chromium droplet single-cell RNA sequencing and CITE-sequence. Annotated UMAP of peripheral immune cells showing Mons, CD4 T cells, CD8 T cells, MAITs, NK cells, cDCs, and pDCs. (B) Heatmap showing the top 20 marker genes for the identification of immune cell populations. Characteristic marker genes and the total number of genes per cell type are indicated. The expression is represented by color saturation and a distinctive color has been assigned to each population. (C) Plot showing the percent of cell type frequencies per disease state. Each dot represents 1 patient and a color code indicates the disease state. Comparison between groups was calculated using Student t test or one-way ANOVA as appropriate, and significance was set for p < 0.05. *p < 0.05, **p < 0.01. Abbreviations: ACLF, acute-on-chronic liver failure; AD, acute decompensated; cDC, classical dendritic cell; MAIT, mucosal-associated invariant T cells; Mon, monocyte; PBMC, peripheral blood mononuclear cell; pDC, plasmacytoid dendritic cells; UMAP, uniform manifold approximation and projection.
FIGURE 2
FIGURE 2
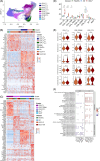
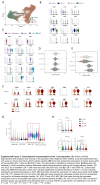
Classical ACLF monocytes show distinct transcriptional profiles. (A) Annotated UMAP plot of myeloid cells from PBMCs of healthy individuals, patients with AD, and patients with ACLF, showing cMons, intMons, ncMons, and cDCs. (B) Plot showing cell type ratio in each disease state. Each dot represents one patient, and the color indicates the disease state. (C) Heatmap showing the top marker genes for the identified myeloid populations. Individual populations and disease identities are indicated using individual colors. The expression of each gene is indicated by color saturation. (D) Violin plots showing the expression of marker genes for the identified myeloid populations. The cell identity is indicated by individual colors. (E) Dot plot showing the average expression of marker genes identifying ACLF-recovery (R) and ACLF-nonrecovery (NR) in cMon. The dot size represents the percentage of cMon expressing that gene and the expression is indicated by color saturation. (F) Violin plots showing expression levels of selected metabolic genes that distinguish ACLF-R and ACLF-NR cMon. The 2 populations are identified using individual colors. (G) Dot plot showing the average expression levels of selected regulons for each disease state (ACLF-R and ACLF-NR) in cMon. The dot size represents the percentage of cMons expressing that regulon and the expression is indicated by color saturation. Statistical comparison between ACLF-R and ACLF-NR is depicted. Comparison between groups was calculated using Student t test or one-way ANOVA as appropriate, and significance was set for ****p ≤ 0.0001. Abbreviations: ACLF, acute-on-chronic liver failure; AD, acute decompensated; cDC, classical dendritic cell; cMons, classical monocytes; intMons, intermediate monocytes; ncMon, nonclassical monocyte; UMAP, uniform manifold approximation and projection.
FIGURE 3
FIGURE 3
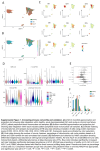
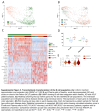
Characterization of classical monocytes from ACLF-R and ACLF-NR at a functional and metabolic level. (A) Violin plots showing calculated scores in cMon for phagocytosis, antigen presentation, migration, cytokine production, S100 Family, and interferon response for ACLF-R and ACLF-NR. (B) Assessment of cMon ability to phagocytose E.coli labeled particles to secrete IL-10 and IL-1RA upon LPS stimulation. Samples from patients with ACLF were assessed alongside a healthy control. Student t test was applied to test for significance between groups. (C) GO terms significantly enriched in the ACLF-R and ACLF-NR cMon identified using gProfiler2. The −log adjusted p value is indicated. (D) Left graph indicates the violin plot whereby a score of the ACLF-R signature genes was calculated, and the value thereof was evaluated in a separate bulk-sequencing data set of CD14+CD16 monocytes of patients with ACLF-R (n = 3) and patients with ACLF-NR (n = 3) (Z-score statistical method used). Right graph depicts a violin plot of FPKM values for RETN obtained from bulk-sequencing data done on CD14+CD16 monocytes of patients with ACLF-R (n = 3) and patients with ACLF-NR (n = 3). (E) Receiver operating curve showing that 10 signature genes from ACLF-R can distinguish between recovery and non-recovery patients using a random forest model. (F) PCA on a training population displaying the 2 components with the fitted training model. (G) PCA was done with the trained model fitted on a test population, yielding an accurate stratification of patients with ACLF who recovered from those who did not recover. (H) Significantly different metabolic processes and metabolic-related signaling Kyoto Encyclopedia of Genes and Genomes pathways scoring calculated for cMon, comparing ACLF-R to ACLF-NR. Dot color refers to the statistical comparison done showing upregulated (red) or downregulated (blue) metabolic processes in ACLF-R compared with ACLF-NR. Significance was set for p<0.05. (I) Heatmap showing the top 30 metabolites identified in CD14+CD16 monocytes comparing to ACLF-NR versus ACLF-R. Color saturation defines a higher level (red) and a lower level (blue) when comparing the 2 groups of patients. Red squares identify the statistically different metabolites with p <0.05. Comparison between groups was calculated using Student t test or one-way ANOVA as appropriate, and significance was set for p < 0.05. *p < 0.05, **p < 0.01, ****p ≤ 0.0001. Abbreviations: ACLF, acute-on-chronic liver failure; cMon, classical monocyte; FPKM, fragments per kilobase/million; GO, gene ontology; LPS, lipopolysaccharide; PCA, principal component analysis.
FIGURE 4
FIGURE 4
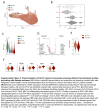
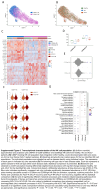
Transcriptional characterization of the T-cell subsets in ACLF. (A) Annotated uniform manifold approximation and projection plot of healthy individuals, patients with AD and patients with ACLF, showing CD4 naïve T cells (TN), CD4 central memory (TCM), CD4 effector memory (TEM), CD4 T regulatory (TREG), CD8 TN, CD8 GZMK, CD8 CTL, gamma delta T cells (γδ T), and MAITs. (B) Heatmap showing the top marker genes for the identified CD4 T-cell populations. The individual populations and disease identity are indicated using individual colors. The expression of each gene is indicated by color saturation. (C) Heatmap showing the top marker genes for the 5 identified CD8 T-cell populations. The individual populations and the disease identity are indicated using individual colors. The expression of each gene is indicated by color saturation. (D) Plot showing cell type ratio in each disease state. Each dot represents one patient, and the color indicates the disease state. (E) Violin plots showing calculated scores for CD4 TEM, CD8 GZMK, and CD8 CTL regarding activation, apoptosis, cytokine production, S100 Family, and cytotoxicity for ACLF-recovery (R) and ACLF-nonrecovery (NR). (F) The significantly different metabolic processes and metabolic-related signaling KEGG pathways scoring calculated for CD4 TEM, CD4 CTL, CD8 GZMK, and CD8 CTL populations, comparing ACLF-R to ACLF-NR. Dot color refers to statistical comparison done showing upregulated (red) or downregulated (blue) metabolic processes in ACLF-R comparing with ACLF-NR. Significance was set for p < 0.05. Comparison between groups was calculated using Student t test or one-way ANOVA as appropriate, and significance was set for p<0.05. *p < 0.05, **p < 0.01, ***p < 0.001, ****p < 0.0001. Abbreviations: ACLF, acute-on-chronic liver failure; AD, acute decompensated; KEGG, Kyoto Encyclopedia of Genes and Genomes; MAIT, mucosal-associated invariant T cell.
None
None
None
None
None
None

References

    1. Arroyo V, Moreau R, Kamath PS, Jalan R, Ginès P, Nevens F, et al. . Acute-on-chronic liver failure in cirrhosis. Nat Rev Dis Primers. 2016;2:16041. - PubMed
    1. Arroyo V, Moreau R, Jalan R. Acute-on-chronic liver failure. N Engl J Med. 2020;382:2137–2145. - PubMed
    1. Meersseman P, Langouche L, du Plessis J, Korf H, Mekeirele M, Laleman W, et al. . The intensive care unit course and outcome in acute-on-chronic liver failure are comparable to other populations. J Hepatol. 2018;69:803–809. - PubMed
    1. Van der Merwe S, Chokshi S, Bernsmeier C, Albillos A. The multifactorial mechanisms of bacterial infection in decompensated cirrhosis. J Hepatol. 2021;75:S82–S100. - PubMed
    1. Albillos A, Martin-Mateos R, Van der Merwe S, Wiest R, Jalan R, Álvarez-Mon M. Cirrhosis-associated immune dysfunction. Nat Rev Gastroenterol Hepatol. 2021;19:112–134. - PubMed