

Unveiling ecological/evolutionary insights in HIV viral load dynamics: Allowing random slopes to observe correlational changes to CpG-contents and other molecular and clinical predictors
- PMID: 38761432
- PMCID: PMC11213286
- DOI: 10.1016/j.epidem.2024.100770
Unveiling ecological/evolutionary insights in HIV viral load dynamics: Allowing random slopes to observe correlational changes to CpG-contents and other molecular and clinical predictors
Abstract
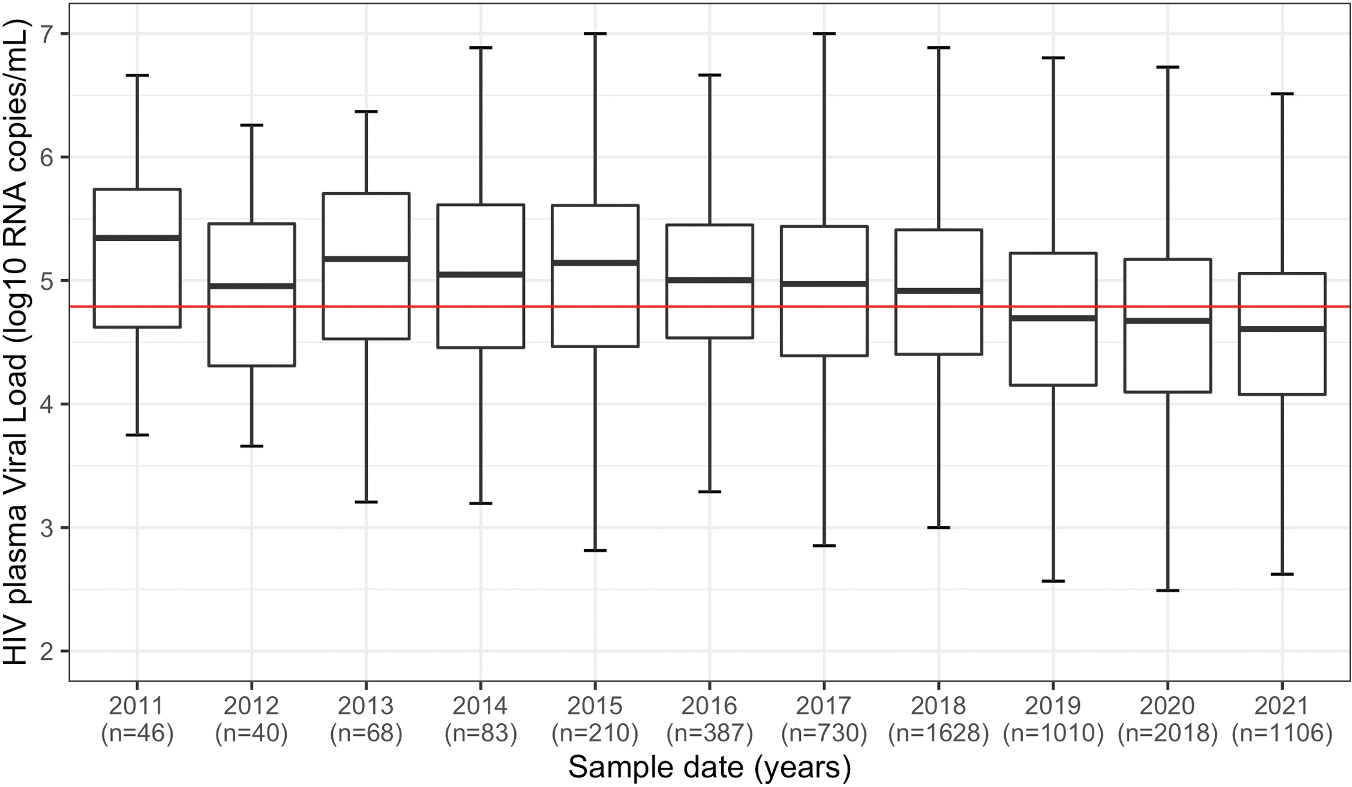
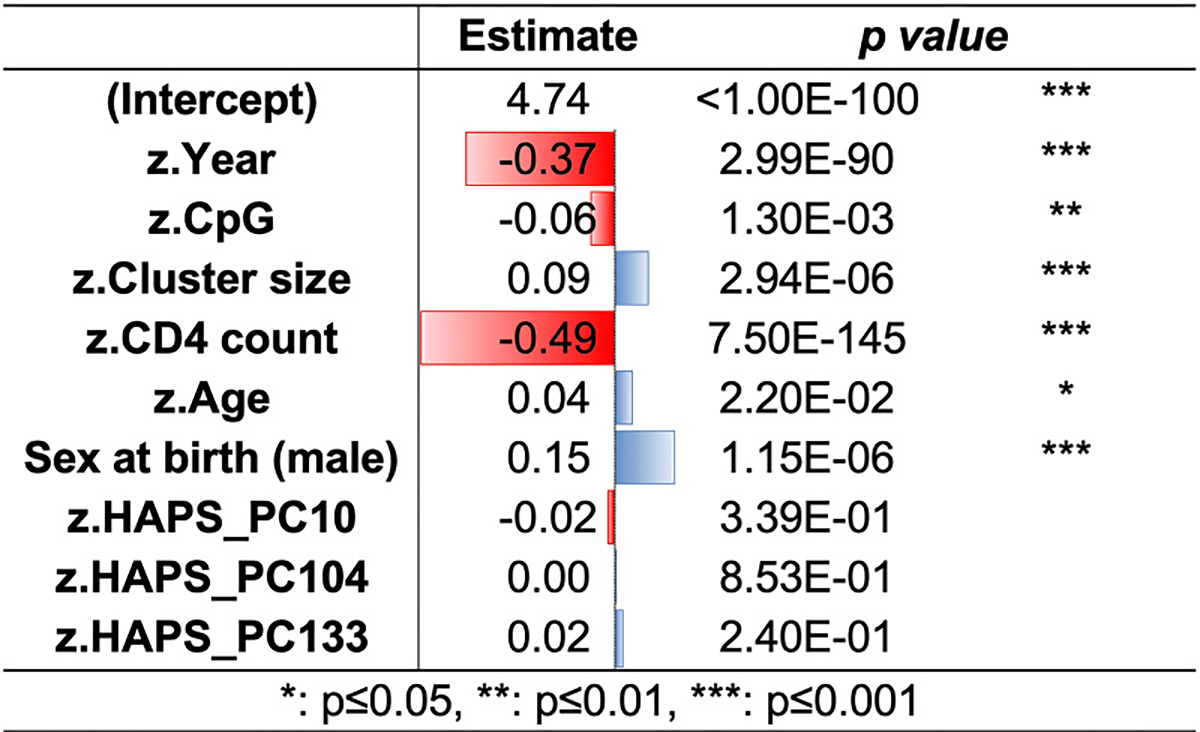
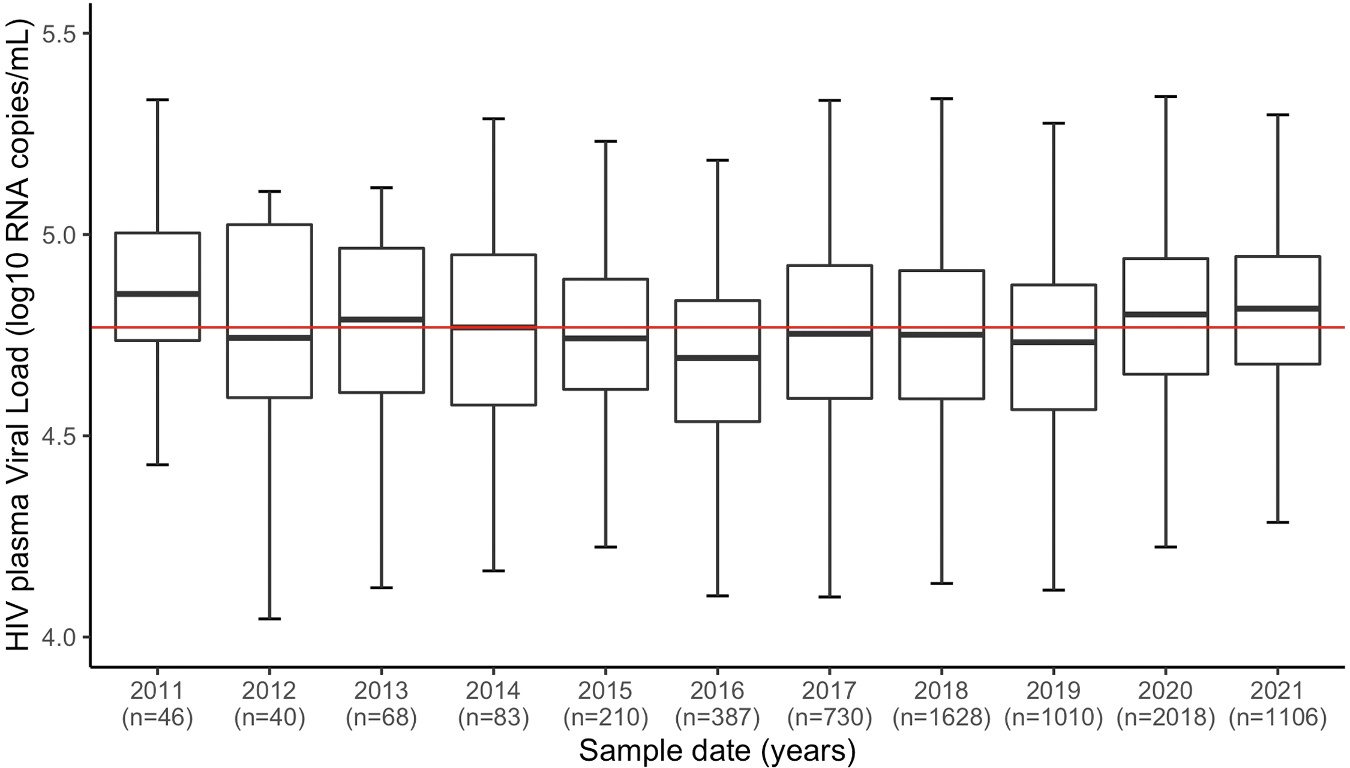
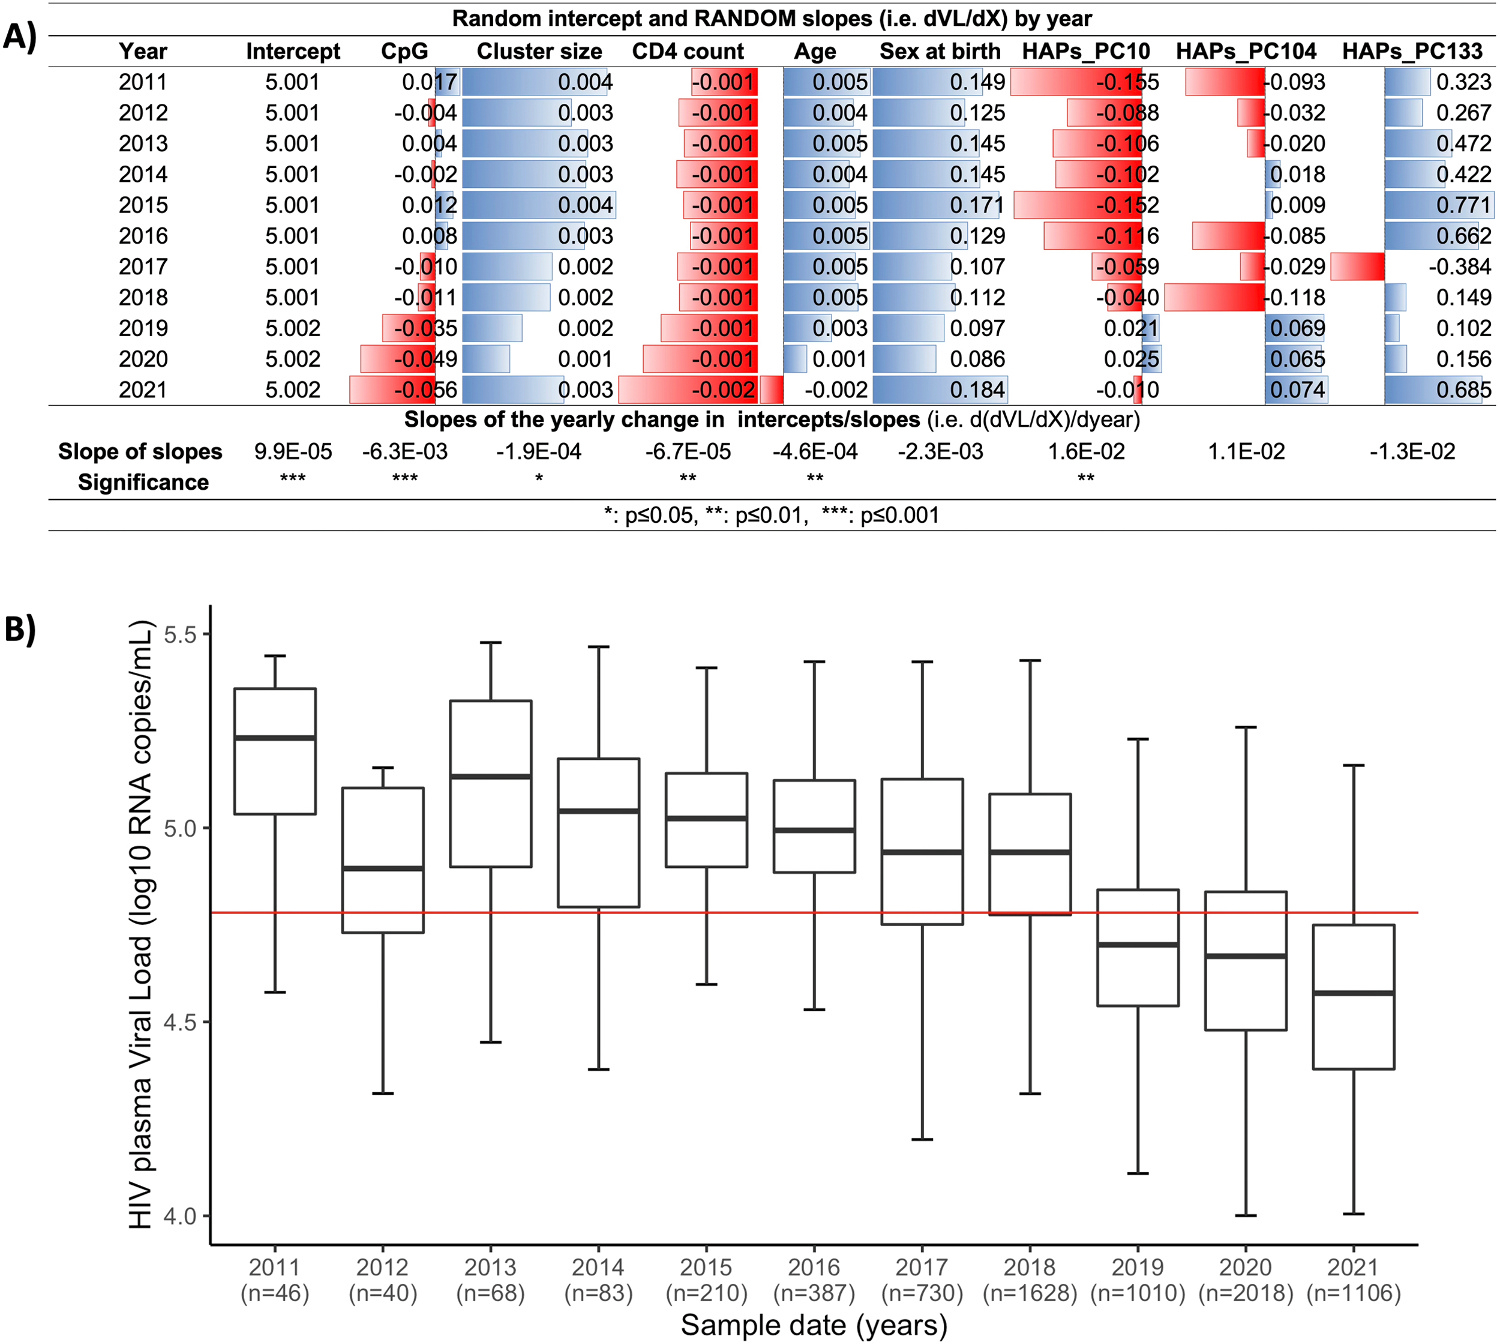
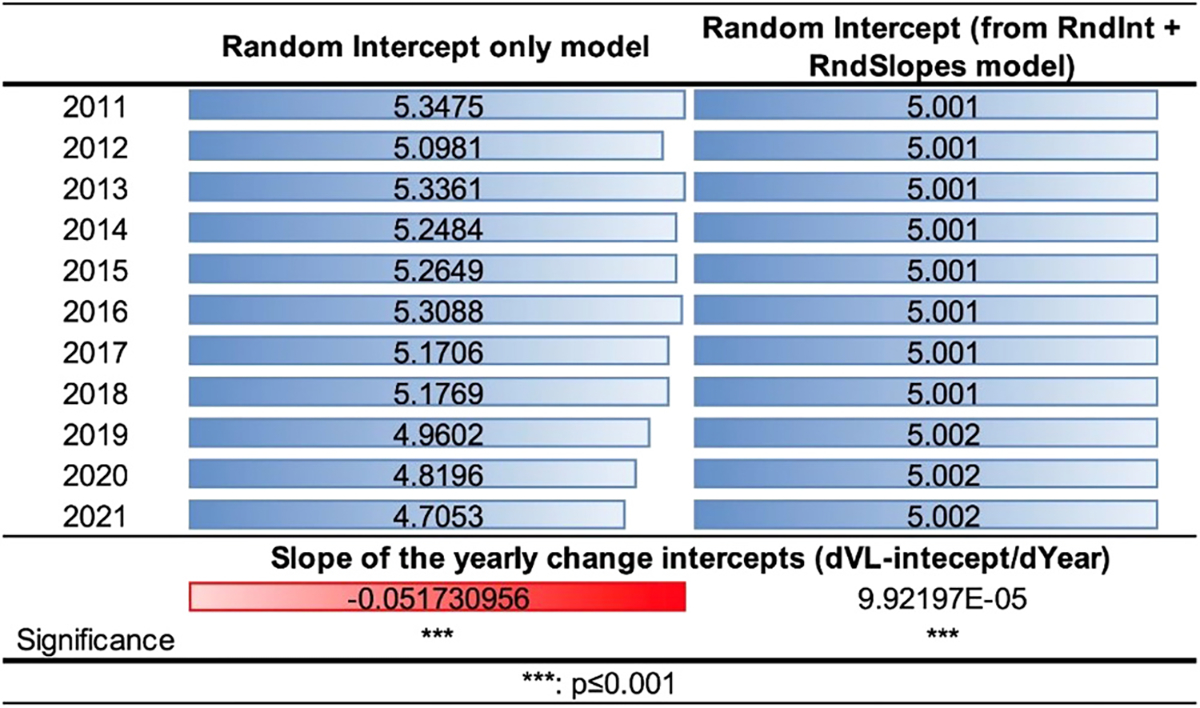
In the context of infectious diseases, the dynamic interplay between ever-changing host populations and viral biology demands a more flexible modeling approach than common fixed correlations. Embracing random-effects regression models allows for a nuanced understanding of the intricate ecological and evolutionary dynamics underlying complex phenomena, offering valuable insights into disease progression and transmission patterns. In this article, we employed a random-effects regression to model an observed decreasing median plasma viral load (pVL) among individuals with HIV in Mexico City during 2019-2021. We identified how these functional slope changes (i.e. random slopes by year) improved predictions of the observed pVL median changes between 2019 and 2021, leading us to hypothesize underlying ecological and evolutionary factors. Our analysis involved a dataset of pVL values from 7325 ART-naïve individuals living with HIV, accompanied by their associated clinical and viral molecular predictors. A conventional fixed-effects linear model revealed significant correlations between pVL and predictors that evolved over time. However, this fixed-effects model could not fully explain the reduction in median pVL; thus, prompting us to adopt random-effects models. After applying a random effects regression model-with random slopes and intercepts by year-, we observed potential "functional changes" within the local HIV viral population, highlighting the importance of ecological and evolutionary considerations in HIV dynamics: A notably stronger negative correlation emerged between HIV pVL and the CpG content in the pol gene, suggesting a changing immune landscape influenced by CpG-induced innate immune responses that could impact viral load dynamics. Our study underscores the significance of random effects models in capturing dynamic correlations and the crucial role of molecular characteristics like CpG content. By enriching our understanding of changing host-virus interactions and HIV progression, our findings contribute to the broader relevance of such models in infectious disease research. They shed light on the changing interplay between host and pathogen, driving us closer to more effective strategies for managing infectious diseases. SIGNIFICANCE OF THE STUDY: This study highlights a decreasing trend in median plasma viral loads among ART-naïve individuals living with HIV in Mexico City between 2019 and 2021. It uncovers various predictors significantly correlated with pVL, shedding light on the complex interplay between host-virus interactions and disease progression. By employing a random-slopes model, the researchers move beyond traditional fixed-effects models to better capture dynamic correlations and evolutionary changes in HIV dynamics. The discovery of a stronger negative correlation between pVL and CpG content in HIV-pol sequences suggests potential changes in the immune landscape and innate immune responses, opening avenues for further research into adaptive changes and responses to environmental shifts in the context of HIV infection. The study's emphasis on molecular characteristics as predictors of pVL adds valuable insights to epidemiological and evolutionary studies of viruses, providing new avenues for understanding and managing HIV infection at the population level.
Keywords: Biological markers; CpG islands; HIV viral load; Prognostic factors; Regression analysis.
Copyright © 2024 The Authors. Published by Elsevier B.V. All rights reserved.
Conflict of interest statement
Declaration of Competing Interest The authors declare that they have no known competing financial interests or personal relationships that could have appeared to influence the work reported in this paper.
Figures


Similar articles
-
Lack of a significant impact of Gag-Protease-mediated HIV-1 replication capacity on clinical parameters in treatment-naive Japanese individuals.Retrovirology. 2015 Nov 19;12:98. doi: 10.1186/s12977-015-0223-z. Retrovirology. 2015. PMID: 26585907 Free PMC article.
-
Accumulation of Pol Mutations Selected by HLA-B*52:01-C*12:02 Protective Haplotype-Restricted Cytotoxic T Lymphocytes Causes Low Plasma Viral Load Due to Low Viral Fitness of Mutant Viruses.J Virol. 2017 Jan 31;91(4):e02082-16. doi: 10.1128/JVI.02082-16. Print 2017 Feb 15. J Virol. 2017. PMID: 27903797 Free PMC article.
-
Persistent genital tract HIV-1 RNA shedding after change in treatment regimens in antiretroviral-experienced women with detectable plasma viral load.J Womens Health (Larchmt). 2013 Apr;22(4):330-8. doi: 10.1089/jwh.2012.3849. Epub 2013 Mar 26. J Womens Health (Larchmt). 2013. PMID: 23531097 Free PMC article.
-
[Deep lung--cellular reaction to HIV].Rev Port Pneumol. 2007 Mar-Apr;13(2):175-212. Rev Port Pneumol. 2007. PMID: 17492233 Review. Portuguese.
-
Molecular biological assessment methods and understanding the course of the HIV infection.APMIS Suppl. 2003;(114):1-37. APMIS Suppl. 2003. PMID: 14626050 Review.
References
-
- Avila-Ríos S, García-Morales C, Garrido-Rodríguez D, Tapia-Trejo D, Girón-Callejas AC, Mendizabál-Burastero R, Escobar-Urias IY, García-González BL, Navas-Castillo S, Pinzón-Meza R, 2015a. HIV-1 drug resistance surveillance in antiretroviral treatment-naive individuals from a reference hospital in Guatemala, 2010–2013. AIDS Res. Hum. Retrovir. 31, 401–411. - PubMed
-
- Avila-Ríos S, García-Morales C, Garrido-Rodríguez D, Tapia-Trejo D, Girón-Callejas AC, Mendizábal-Burastero R, Escobar-Urias IY, García-González BL, Navas-Castillo S, Pinzón-Meza R, Mejía-Villatoro CR, Reyes-Terán G, 2015b. HIV-1 drug resistance surveillance in antiretroviral treatment-naive individuals from a reference hospital in Guatemala, 2010–2013. AIDS Res. Hum. Retrovir. 31 10.1089/aid.2014.0057. - DOI - PubMed
-
- Bahemana E, Esber A, Dear N, Ganesan K, Parikh A, Reed D, Maganga L, Khamadi S, Mizinduko M, Lwilla A, Mkondoo D, Mwaisanga G, Somi N, Owouth J, Maswai J, Kiweewa F, Iroezindu M, Ake JA, Crowell TA, Valcour VG, Polyak CS, Hern J, Duff E, Reynolds A, Bartolanzo D, Song K, Milazzo M, Francisco L, Schech S, Golway A, Mebrahtu T, Lee E, Bohince K, Hamm T, Lombardi K, Imbach M, Eller L, Peel S, Malia J, Kroidl A, Kroidl I, Geldmacher C, Kafeero C, Nambuya A, Tegamanyi J, Birungi H, Mugagga O, Nassali G, Wangiri P, Nantabo M, Nambulondo P, Atwijuka B, Asiimwe A, Nabanoba CT, Semwogerere M, Mwesigwa R, Jjuuko S, Namagembe R, Bagyendagye E, Tindikahwa A, Rwomushana I, Ssentongo F, Kibuuka H, Millard M, Kapkiai J, Wangare S, Mangesoi R, Chepkwony P, Bor L, Maera E, Kasembeli A, Rotich J, Kipkoech C, Chepkemoi W, Rono A, Kesi Z, Ngeno J, Langat E, Labosso K, Langat K, Kirui R, Rotich L, Mabwai M, Chelangat E, Agutu J, Tonui C, Changwony E, Bii M, Chumba E, Korir J, Sugut J, Gitonga D, Ngetich R, Kiprotich S, Rehema W, Ogari C, Ouma I, Adimo O, Ogai S, Okwaro C, Maranga E, Ochola J, Obambo K, Sing’oei V, Otieno L, Nyapiedho O, Sande N, Odemba E, Wanjiru F, Chiweka E, Kiliba P, Mwaipopo M, Muhumuza J, Mkingule N, Mwasulama O, Sanagare A, Kishimbo P, David G, Mbwayu F, Mwamwaja J, Likiliwike J, Muhumuza J, Mcharo R, Mkingule N, Mwasulama O, Mtafya B, Lueer C, Kisinda A, Mbena T, Mfumbulwa H, Mwandumbya L, Edwin P, Olomi W, Adamu Y, Akintunde A, Tiamiyu AB, Afoke K, Mohammed S, Harrison NE, Agbaim UC, Adegbite OA, Parker Z, Adelakun GA, Oni FO, Ndbuisi RO, Elemere J, Azuakola N, Williams TT, Ayogu M, Enas O, Enameguono O, Odo AF, Ukaegbu IC, Ugwuezumba O, Odeyemi SO, Okeke NC, Umeji L, Rose A, Daniel H, Nwando H, Nicholas EI, Iyanda T, Okolo C, Mene VY, Dogonyaro B, Olabulo O, Akinseli O, Onukun F, Knopp G, 2020. Impact of age on CD4 recovery and viral suppression over time among adults living with HIV who initiated antiretroviral therapy in the African Cohort Study. AIDS Res. Ther. 17, 1–8. 10.1186/S12981-020-00323-X. - DOI - PMC - PubMed
MeSH terms
Grants and funding
LinkOut - more resources
Full Text Sources
Medical
Research Materials
