Brain Expression Levels of Commonly Measured Blood Biomarkers of Neurological Damage Differ with Respect to Sex, Race, and Age
- PMID: 38762083
- PMCID: PMC11580823
- DOI: 10.1016/j.neuroscience.2024.05.017
Brain Expression Levels of Commonly Measured Blood Biomarkers of Neurological Damage Differ with Respect to Sex, Race, and Age
Abstract
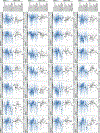
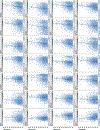
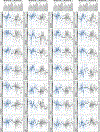
It is increasingly evident that blood biomarkers have potential to improve the diagnosis and management of both acute and chronic neurological conditions. The most well-studied candidates, and arguably those with the broadest utility, are proteins that are highly enriched in neural tissues and released into circulation upon cellular damage. It is currently unknown how the brain expression levels of these proteins is influenced by demographic factors such as sex, race, and age. Given that source tissue abundance is likely a key determinant of the levels observed in the blood during neurological pathology, understanding such influences is important in terms of identifying potential clinical scenarios that could produce diagnostic bias. In this study, we leveraged existing mRNA sequencing data originating from 2,642 normal brain specimens harvested from 382 human donors to examine potential demographic variability in the expression levels of genes which code for 28 candidate blood biomarkers of neurological damage. Existing mass spectrometry data originating from 26 additional normal brain specimens harvested from 26 separate human donors was subsequently used to tentatively assess whether observed transcriptional variance was likely to produce corresponding variance in terms of protein abundance. Genes associated with several well-studied or emerging candidate biomarkers including neurofilament light chain (NfL), ubiquitin carboxyl-terminal hydrolase isozyme L1 (UCH-L1), neuron-specific enolase (NSE), and synaptosomal-associated protein 25 (SNAP-25) exhibited significant differences in expression with respect to sex, race, and age. In many instances, these differences in brain expression align well with and provide a mechanistic explanation for previously reported differences in blood levels.
Keywords: blood biomarkers; concussion; demographics; neurodegenerative disease; stroke; traumatic brain injury.
Copyright © 2024 The Author(s). Published by Elsevier Inc. All rights reserved.
Conflict of interest statement
Conflict of interest
The authors affirm they have no potential conflicts of interest.
Figures


Similar articles
-
Plasma biomarkers in chronic single moderate-severe traumatic brain injury.Brain. 2024 Nov 4;147(11):3690-3701. doi: 10.1093/brain/awae255. Brain. 2024. PMID: 39315931 Free PMC article.
-
Time course and diagnostic utility of NfL, tau, GFAP, and UCH-L1 in subacute and chronic TBI.Neurology. 2020 Aug 11;95(6):e623-e636. doi: 10.1212/WNL.0000000000009985. Epub 2020 Jul 8. Neurology. 2020. PMID: 32641529 Free PMC article.
-
High Levels of NfL, GFAP, TAU, and UCH-L1 as Potential Predictor Biomarkers of Severity and Lethality in Acute COVID-19.Mol Neurobiol. 2024 Jun;61(6):3545-3558. doi: 10.1007/s12035-023-03803-z. Epub 2023 Nov 24. Mol Neurobiol. 2024. PMID: 37996731 Free PMC article.
-
Neurofilament light chain as a biomarker in neurological disorders.J Neurol Neurosurg Psychiatry. 2019 Aug;90(8):870-881. doi: 10.1136/jnnp-2018-320106. Epub 2019 Apr 9. J Neurol Neurosurg Psychiatry. 2019. PMID: 30967444 Review.
-
A Narrative Review of Existing and Developing Biomarkers in Acute Traumatic Brain Injury for Potential Military Deployed Use.Mil Med. 2024 May 18;189(5-6):e1374-e1380. doi: 10.1093/milmed/usad433. Mil Med. 2024. PMID: 37995274 Review.
References
-
- Andreou D, Steen NE, Jørgensen KN, Smelror RE, Wedervang-Resell K, Nerland S, Westlye LT, Nærland T, Myhre AM, Joa I, Reitan SMK, Vaaler A, Morken G, Bøen E, Elvsåshagen T, Boye B, Malt UF, Aukrust P, Skrede S, Kroken RA, Johnsen E, Djurovic S, Andreassen OA, Ueland T, Agartz I, 2023. Lower circulating neuron-specific enolase concentrations in adults and adolescents with severe mental illness. Psychol. Med. 53, 1479–1488. 10.1017/S0033291721003056. - DOI - PMC - PubMed
-
- Bazarian JJ, Biberthaler P, Welch RD, Lewis LM, Barzo P, Bogner-Flatz V, Gunnar Brolinson P, Büki A, Chen JY, Christenson RH, Hack D, Huff JS, Johar S, Jordan JD, Leidel BA, Lindner T, Ludington E, Okonkwo DO, Ornato J, Peacock WF, Schmidt K, Tyndall JA, Vossough A, Jagoda AS, 2018. Serum GFAP and UCH-L1 for prediction of absence of intracranial injuries on head CT (ALERT-TBI): a multicentre observational study. Lancet Neurol. 17, 782–789. 10.1016/S1474-4422(18)30231-X. - DOI - PubMed
-
- Beach TG, Adler CH, Sue LI, Serrano G, Shill HA, Walker DG, Lue L, Roher AE, Dugger BN, Maarouf C, Birdsill AC, Intorcia A, Saxon-Labelle M, Pullen J, Scroggins A, Filon J, Scott S, Hoffman B, Garcia A, Caviness JN, Hentz JG, Driver-Dunckley E, Jacobson SA, Davis KJ, Belden CM, Long KE, MalekAhmadi M, Powell JJ, Gale LD, Nicholson LR, Caselli RJ, Woodruff BK, Rapscak SZ, Ahern GL, Shi J, Burke AD, Reiman EM, Sabbagh MN, 2015. Arizona study of aging and neurodegenerative disorders and brain and body donation program. Neuropathology 35, 354–389. 10.1111/neup.12189. - DOI - PMC - PubMed
MeSH terms
Substances
Grants and funding
LinkOut - more resources
Full Text Sources
Miscellaneous

