. 2024 May 18;25(1):212.
doi: 10.1186/s12931-024-02832-z.

YAP/TAZ activation mediates PQ-induced lung fibrosis by sustaining senescent pulmonary epithelial cells

Affiliations

YAP/TAZ activation mediates PQ-induced lung fibrosis by sustaining senescent pulmonary epithelial cells

Youjia Yu et al. Respir Res. .

Abstract

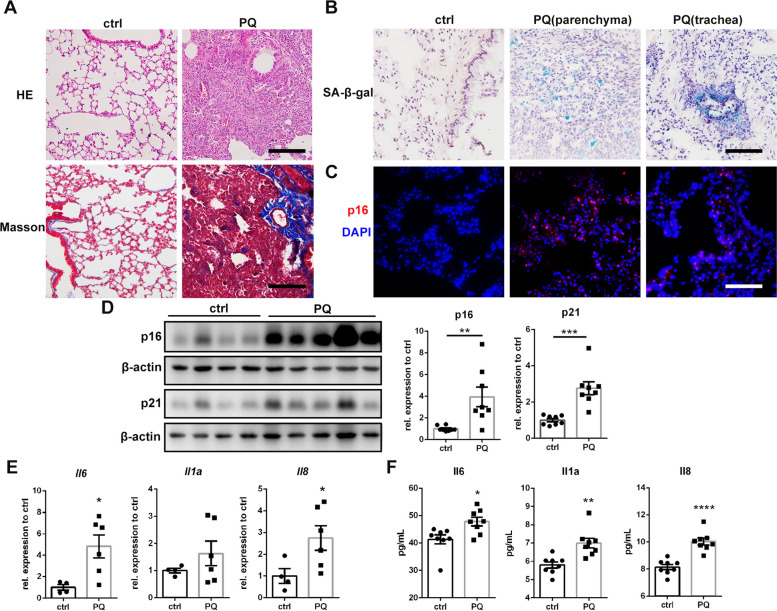
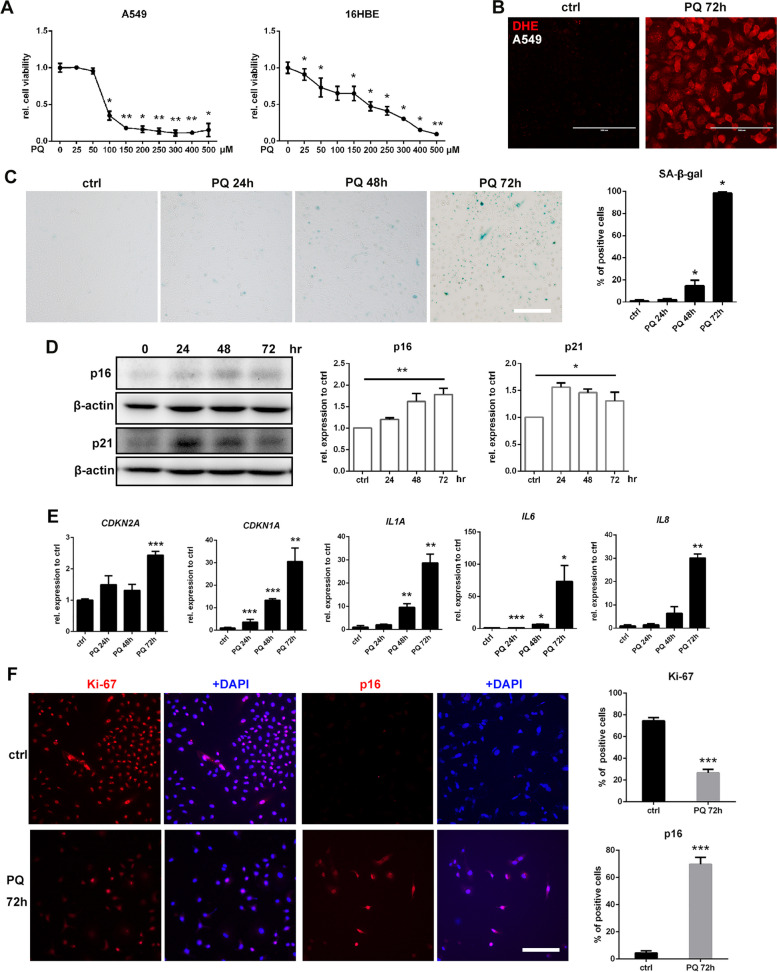
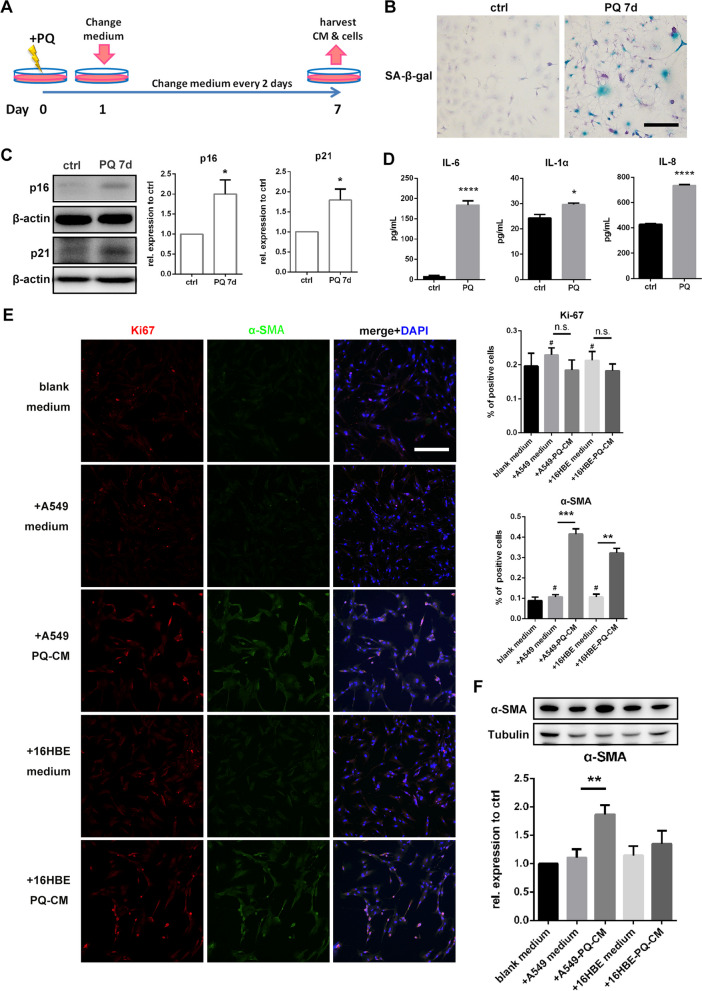
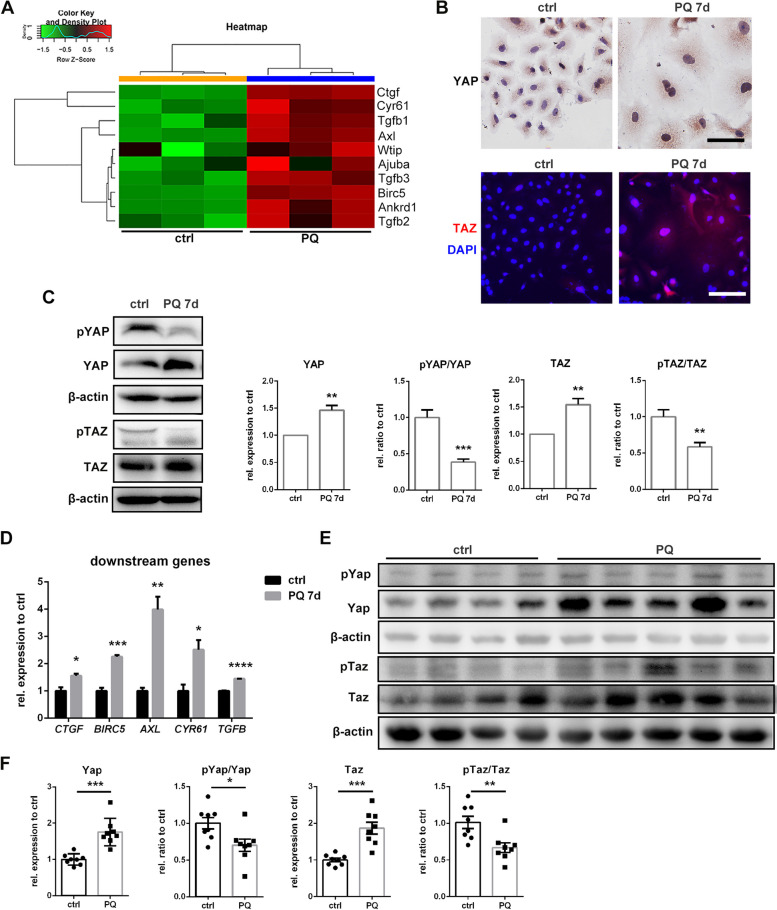
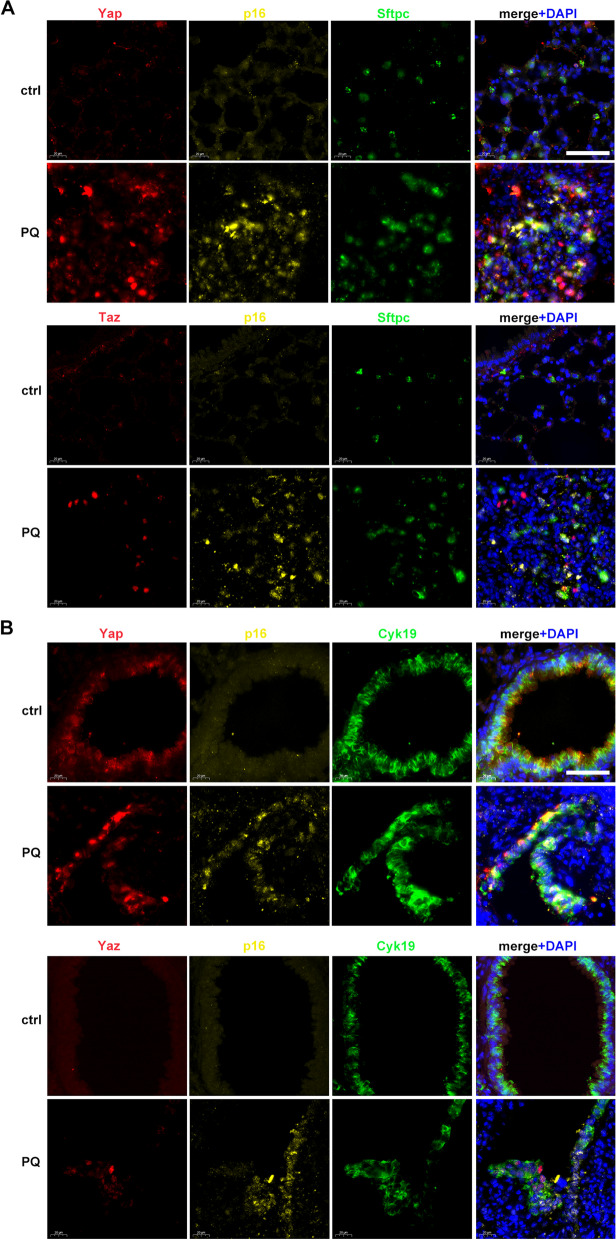
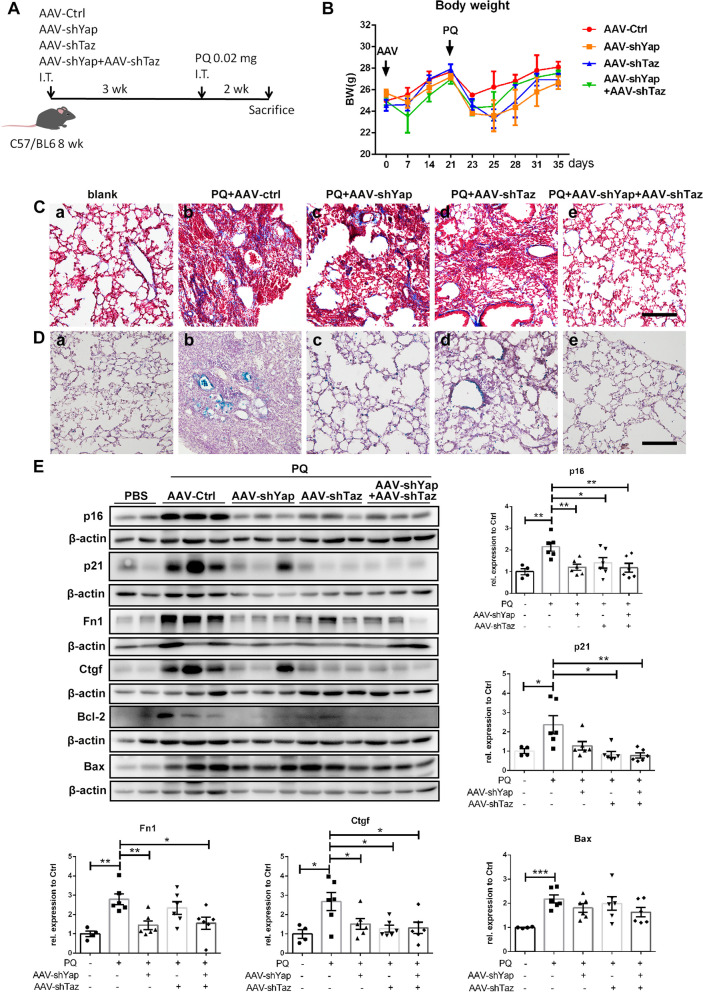
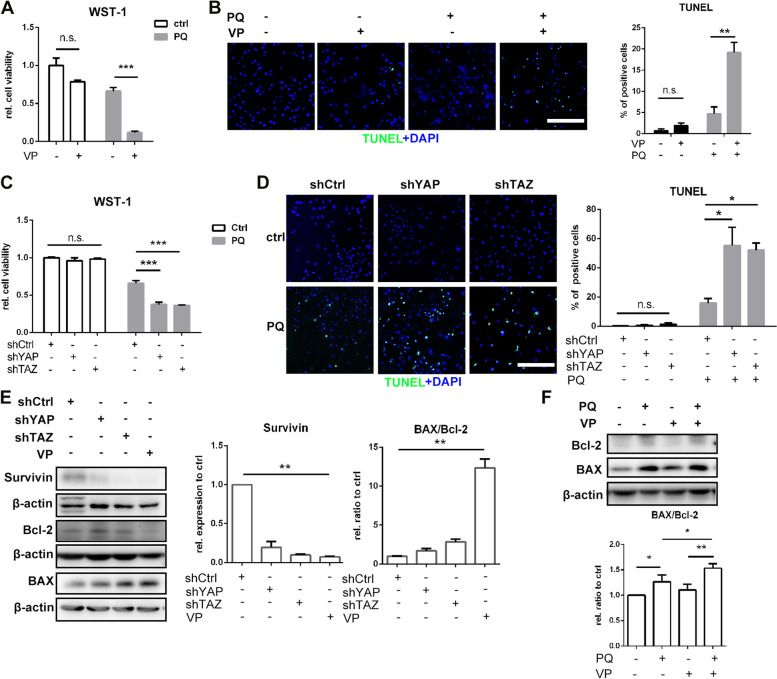
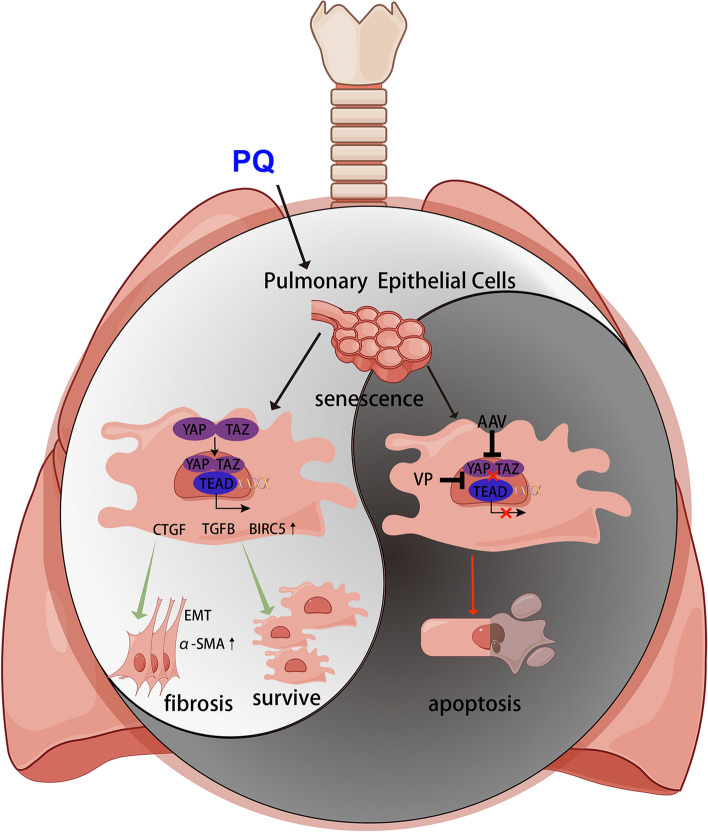
Paraquat (PQ) is a widely used herbicide and a common cause of poisoning that leads to pulmonary fibrosis with a high mortality rate. However, the underlying mechanisms of PQ-induced pulmonary fibrosis and whether pulmonary epithelial cell senescence is involved in the process remain elusive. In this study, PQ-induced pulmonary epithelial cell senescence and Hippo-YAP/TAZ activation were observed in both C57BL/6 mice and human epithelial cells. PQ-induced senescent pulmonary epithelial cells promoted lung fibroblast transformation through secreting senescence-associated secretory phenotype (SASP) factors. Yap/Taz knockdown in mice lungs significantly decreased the expression of downstream profibrotic protein Ctgf and senescent markers p16 and p21, and alleviated PQ-induced pulmonary fibrosis. Interfering YAP/TAZ in senescent human pulmonary epithelial cells resulted in decreased expression of the anti-apoptosis protein survivin and elevated level of apoptosis. In conclusion, our findings reveal a novel mechanism by which the involvement of Hippo-YAP/TAZ activation in pulmonary epithelial cell senescence mediates the pathogenesis of PQ-induced pulmonary fibrosis, thereby offering novel insights and potential targets for the clinical management of PQ poisoning as well as providing the mechanistic insight of the involvement of Yap/Taz activation in cell senescence in pulmonary fibrosis and its related pulmonary disorders. The YIN YANG balance between cell senescence and apoptosis is important to maintain the homeostasis of the lung, the disruption of which will lead to disease.

Keywords: Cellular senescence; Paraquat; Poisoning; Pulmonary epithelial cell; Pulmonary fibrosis; YAP/TAZ.


Conflict of interest statement

The authors declare no competing interests.

Figures

Fig. 1
Fig. 1
Paraquat treatment induces pulmonary cellular senescence in mice: A HE staining and Masson’s trichrome staining of representative lung sections from control and PQ group (original magnification 100×, scale bar = 400 μm), B SA-β-gal staining of parenchyma and trachea in lung tissues (original magnification 200×, scale bar = 200 μm), C representative images of immunoflourescence staining for p16 (red) and DAPI (blue) in lung sections (original magnification 200×, scale bar = 200 μm), D total lung protein was assessed for p16 and p21, with β-actin as loading control (N = 8) by Western blotting, E relative mRNA levels of SASP markers Il6, Il1a and Il8 compared to Actb in total lung tissues (N = 4 for ctrl group, N = 6 for PQ group) were analyzed by qRT-PCR, F serum levels of SASP markers Il-6, Il-1α and Il-8 (N = 8) were tested by ELISA assay. Values are shown as mean ± SEM. Data were analyzed by Student’s t test. * P < 0.05, ** P < 0.01, *** P < 0.005, **** P < 0.001
Fig. 2
Fig. 2
Paraquat induces pulmonary epithelial cell senescence in vitro: A WST-1 analysis shows dose-dependent decreases of A549 and 16HBE cells after PQ exposure for 72 h, B ROS content in A549 cells after treated with 80 µM PQ for 72 h was analyzed with DHE staining (red) (original magnification 200×, scale bar = 200 μm), C A549 cells were stained with SA-β-gal after treated with 80 µM PQ for 24 h, 48 h and 72 h (original magnification 200×, scale bar = 200 μm), and quantification of positive cells, D A549 cells treated with 80 µM PQ for 24 h, 48 h and 72 h were harvested and assessed for p16 and p21, with β-actin as loading control by Western blotting, E relative mRNA levels of CDKN2A (p16), CDKN1A (p21), and SASP markers IL6, IL1a and IL8 compared to ACTB in A549 cells treated with 80 µM PQ for 24 h, 48 h and 72 h were analyzed by qRT-PCR. F immunoflourescence staining of A549 cells treated with 80 µM PQ for 72 h for Ki-67 (red), p16 (red) and DAPI (blue) (original magnification 200×, scale bar = 200 μm), and quantification of positive cells. All statistical data were from three independent experiments. Values are shown as mean ± SEM. Data were analyzed by Student’s t test between 2 groups, and one-way ANOVA with the Dunnett’s correction was used for comparisons among multiple groups. * P < 0.05, ** P < 0.01, *** P < 0.005
Fig. 3
Fig. 3
Senescent lung epithelial cells promote lung fibroblast transformation via secreting SASP factors: A Schematic illustration of the establishment of senescent lung epithelial cell model. A549 and 16HBE cells were exposed to 200 µM PQ for 24 h, and then changed with fresh medium for continuous 6-day culture. Cells and supernatant (PQ-conditional medium, PQ-CM) were harvested at the 7th day; medium incubated with untreated cells for 48 h were harvested as control medium, B A549 cells were stained with SA-β-gal after exposed to 200 µM PQ for 24 h and continuously cultured for 6 days (original magnification 200×, scale bar = 200 μm), C A549 cells harvested at the 7th day were assessed for p16 and p21, with β-actin as loading control by Western blotting, D SASP markers IL-6, IL-1α and IL-8 in the supernatant were tested by ELISA assay, E immunoflourescence staining of HLF cells after 72 h incubation with A549 and 16HBE CM for Ki-67 (red), α-SMA (green) and DAPI (blue) (original magnification 200×, scale bar = 200 μm), and quantification of positive cells, F HLF cells incubated with CM for 72 h were assessed for α-SMA, with Tubulin as loading control by Western blotting. All statistical data were from three independent experiments. Values are shown as mean ± SEM. Data were analyzed by Student’s t test. * P < 0.05, ** P < 0.01, *** P < 0.005, **** P < 0.001, n.s. no statistical significance, # no statistical significance compared to blank medium group
Fig. 4
Fig. 4
YAP and TAZ are activated during paraquat induced pulmonary cellular senescence in vivo and in vitro: A Heatmap of Yap/Taz downstream genes in lungs of PQ treated mice and control mice from RNAseq data, B immunohistochemistry staining for YAP and immunoflourescence staining for TAZ (red) and DAPI (blue) in senescent A549 cells (original magnification 400×, scale bar = 100 μm), C senescent A549 cells were assessed for pYAP, YAP, pTAZ, and TAZ, with β-actin as loading control by Western blotting, D relative mRNA levels of YAP/TAZ downstream genes compared to ACTB in senescent A549 cells were analyzed by qRT-PCR, E, F total lung protein was assessed for pYap, Yap, pTaz and Taz, with β-actin as loading control (N = 8) by Western blotting. All statistical data for were from three independent experiments in vitro. Values are shown as mean ± SEM. Data were analyzed by Student’s t test. * P < 0.05, ** P < 0.01, *** P < 0.005, **** P < 0.001
Fig. 5
Fig. 5
Co-locolization of Yap/Taz and p16 is observed in type II alveolar epithelial cells and bronchial epithelial cells: A representative images of immunoflourescence staining for Yap or Taz (red), p16 (yellow), type II alveolar epithelial cell marker Sftpc (green) and DAPI (blue) in lung sections of PQ group and control group (original magnification 400×, scale bar = 100 μm), B representative images of immunoflourescence staining for Yap or Taz (red), p16 (yellow), bronchial epithelial cell marker Cytokeratin 19 (Cyk19, green) and DAPI (blue) in lung sections of control and PQ  groups (original magnification 400×, scale bar = 100 μm)
Fig. 6
Fig. 6
Yap and Taz knockdown abrogates paraquat-Induced pulmonary fibrosis in vivo: (A) Schematic illustration of the animal experiment. C57BL/6 mice were intratracheal infected with 5 × 1010 PFU of AAV-Ctrl, AAV-shYap, AAV-shTaz or both AAV-shYap and AAV-shTaz, and intratracheal instillated with 0.02 mg PQ at day 21 postinfection. PBS was intratracheal instillated at day 0 and day 21 as blank control, (B) body weight of mice in each group, (C) Masson’s trichrome staining (original magnification 100×, scale bar = 400 μm) and (D) SA-β-gal staining (original magnification 100×, scale bar = 400 μm)  of representative lung sections from each group: (a) blank control group, (b) AAV-Ctrl group, (c) AAV-shYap group, (d) AAV-shTaz group, (e) AAV-Yap + AAV-shTaz group, (E) total lung protein was assessed for p16, p21, Fn1, Ctgf, Bcl-2 and Bax, with β-actin as loading control by Western blotting (N = 4 for PBS group, N = 6 for other groups). All graphs are shown as mean ± SEM. Parametric variables were calculated using two-tailed Student’s t test between 2 groups. * P < 0.05, ** P < 0.01, *** P < 0.005
Fig. 7
Fig. 7
YAP and TAZ inhibition promotes paraquat induced senescent cells to apoptosis: A549 cells were treated with 2 µM verteporfin (VP) for 24 h and than treated with 200 µM PQ for 24 h, and detected after another 24 h. Cell viability was assessed by WST-1 analysis (A), apoptosis was detected by TUNEL staining (original magnification 200×, scale bar = 200 μm), and positive cells were quantified (B). A549 cells were infected with lentivirus interfering YAP (shYAP), TAZ (shTAZ) or control lentivirus seperately for 24 h and than treated with 200 µM PQ for 24 h, and detected after another 24 h. Cell viability was assessed by WST-1 analysis (C), apoptosis was detected by TUNEL staining (original magnification 200×, scale bar = 200 μm), and positive cells were quantified (D). E Senescent A549 cells treated with lentivirus or VP for 48 h were assessed for Survivin, Bcl-2 and BAX, with β-actin as loading control by Western blotting, (F) A549 cells treated with PQ for 48 h and VP for 24 h were assessed for Bcl-2 and BAX, with β-actin as loading control by Western blotting. All statistical data were from three independent experiments. Values are shown as mean ± SEM. Data were analyzed by Student’s t test between 2 groups, and one-way ANOVA with the Dunnett’s correction was used for comparisons among multiple groups. * P < 0.05, ** P < 0.01, *** P < 0.005, n.s.: no significance
Fig. 8
Fig. 8
Overview of the present study

Similar articles

References

    1. Monte AA, Sun H, Rapp-Olsson AM, Mohamed F, Gawarammana I, Buckley NA, Evans CM, Yang IV, Schwartz DA. The plasma concentration of MUC5B is Associated with clinical outcomes in paraquat-poisoned patients. Am J Resp Crit Care. 2018;197(5):663–5. doi: 10.1164/rccm.201705-0866LE. - DOI - PMC - PubMed
    1. Chinta SJ, Woods G, Demaria M, Rane A, Zou Y, McQuade A, Rajagopalan S, Limbad C, Madden DT, Campisi J, Andersen JK. Cellular Senescence is Induced by the Environmental Neurotoxin Paraquat and contributes to Neuropathology Linked to Parkinson’s Disease. Cell Rep. 2018;22(4):930–40. doi: 10.1016/j.celrep.2017.12.092. - DOI - PMC - PubMed
    1. Dinis-Oliveira RJ, Duarte JA, Sánchez-Navarro A, Remiao F, Bastos ML, Carvalho F. Paraquat poisonings:: mechanisms of lung toxicity, clinical features, and treatment. Crit Rev Toxicol. 2008;38(1):13–71. doi: 10.1080/10408440701669959. - DOI - PubMed
    1. Liu XB, Yang H, Liu ZN. Signaling pathways involved in paraquat-induced pulmonary toxicity: Molecular mechanisms and potential therapeutic drugs. Int Immunopharmacol 2022, 113. - PubMed
    1. Yin Y, Guo X, Zhang SL, Sun CY. Analysis of Paraquat Intoxication Epidemic (2002–2011) within China. Biomed Environ Sci. 2013;26(6):509–12. - PubMed

MeSH terms