. 2024 May 18;15(1):4237.
doi: 10.1038/s41467-024-48597-3.

Hsc70 promotes anti-tumor immunity by targeting PD-L1 for lysosomal degradation

Affiliations

Hsc70 promotes anti-tumor immunity by targeting PD-L1 for lysosomal degradation

Xiaoyan Xu et al. Nat Commun. .

Abstract

Immune checkpoint inhibition targeting the PD-1/PD-L1 pathway has become a powerful clinical strategy for treating cancer, but its efficacy is complicated by various resistance mechanisms. One of the reasons for the resistance is the internalization and recycling of PD-L1 itself upon antibody binding. The inhibition of lysosome-mediated degradation of PD-L1 is critical for preserving the amount of PD-L1 recycling back to the cell membrane. In this study, we find that Hsc70 promotes PD-L1 degradation through the endosome-lysosome pathway and reduces PD-L1 recycling to the cell membrane. This effect is dependent on Hsc70-PD-L1 binding which inhibits the CMTM6-PD-L1 interaction. We further identify an Hsp90α/β inhibitor, AUY-922, which induces Hsc70 expression and PD-L1 lysosomal degradation. Either Hsc70 overexpression or AUY-922 treatment can reduce PD-L1 expression, inhibit tumor growth and promote anti-tumor immunity in female mice; AUY-922 can further enhance the anti-tumor efficacy of anti-PD-L1 and anti-CTLA4 treatment. Our study elucidates a molecular mechanism of Hsc70-mediated PD-L1 lysosomal degradation and provides a target and therapeutic strategies for tumor immunotherapy.


Conflict of interest statement

X.X., H.X., T.X., M.Z., Y.X. and Z.C. have filed a patent application “the use of drug combinations, 202311744204.1”. The remaining authors declare no other competing interests.

Figures

Fig. 1
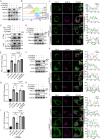
Fig. 1. Hsc70 promotes PD-L1 degradation through lysosome.
A HEK293T cells were transfected with Flag or PD-L1-Flag for 24 h, Flag-tagged PD-L1 were trypsin-digested and protein identification and quantitation was through LC-MS/MS. The top-twenty PD-L1-interacting proteins were identified by Mass spectrometry. B, C MCF-7 cells were transfected with 1 μg and 2 μg Hsc70-Flag for 24 h, and total PD-L1 levels were detected by western blotting (B), fluorescence of PD-L1 on the surface of cell membrane was analyzed by flow cytometry (C). D MCF-7 cells were transfected with Flag or Hsc70-Flag for 12 h, treated with or without MG132 (10 μM), NH4Cl (20 mM), Leupeptin (100 nM), 3-MA (5 mM), E-64D (10 μM) for another 12 h. Cell lysates were immunoblotted with indicated antibodies. E, F MCF-7 cells were transfected with 1 μg, 2 μg or 4 μg Lamp2a-Flag for 24 h. Indicated protein levels were detected by western blotting (E), fluorescence of PD-L1 on the surface of cell membrane was analyzed by flow cytometry, n = 6, ns: not significance (F). G, H MCF-7 cells were transfected with siRNAs of Lamp2a for 36 h, transfected with or without Hsc70-Flag for another 24 h. Cell lysates were immunoblotted with indicated antibodies (G), fluorescence of PD-L1 on the surface of cell membrane was analyzed by flow cytometry (H). I, J MCF-7 cells were treated with Spautin-1 (10 μM) and AC220 (2 μM) for 0, 2, 4, 8, and 12 h. Cell lysates were immunoblotted with indicated antibodies (I), fluorescence of PD-L1 on the surface of cell membrane was analyzed by flow cytometry, n = 6, ns: not significance (J). For (C, F, H, J), MCF-7 cells were seeded in 48-well plate with 6 replicates per group and subjected to the corresponding treatment, repeated independently three times and similar results were obtained. Data shown in (B, D, E, G, I) were repeated independently three times with similar results. Data represent Mean ± SEM, for (F) and (J) data, two-sided with adjustment of Tukey’s multiple comparisons, one-way ANOVA. The numbers under blots represent the value (the ratio to Tubulin) of grayscale quantification. Source data are provided as a Source data file.
Fig. 2
Fig. 2. Hsc70 induces PD-L1 degradation via eMI.
A, B MCF-7 cells were transfected with siRNAs of TSG101 for 36 h, transfected with or without Hsc70-Flag for another 24 h. Cell lysates were immunoblotted with indicated antibodies (A), fluorescence of PD-L1 on the surface of cell membrane was analyzed by flow cytometry (B). C, D MCF-7 cells were transfected with siRNAs of VPS4 for 36 h, transfected with or without Hsc70-Flag for another 24 h. Cell lysates were immunoblotted with indicated antibodies (C), fluorescence of PD-L1 on the surface of cell membrane was analyzed by flow cytometry (D). E, F MCF-7 cells were transfected with Flag or Hsc70-Flag for 12 h, treated with or without U18666A (5 μg/mL) for another 12 h. PD-L1 levels were detected by western blotting (E), fluorescence of PD-L1 on the surface of cell membrane was analyzed by flow cytometry (F). G, H MCF-7 cells were transfected with Hsc70-WT-Flag or Hsc70-3KA-Flag plasmids for 24 h. PD-L1 protein levels were detected by western blotting (G), fluorescence of PD-L1 on the surface of cell membrane was analyzed by flow cytometry (H). IK MCF-7 cells were transfected with Flag, Hsc70-WT-Flag or Hsc70-3KA-Flag for 8 h, the co-localization between RAB7A and PD-L1 (I), the co-localization between LAMP1 and PD-L1 (J), the co-localization between RAB11 and PD-L1 (K) were done using immunofluorescence and confocal microscopy. Scale bar, 5 μm. The intensity profiles along the yellow line are plotted in the middle panels, with the colocalizing sites marked by white. For (B, D, F, H), MCF-7 cells were seeded in 48-well plate with 6 replicates per group and subjected to the corresponding treatment, repeated independently three times and similar results were obtained. Data shown in (A), (C), (E), (G), and (IK) were repeated independently three times and similar results were obtained. The numbers under blots represent the value (the ratio to Tubulin) of grayscale quantification. Source data are provided as a Source data file.
Fig. 3
Fig. 3. Hsc70 competes with CMTM6 for binding and regulation of PD-L1.
A, B MCF-7 cells were transfected with siRNA of Hsc70 and CMTM6 for 60 h, PD-L1 levels were detected by western blotting (A), fluorescence of PD-L1 on the surface of cell membrane was analyzed by flow cytometry (B). C HEK293T cells were transfected with siRNA of CMTM6 for 48 h, then transfected with PD-L1-Flag for another 12 h, the interaction between Hsc70 and PD-L1 was detected by immunoprecipitation. D, E MCF-7 cells were transfected with siRNAs of CMTM6 and TSG101 for 60 h, cell lysates were immunoblotted with indicated antibodies (D), fluorescence of PD-L1 on the surface of cell membrane was analyzed by flow cytometry, n = 6 (E). F, G MCF-7 cells were transfected with siRNAs of CMTM6 and VPS4 for 60 h, cell lysates were immunoblotted with indicated antibodies (F), fluorescence of PD-L1 on the surface of cell membrane was analyzed by flow cytometry, n = 6 (G). H, I MCF-7 cells were transfected with siRNA of CMTM6 for 48 h, treated with or without U18666A (5 μg/mL) for another 12 h, PD-L1 levels were detected by western blotting (H), fluorescence of PD-L1 on the surface of cell membrane was analyzed by flow cytometry, n = 6 (I). JL MCF-7 cells were transfected with indicated siRNAs for 36 h and the co-localization between RAB7A and PD-L1 (J), the co-localization between LAMP1 and PD-L1 (K), the co-localization between RAB11 and PD-L1 (L) were done using immunofluorescence and confocal microscopy. Scale bar, 5 μm. The intensity profiles along the yellow line are plotted in the middle panels, with the colocalizing sites marked by white. For (B, E, G, I), MCF-7 cells were seeded in 48-well plate with 6 replicates per group and subjected to the corresponding treatment, repeated independently three times and similar results were obtained. Data shown in (A), (C), (D), (F), (H), and (JL) were repeated independently three times with similar results. Data represent Mean ± SEM, for (E, G, I) data, two-sided with adjustment of Tukey’s multiple comparisons, one-way ANOVA, P value is indicated in the graph. The numbers under blots represent the value (the ratio to Tubulin/Flag) of grayscale quantification. Source data are provided as a Source data file.
Fig. 4
Fig. 4. TFG is involved in endosome-lysosome degradation of PD-L1.
A Volcano map of significantly differentially interaction protein of Hsc70-WT compared with Hsc70-3KA. The significantly down-regulated proteins are marked with blue (FC < 0.5 and p < 0.05), the significantly upregulated proteins are marked with yellow (FC > 2 and p < 0.05), the proteins with no difference are gray. COPII-mediated vesicle transport proteins are marked in red. FC and P values were tested by unpaired t-test, with three mass spectrometry replicates/group. B Differently interaction proteins of Hsc70-WT compared with Hsc70-3KA under biological process classification GO function enrichment diagram. C Ranking of COPII-mediated vesicle transport proteins in PD-L1 interacting proteins. D HEK293T cells were transfected with indicated plasmids for 24 h, the interaction between TFG and Hsc70 was detected by immunoprecipitation. E MCF-7 cells were transfected with 1 μg, 2 μg and 4 μg TFG-Flag for 24 h, PD-L1 levels were detected by western blotting. F MCF-7 cells were transfected with siRNA of TFG for 60 h, indicated protein levels were detected by western blotting. G, H MCF-7 cells were transfected with siRNA of TFG for 36 h, then transfected with or without Hsc70 for another 24 h, indicated protein levels were detected by western blotting (G), fluorescence of PD-L1 on the surface of cell membrane was analyzed by flow cytometry, data represent Mean ± SEM, two-sided with adjustment of Tukey’s multiple comparisons, one-way ANOVA test. n = 4, P value is indicated in the graph (H). I, J MCF-7 cells were transfected with siRNA of TFG for 48 h, then transfected with or without Hsc70 for another 8 h, the co-localization between RAB7A and PD-L1 (I), the co-localization between LAMP1 and PD-L1 (J) were analyzed by immunofluorescence and confocal microscopy. Scale bar, 5 μm. The intensity profiles along the yellow line are plotted in the middle panels, with the colocalizing sites marked by white. For (H), MCF-7 cells were seeded in 24-well plate with 4 replicates per group and subjected to the corresponding treatment, repeated independently three times and similar results were obtained. Data shown in (DG) and (I, J) were repeated independently three times with similar results. The numbers under blots represent the value (the ratio to Tubulin/HA) of grayscale quantification. Source data are provided as a Source data file.
Fig. 5
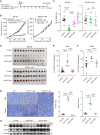
Fig. 5. Hsc70 promotes anti-tumor immunity and PD-L1 degradation in vivo.
A The schematic diagram of 4T1 breast cancer tumor model, created with BioRender.com, released under a Creative Commons Attribution-NonCommercial-NoDerivs 4.0 International license. BD Tumor growth of Control (n = 12), Hsc70-WT (n = 12), and Hsc70-3KA (n = 12) group which injected indicated cells in BALB/c and BALB/c-nude mice and final tumor weights. (Х represents tumor regression during the final dissection). E, F Flow cytometry analysis of CD8+ T cells (E) and CD8+GzmB+ T cells (F) in tumors, Control (n = 12), Hsc70-WT (n = 8) and Hsc70-3KA (n = 12). G Immunohistochemistry analysis of CD8 and GzmB in the 4T1 tumors. Scale bar, 50 μm. n = 5 (each group has 5 tumor tissues, each tissue has 3 random fields). H Indicated protein levels were detected by Immunoblotting with the indicated harvested tumor cells, n = 4 (randomly selected tumor tissues from 4 mice in each group for detection) and repeated independently two times with similar results. Data represent Mean ± SEM, for B data two-way ANOVA, for (C), (EG) data one-way ANOVA, two-sided with adjustment of Tukey’s multiple comparisons, P value is indicated in the graph. The numbers under blots represent the value (the ratio to Tubulin) of grayscale quantification. Source data are provided as a Source data file.
Fig. 6
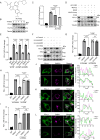
Fig. 6. AUY-922 promotes PD-L1 degradation through Hsc70-mediated eMI.
A Structural formula of AUY-922. B MCF-7 cells were treated with 1 μM AUY-922 for 0, 2, 4, 8, and 12 h. PD-L1 levels were detected by western blotting. C MCF-7 cells were treated with 1 μM AUY-922 for 6 h and 12 h, fluorescence of PD-L1 on the cell membrane was analyzed by flow cytometry, n = 6. D MCF-7 cells were treated with 1 μM AUY-922 for 12 h, treated with or without MG132 (10 μM), NH4Cl (20 mM), Leupeptin (100 nM), 3-MA (5 mM), E-64D (10 μM) for another 12 h. Cell lysates were detected by western blotting. E, F MCF-7 cells were transfected with siRNAs of Lamp2a for 48 h, treated with or without 1 μM AUY-922 for another 12 h. Fluorescence of PD-L1 on the cell membrane was analyzed by flow cytometry, n = 6 (E), cell lysates were detected by western blotting (F). G MCF-7 cells were transfected with siRNAs of TSG101 for 48 h, treated with or without 1 μM AUY-922 for another 12 h. Fluorescence of PD-L1 on the cell membrane was analyzed by flow cytometry, n = 6. H MCF-7 cells were transfected with siRNAs of VPS4 for 48 h, treated with or without 1 μM AUY-922 for another 12 h. Fluorescence of PD-L1 on the cell membrane was analyzed by flow cytometry, n = 6. I MCF-7 cells were treated with 1 μM AUY-922 with or without 5 μg/mL U18666A for 12 h. Fluorescence of PD-L1 on the surface of cell membrane was analyzed by flow cytometry, n = 6. JL MCF-7 cells were treated with 1 μM AUY-922 for 4 h and the co-localization between RAB7A and PD-L1 (J), LAMP1 and PD-L1 (K), RAB11 and PD-L1 (L) were done using immunofluorescence and confocal microscopy. Scale bar, 5 μm. The intensity profiles along the yellow line are plotted in the middle panels, with the colocalizing sites marked by white. For (C, E, GI), MCF-7 cells were seeded in 48-well plate with 6 replicates per group and subjected to the corresponding treatment, repeated independently three times and similar results were obtained. Data shown in (B, D, F) and (JL) were repeated independently three times with similar results. Data represent Mean ± SEM, for (C, E, GI), n = 6, two-sided with adjustment of Tukey’s multiple comparisons, one-way ANOVA, P value is indicated in the graph. The numbers under blots represent the value (the ratio to Tubulin) of grayscale quantification. Source data are provided as a Source data file.
Fig. 7
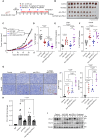
Fig. 7. AUY-922 promotes anti-tumor immunity and enhances the therapeutic effect of aPD-L1 ICI.
A BALB/c mice were inoculated with 4 × 10⁵ 4T1 cells, group administration according to the time points shown in the schematic diagram, created with BioRender.com, released under a Creative Commons Attribution-NonCommercial-NoDerivs 4.0 International license. BD Tumor growth of Control (n = 10), AUY-922 (15 mg/kg, n = 10), Anti-PD-L1 (100 μg, n = 10) and the combination of AUY-922 and anti-PD-L1(AUY-922+anti-PD-L1, n = 10) in BALB/c mice and final tumor weights. (О represents death at the third dose of Anti-PD-L1 administration). E, F Flow cytometry analysis of CD8+ T cells (E) and CD8+GzmB+ T cells (F) in tumors, Control (n = 10), AUY-922 (n = 10), Anti-PD-L1 (n = 8), AUY-922+anti-PD-L1 (n = 10). G Immunohistochemistry analysis of CD8 and GzmB in the 4T1 tumors. Scale bar, 50 μm. n = 5 (each group has 5 tumor tissues with the average of 3 random fields). H Flow cytometry analysis of PD-L1 levels on the surface of cell membrane in tumor cells, Control (n = 10), AUY-922 (n = 10), Anti-PD-L1 (n = 8), AUY-922+anti-PD-L1 (n = 10). I Indicated protein levels were detected by Immunoblotting with the indicated harvested tumor cells. n = 3 (randomly selected tumor tissues from 3 mice in each group for detection) and repeated independently two times with similar results. Data represent Mean ± SEM, for (C) two-way ANOVA, for (DH) one-way ANOVA, two-sided with adjustment of Tukey’s multiple comparisons, P value is indicated in the graph. The numbers under blots represent the value (the ratio to Tubulin) of grayscale quantification. Source data are provided as a Source data file.
Fig. 8
Fig. 8. Schematic model of Hsc70 promoted anti-tumor immunity by targeting PD-L1 degradation through eMI.
Endogenous-level Hsc70 plays a critical role in mediating basal levels of PD-L1 recycling and degradation. An elevated expression of Hsc70 or an augmentation in Hsc70 levels induced by AUY-922 disrupts the fundamental PD-L1 recycling mechanism, results in enhanced internalization of cytoplasmic PD-L1 by Hsc70, leading to its transport to late endosomes where it undergoes degradation by lysosomes. Furthermore, Hsc70 competes with CMTM6 for binding sites on PD-L1, thus diminishing PD-L1 to recycle back to the cell membrane via CMTM6. Together, this diminished recycling reduces the interaction between PD-L1 on tumor cells and PD-1 on T cells, ultimately reactivating T cell-mediated anti-tumor immunity. Graph was created with BioRender.com, released under a Creative Commons Attribution-NonCommercial-NoDerivs 4.0 International license.

Similar articles

Cited by

References

    1. Sanmamed MF, Chen L. A paradigm shift in cancer immunotherapy: from enhancement to normalization. Cell. 2018;175:313–326. doi: 10.1016/j.cell.2018.09.035. - DOI - PMC - PubMed
    1. Kim TK, Vandsemb EN, Herbst RS, Chen L. Adaptive immune resistance at the tumour site: mechanisms and therapeutic opportunities. Nat. Rev. Drug Discov. 2022;21:529–540. doi: 10.1038/s41573-022-00493-5. - DOI - PubMed
    1. Kubli SP, Berger T, Araujo DV, Siu LL, Mak TW. Beyond immune checkpoint blockade: emerging immunological strategies. Nat. Rev. Drug Discov. 2021;20:899–919. doi: 10.1038/s41573-021-00155-y. - DOI - PubMed
    1. Bonaventura P, et al. Cold tumors: a therapeutic challenge for immunotherapy. Front Immunol. 2019;10:168. doi: 10.3389/fimmu.2019.00168. - DOI - PMC - PubMed
    1. Sharma P, Hu-Lieskovan S, Wargo JA, Ribas A. Primary, adaptive, and acquired resistance to cancer immunotherapy. Cell. 2017;168:707–723. doi: 10.1016/j.cell.2017.01.017. - DOI - PMC - PubMed

MeSH terms