Randomized Controlled Trial
. 2024 May 18;15(1):4224.
doi: 10.1038/s41467-024-48414-x.

Original COVID-19 priming regimen impacts the immunogenicity of bivalent BA.1 and BA.5 boosters

Collaborators, Affiliations
Randomized Controlled Trial

Original COVID-19 priming regimen impacts the immunogenicity of bivalent BA.1 and BA.5 boosters

Luca M Zaeck et al. Nat Commun. .

Abstract

Waning antibody responses after COVID-19 vaccination combined with the emergence of the SARS-CoV-2 Omicron lineage led to reduced vaccine effectiveness. As a countermeasure, bivalent mRNA-based booster vaccines encoding the ancestral spike protein in combination with that of Omicron BA.1 or BA.5 were introduced. Since then, different BA.2-descendent lineages have become dominant, such as XBB.1.5, JN.1, or EG.5.1. Here, we report post-hoc analyses of data from the SWITCH-ON study, assessing how different COVID-19 priming regimens affect the immunogenicity of bivalent booster vaccinations and breakthrough infections (NCT05471440). BA.1 and BA.5 bivalent vaccines boosted neutralizing antibodies and T-cells up to 3 months after boost; however, cross-neutralization of XBB.1.5 was poor. Interestingly, different combinations of prime-boost regimens induced divergent responses: participants primed with Ad26.COV2.S developed lower binding antibody levels after bivalent boost while neutralization and T-cell responses were similar to mRNA-based primed participants. In contrast, the breadth of neutralization was higher in mRNA-primed and bivalent BA.5 boosted participants. Combined, our data further support the current use of monovalent vaccines based on circulating strains when vaccinating risk groups, as recently recommended by the WHO. We emphasize the importance of the continuous assessment of immune responses targeting circulating variants to guide future COVID-19 vaccination policies.


Conflict of interest statement

The authors declare no competing interests.

Figures

Fig. 1
Fig. 1. SWITCH-ON trial enrollment.
A total of 592 healthcare workers (HCW) were screened for eligibility. Before inclusion in this study, HCW received either Ad26.COV2.S or an mRNA-based (mRNA-1273 or BNT162b2) priming vaccination regimen, followed by at least one mRNA-based booster vaccination. Of the 592 HCW, 434 were included and randomized 1:1 to the direct boost (n = 219) or the postponed boost (n = 215) group. Following dropouts, a total of 183 HCW received an Omicron BA.5 bivalent vaccine in the postponed boost group.
Fig. 2
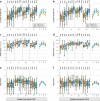
Fig. 2. Antibody and T-cell responses after bivalent booster vaccination.
af Detection of (ancestral) spike (S)-specific binding IgG antibodies (a, d), ancestral SARS-CoV-2 neutralizing antibodies (b, e), and T-cell responses measured by interferon-gamma (IFN-γ) release assay (IGRA) (c, f) after Omicron BA.1 (ac) or BA.5 (df) bivalent booster vaccination at baseline, and 7 days, 28 days, and 3 months post-boost. Colors indicate the specific prime-boost regimen (orange = Ad26.COV2.S prime, BNT162b2 Omicron BA.1 or BA.5 boost; yellow = Ad26.COV2.S prime, mRNA-1273.214 or mRNA-1273.222 boost; dark red = SARS-CoV-2 infection prime, BNT162b2 Omicron BA.1 or BA.5 boost; light red = SARS-CoV-2 infection prime, mRNA-1273.214 or mRNA-1273.222 boost; dark blue = mRNA-based prime, BNT162b2 Omicron BA.1 or BA.5 boost; light blue = mRNA-based prime, mRNA-1273.214 or mRNA-1273.222 boost). Data are shown in box-and-whisker plots, with the horizontal lines indicating the median, the bounds of the boxes indicating the interquartile range (IQR), and the whiskers indicating the range. Bold numbers above the plots represent the respective geometric mean (titer) per timepoint. The line graphs next to each panel depict a time course of the respective geometric mean values with 95% confidence intervals. The number of biologically independent samples (serum or whole blood) used per assay is shown in Supplementary Table S4.
Fig. 3
Fig. 3. Antibody and T-cell responses after different original priming and bivalent booster vaccinations.
af Detection of (ancestral) spike (S)-specific binding IgG antibodies (a, b), ancestral SARS-CoV-2 neutralizing antibodies (c, d), and T-cell responses measured by interferon-gamma (IFN-γ) release assay (IGRA) (e, f) based on the different combinations of original priming regimen after Omicron BA.1 (a, c, e) or BA.5 (b, d, f) bivalent booster vaccination at baseline, and 7 days, 28 days, and 3 months post-boost. Colors indicate the specific prime-boost regimen (orange = Ad26.COV2.S prime, BNT162b2 Omicron BA.1 or BA.5 boost; yellow = Ad26.COV2.S prime, mRNA-1273.214 or mRNA-1273.222 boost; dark blue = mRNA-based prime, BNT162b2 Omicron BA.1 or BA.5 boost; light blue = mRNA-based prime, mRNA-1273.214 or mRNA-1273.222 boost). Data are shown in box-and-whisker plots, with the horizontal lines indicating the median, the bounds of the boxes indicating the interquartile range (IQR), and the whiskers indicating the range. Bold numbers above the plots represent the respective geometric mean (titer) per timepoint. The line graphs next to each panel depict a time course of the respective geometric mean values with 95% confidence intervals. The number of biologically independent samples (serum or whole blood) used per assay is shown in Supplementary Table S4.
Fig. 4
Fig. 4. Antibody and T-cell responses after Omicron BA.1/BA.5 bivalent booster vaccination separated by booster manufacturer.
af Detection of (ancestral) spike (S)-specific binding IgG antibodies (a, d), ancestral SARS-CoV-2 neutralizing antibodies (b, e), and T-cell responses measured by interferon-gamma (IFN-γ) release assay (IGRA) (c, f) after Omicron BA.1 (ac) or BA.5 (df) bivalent booster vaccination with either BNT162b2 Omicron BA.1 or BA.5 (blue) or mRNA-1273.214 or mRNA-1273.222 (green) at baseline, and 7 days, 28 days, and 3 months post-boost. Data are shown in box-and-whisker plots, with the horizontal lines indicating the median, the bounds of the boxes indicating the interquartile range (IQR), and the whiskers indicating the range. Bold numbers above the plots represent the respective geometric mean (titer) per timepoint. Italic numbers below the plots indicate fold changes relative to the baseline. The number of biologically independent samples (serum or whole blood) used per assay is shown in Supplementary Table S4.
Fig. 5
Fig. 5. Breadth of the neutralizing antibody response after bivalent booster vaccination.
a, b Detection of neutralizing antibodies targeting ancestral SARS-CoV-2 and Omicron BA.1, BA.5, and XBB.1.5 variants after Omicron BA.1 (a) or BA.5 (b) bivalent booster vaccination at baseline, and 7 days, 28 days, and 3 months post-boost. Colors indicate the specific prime-boost regimen (orange = Ad26.COV2.S prime, BNT162b2 Omicron BA.1 or BA.5 boost; yellow = Ad26.COV2.S prime, mRNA-1273.214 or mRNA-1273.222 boost; dark red = SARS-CoV-2 infection prime, BNT162b2 Omicron BA.1 or BA.5 boost; light red = SARS-CoV-2 infection prime, mRNA-1273.214 or mRNA-1273.222 boost; dark blue = mRNA-based prime, BNT162b2 Omicron BA.1 or BA.5 boost; light blue = mRNA-based prime, mRNA-1273.214 or mRNA-1273.222 boost). cf Correlation between 50% plaque reduction neutralization (PRNT50) titers against ancestral SARS-CoV-2 and the Omicron BA.1 (c, d) or BA.5 (e, f) variants over time after Omicron BA.1 (c, e) or BA.5 (d, f) vaccination at baseline, and 7 days, 28 days, and 3 months post-boost. Colored symbols indicate the specific timepoints (yellow = baseline [0 d]; teal = 7 d; purple = 28 d; orange = 77 d [c,e]/98 d [d, f]). The arrows connect the correlated geometric means (+95% confidence intervals [CI]) per timepoint and visualize the neutralization kinetics. g, h Radar plots depicting the variant-specific PRNT50 titers relative to ancestral SARS-CoV-2 neutralization (set to 100%) after vaccination with bivalent Omicron BA.1 or BA.5. The plots are grouped either by the administered Omicron BA.1 (orange) or BA.5 (purple) bivalent booster vaccination (g) or the original priming regimen (vector-based = yellow; mRNA-based = blue) after Omicron BA.5 bivalent vaccination (h). Data in (a, b) are shown in box-and-whisker plots, with the horizontal lines indicating the median, the bounds of the boxes indicating the interquartile range (IQR), and the whiskers indicating the range. Bold numbers above the plots represent the respective geometric mean (titer) per timepoint. The line graphs next to each panel depict a time course of the respective geometric mean values with 95% confidence intervals. The number of biologically independent sera is shown in Supplementary Table S4.
Fig. 6
Fig. 6. Antibody and T-cell responses after breakthrough infection.
a Sampling procedure for participants in the postponed boost group who had a breakthrough infection before their intended vaccination with the bivalent Omicron BA.5 booster vaccine (n = 12). They were subsequently excluded from the vaccination trajectory and invited to participate in a sub-study on the immunogenicity of natural SARS-CoV-2 infection. Samples were collected at enrollment, and 7 and 28 days after the participants tested positive. Created with BioRender.com. bd Detection of (ancestral) S-specific binding IgG antibodies (b), T-cell responses measured by interferon-gamma (IFN-γ) release assay (IGRA) (c), and neutralizing antibodies targeting ancestral SARS-CoV-2 and Omicron BA.1, BA.5, and XBB.1.5 variants (d) before, and 7 and 28 days after breakthrough infection, which was contracted before intended vaccination with the bivalent Omicron BA.5 booster vaccine (yellow = Ad26.COV2.S prime; red = SARS-CoV-2 infection prime; blue = mRNA-based prime). Data are shown in box-and-whisker plots, with the horizontal lines indicating the median, the bounds of the boxes indicating the interquartile ranges (IQR), and the whiskers indicating the range. Bold numbers above the plots represent the respective geometric mean (titer) per timepoint. The line graphs next to each panel depict a time course of the respective geometric mean values with 95% confidence intervals. While the solid lines show the geometric mean values of the data from the box-and-whisker plots in the same panel, the dashed lines show reference values from comparable timepoints after either Omicron BA.1 (green) or BA.5 (orange) bivalent vaccination.

Similar articles

Cited by

References

    1. Watson OJ, et al. Global impact of the first year of COVID-19 vaccination: a mathematical modelling study. Lancet Infect. Dis. 2022;22:1293–1302. doi: 10.1016/S1473-3099(22)00320-6. - DOI - PMC - PubMed
    1. Suthar AB, et al. Public health impact of COVID-19 vaccines in the US: observational study. BMJ. 2022;377:e069317. doi: 10.1136/bmj-2021-069317. - DOI - PMC - PubMed
    1. Wu N, et al. Long-term effectiveness of COVID-19 vaccines against infections, hospitalisations, and mortality in adults: findings from a rapid living systematic evidence synthesis and meta-analysis up to December, 2022. Lancet Respir. Med. 2023;11:439–452. doi: 10.1016/S2213-2600(23)00015-2. - DOI - PMC - PubMed
    1. Kurhade C, et al. Low neutralization of SARS-CoV-2 Omicron BA.2.75.2, BQ.1.1 and XBB.1 by parental mRNA vaccine or a BA.5 bivalent booster. Nat. Med. 2023;29:344–347. doi: 10.1038/s41591-022-02162-x. - DOI - PubMed
    1. Wang Q, et al. Alarming antibody evasion properties of rising SARS-CoV-2 BQ and XBB subvariants. Cell. 2023;186:279–286 e278. doi: 10.1016/j.cell.2022.12.018. - DOI - PMC - PubMed

Publication types

MeSH terms

Substances

Supplementary concepts