Genome-scale analysis of interactions between genetic perturbations and natural variation
- PMID: 38762544
- PMCID: PMC11102447
- DOI: 10.1038/s41467-024-48626-1
Genome-scale analysis of interactions between genetic perturbations and natural variation
Abstract
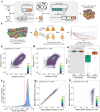
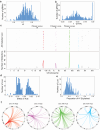
Interactions between genetic perturbations and segregating loci can cause perturbations to show different phenotypic effects across genetically distinct individuals. To study these interactions on a genome scale in many individuals, we used combinatorial DNA barcode sequencing to measure the fitness effects of 8046 CRISPRi perturbations targeting 1721 distinct genes in 169 yeast cross progeny (or segregants). We identified 460 genes whose perturbation has different effects across segregants. Several factors caused perturbations to show variable effects, including baseline segregant fitness, the mean effect of a perturbation across segregants, and interacting loci. We mapped 234 interacting loci and found four hub loci that interact with many different perturbations. Perturbations that interact with a given hub exhibit similar epistatic relationships with the hub and show enrichment for cellular processes that may mediate these interactions. These results suggest that an individual's response to perturbations is shaped by a network of perturbation-locus interactions that cannot be measured by approaches that examine perturbations or natural variation alone.
© 2024. The Author(s).
Conflict of interest statement
The authors declare no competing interests.
Figures


Update of
-
Genome-scale analysis of interactions between genetic perturbations and natural variation.bioRxiv [Preprint]. 2024 Jan 16:2023.05.06.539663. doi: 10.1101/2023.05.06.539663. bioRxiv. 2024. Update in: Nat Commun. 2024 May 18;15(1):4234. doi: 10.1038/s41467-024-48626-1. PMID: 38293072 Free PMC article. Updated. Preprint.
Similar articles
-
Genome-scale analysis of interactions between genetic perturbations and natural variation.bioRxiv [Preprint]. 2024 Jan 16:2023.05.06.539663. doi: 10.1101/2023.05.06.539663. bioRxiv. 2024. Update in: Nat Commun. 2024 May 18;15(1):4234. doi: 10.1038/s41467-024-48626-1. PMID: 38293072 Free PMC article. Updated. Preprint.
-
Mitochondrial-nuclear epistasis contributes to phenotypic variation and coadaptation in natural isolates of Saccharomyces cerevisiae.Genetics. 2014 Nov;198(3):1251-65. doi: 10.1534/genetics.114.168575. Epub 2014 Aug 27. Genetics. 2014. PMID: 25164882 Free PMC article.
-
Dynamic genetic architecture of yeast response to environmental perturbation shed light on origin of cryptic genetic variation.PLoS Genet. 2020 May 11;16(5):e1008801. doi: 10.1371/journal.pgen.1008801. eCollection 2020 May. PLoS Genet. 2020. PMID: 32392218 Free PMC article.
-
Gene-gene and gene-environment interactions in complex traits in yeast.Yeast. 2018 Jun;35(6):403-416. doi: 10.1002/yea.3304. Epub 2018 Feb 22. Yeast. 2018. PMID: 29322552 Review.
-
It's not magic - Hsp90 and its effects on genetic and epigenetic variation.Semin Cell Dev Biol. 2019 Apr;88:21-35. doi: 10.1016/j.semcdb.2018.05.015. Epub 2018 Jun 6. Semin Cell Dev Biol. 2019. PMID: 29807130 Free PMC article. Review.
Cited by
-
Interaction of genetic variants activates latent metabolic pathways in yeast.Nat Commun. 2025 Aug 27;16(1):8014. doi: 10.1038/s41467-025-63306-4. Nat Commun. 2025. PMID: 40866353 Free PMC article.
-
Epistasis and cryptic QTL identified using modified bulk segregant analysis of copper resistance in budding yeast.bioRxiv [Preprint]. 2024 Nov 12:2024.10.28.620582. doi: 10.1101/2024.10.28.620582. bioRxiv. 2024. Update in: Genetics. 2025 Apr 17;229(4):iyaf026. doi: 10.1093/genetics/iyaf026. PMID: 39605464 Free PMC article. Updated. Preprint.
-
Epistasis and cryptic QTL identified using modified bulk segregant analysis of copper resistance in budding yeast.Genetics. 2025 Apr 17;229(4):iyaf026. doi: 10.1093/genetics/iyaf026. Genetics. 2025. PMID: 39989051
-
Pooled PPIseq: Screening the SARS-CoV-2 and human interface with a scalable multiplexed protein-protein interaction assay platform.PLoS One. 2025 Jan 17;20(1):e0299440. doi: 10.1371/journal.pone.0299440. eCollection 2025. PLoS One. 2025. PMID: 39823405 Free PMC article.
-
Global epistasis in budding yeast driven by many natural variants whose effects scale with fitness.bioRxiv [Preprint]. 2025 Jun 1:2025.05.28.656710. doi: 10.1101/2025.05.28.656710. bioRxiv. 2025. Update in: Genetics. 2025 Jul 18:iyaf136. doi: 10.1093/genetics/iyaf136. PMID: 40501638 Free PMC article. Updated. Preprint.
References
MeSH terms
Grants and funding
LinkOut - more resources
Full Text Sources

